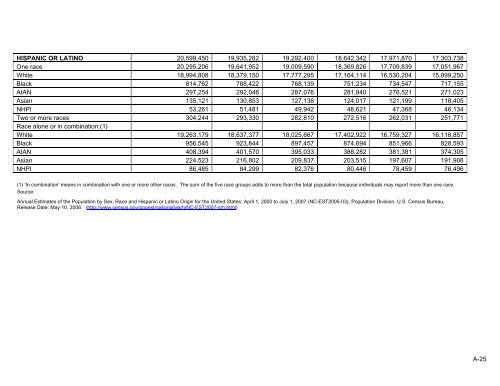
HISPANIC OR LATINO 20,599,450 19,935,282 19,292,400 18,642,342 17,971,870 17,303,738 One race 20,295,206 19,641,952 19,009,590 18,369,826 17,709,839 17,051,967 White 18,994,808 18,379,150 17,777,295 17,164,114 16,530,204 15,899,250 Black 814,762 788,422 768,139 751,234 734,547 717,155 AIAN 297,254 292,046 287,076 281,840 276,521 271,023 Asian 135,121 130,853 127,138 124,017 121,199 118,405 NHPI 53,261 51,481 49,942 48,621 47,368 46,134 Two or more races 304,244 293,330 282,810 272,516 262,031 251,771 Race alone or in combination:(1) White 19,263,179 18,637,377 18,025,667 17,402,922 16,759,327 16,118,857 Black 956,545 923,844 897,457 874,694 851,966 828,593 AIAN 408,394 401,570 395,033 388,282 381,381 374,305 Asian 224,523 216,802 209,837 203,515 197,607 191,908 NHPI 86,485 84,299 82,376 80,446 78,459 76,496 (1) 'In combination' means in combination <strong>with</strong> one or more o<strong>the</strong>r races. The sum of <strong>the</strong> five race groups adds to more than <strong>the</strong> total population because individuals may report more than one race. Source: Annual Estimates of <strong>the</strong> <strong>Population</strong> by Sex, Race and Hispanic or Latino Origin <strong>for</strong> <strong>the</strong> United States: April 1, 2000 to July 1, 2007 (NC-EST2005-03), <strong>Population</strong> Division, U.S. Census Bureau, Release Date: May 10, 2006. (http://www.census.gov/popest/national/asrh/NC-EST2007-srh.html) A-25
Table A.3.3 Annual Estimates of <strong>the</strong> Resident <strong>Population</strong> by Sex, Race, and Hispanic Origin <strong>for</strong> <strong>the</strong> U.S.: July 1, 1990 to July 1 1999 Sex and <strong>Population</strong> Estimates Race/Ethnicity 1-Jul-99 1-Jul-98 1-Jul-97 1-Jul-96 1-Jul-95 1-Jul-94 1-Jul-93 1-Jul-92 1-Jul-91 1-Jul-90 ALL RACES 272,691,000 270,248,000 267,784,000 265,229,000 262,803,000 260,327,000 257,783,000 255,030,000 252,153,000 249,464,000 Male 133,277,000 132,030,000 130,783,000 129,504,000 128,294,000 127,049,000 125,788,000 124,424,000 122,956,000 121,626,000 Female 139,414,000 138,218,000 137,001,000 135,724,000 134,510,000 133,278,000 131,995,000 130,606,000 129,197,000 127,838,000 WHITE 224,611,000 222,980,000 221,333,000 219,636,000 218,023,000 216,379,000 214,691,000 212,874,000 210,975,000 209,196,000 Male 110,336,000 109,480,000 108,624,000 107,749,000 106,920,000 106,067,000 105,208,000 104,287,000 103,297,000 102,399,000 Female 114,275,000 113,500,000 112,710,000 111,888,000 111,104,000 110,312,000 109,483,000 108,586,000 107,678,000 106,796,000 WHITE, NON- HISPANIC 196,049,000 195,414,000 194,746,000 194,037,000 193,328,000 192,538,000 191,697,000 190,726,000 189,634,000 188,596,000 Male 95,962,000 95,590,000 95,207,000 94,810,000 94,418,000 93,985,000 93,539,000 93,028,000 92,433,000 91,901,000 Female 100,087,000 99,824,000 99,539,000 99,228,000 98,909,000 98,552,000 98,158,000 97,698,000 97,201,000 96,694,000 BLACK 34,862,000 34,427,000 33,989,000 33,537,000 33,116,000 32,672,000 32,195,000 31,683,000 31,137,000 30,629,000 Male 16,557,000 16,342,000 16,127,000 15,907,000 15,706,000 15,491,000 15,262,000 15,014,000 14,738,000 14,495,000 Female 18,305,000 18,085,000 17,863,000 17,630,000 17,411,000 17,181,000 16,933,000 16,669,000 16,399,000 16,134,000 BLACK, NON- HISPANIC 196,049,000 195,414,000 194,746,000 194,037,000 193,328,000 192,538,000 191,697,000 190,726,000 189,634,000 188,596,000 Male 15,674,000 15,488,000 15,302,000 15,113,000 14,940,000 14,756,000 14,557,000 14,339,000 14,092,000 13,874,000 Female 17,418,000 17,230,000 17,038,000 16,838,000 16,650,000 16,454,000 16,238,000 16,007,000 15,767,000 15,529,000 AMERICAN INDIAN 2,397,000 2,361,000 2,326,000 2,290,000 2,256,000 2,222,000 2,187,000 2,149,000 2,112,000 2,075,000 Male 1,187,000 1,169,000 1,152,000 1,134,000 1,117,000 1,101,000 1,084,000 1,065,000 1,047,000 1,029,000 Female 1,211,000 1,192,000 1,174,000 1,156,000 1,138,000 1,121,000 1,103,000 1,084,000 1,065,000 1,046,000 AMERICAN INDIAN, NON- HISPANIC 2,026,000 2,002,000 1,979,000 1,956,000 1,932,000 1,909,000 1,884,000 1,858,000 1,831,000 1,804,000 Male 996,000 985,000 973,000 962,000 951,000 939,000 927,000 915,000 901,000 888,000 Female 1,030,000 1,018,000 1,006,000 994,000 982,000 970,000 957,000 944,000 930,000 916,000 ASIAN 10,820,000 10,479,000 10,135,000 9,765,000 9,408,000 9,054,000 8,710,000 8,324,000 7,929,000 7,564,000 Male 5,196,000 5,039,000 4,881,000 4,714,000 4,551,000 4,390,000 4,234,000 4,057,000 3,874,000 3,703,000 Female 5,624,000 5,441,000 5,254,000 5,051,000 4,857,000 4,664,000 4,476,000 4,267,000 4,055,000 3,861,000 ASIAN, NON- HISPANIC 10,186,000 9,863,000 9,537,000 9,186,000 8,846,000 8,511,000 8,184,000 7,817,000 7,439,000 7,090,000 Male 4,883,000 4,734,000 4,585,000 4,427,000 4,272,000 4,120,000 3,972,000 3,804,000 3,629,000 3,466,000 A-26
- Page 1 and 2:
HCUP Methods Series
- Page 3 and 4:
Population Denominator Data for Use
- Page 5 and 6:
Table A.3.2 Annual Estimates of the
- Page 7 and 8:
Table 1. Population Denominator Dat
- Page 9 and 10:
• Update cycle for data • Web r
- Page 11 and 12: American Community Survey (ACS) Spo
- Page 13 and 14: Behavioral Risk Factors Surveillanc
- Page 15 and 16: Bureau of Labor Statistics (BLS) Sp
- Page 17 and 18: Centers for Medicare & Medicaid Ser
- Page 19 and 20: Economic Research Service (ERS) Spo
- Page 21 and 22: Health Resources and Services Admin
- Page 23 and 24: Medical Expenditure Panel Survey (M
- Page 25 and 26: National Comorbidity Survey Replica
- Page 27 and 28: National Health Interview Survey (N
- Page 29 and 30: National Vital Statistics System (N
- Page 31 and 32: Small Area Health Insurance Estimat
- Page 33 and 34: Statistical Abstract of the United
- Page 35 and 36: Survey of Income and Program Partic
- Page 37 and 38: Washington, Wyoming, Alaska, Montan
- Page 39 and 40: Table A.1.1 Annual Estimates of the
- Page 41 and 42: Table A.1.2 Annual Estimates of the
- Page 43 and 44: Table A.1.3 Annual Estimates of the
- Page 45 and 46: Table A.2.1 Annual Estimates of the
- Page 47 and 48: Population Estimates Sex and Age (Y
- Page 49 and 50: Population Estimates Sex and Age (Y
- Page 51 and 52: Table A.2.3 Annual Estimates of the
- Page 53 and 54: Table A.3.1 Annual Estimates of the
- Page 55 and 56: Sex, Hispanic or Latino origin, Pop
- Page 57 and 58: Sex, Hispanic or Latino origin, Pop
- Page 59 and 60: Sex, Hispanic or Latino origin, and
- Page 61: Sex, Hispanic or Latino origin, and
- Page 65 and 66: Table A.4.1 Annual Estimates of the
- Page 67 and 68: APPENDIX B. USING PAYER POPULATION
- Page 69 and 70: Time Dimension Differences Problem: