Left Further Behind - Child Poverty Action Group
Left Further Behind - Child Poverty Action Group
Left Further Behind - Child Poverty Action Group
You also want an ePaper? Increase the reach of your titles
YUMPU automatically turns print PDFs into web optimized ePapers that Google loves.
What is the best poverty line to use?<br />
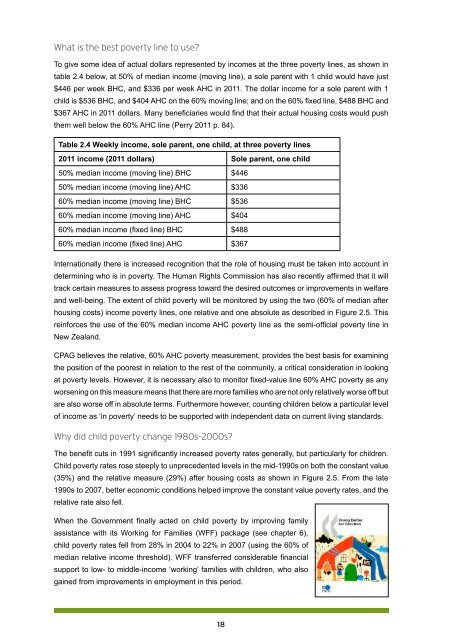
To give some idea of actual dollars represented by incomes at the three poverty lines, as shown in<br />
table 2.4 below, at 50% of median income (moving line), a sole parent with 1 child would have just<br />
$446 per week BHC, and $336 per week AHC in 2011. The dollar income for a sole parent with 1<br />
child is $536 BHC, and $404 AHC on the 60% moving line; and on the 60% fixed line, $488 BHC and<br />
$367 AHC in 2011 dollars. Many beneficiaries would find that their actual housing costs would push<br />
them well below the 60% AHC line (Perry 2011 p. 84).<br />
Table 2.4 Weekly income, sole parent, one child, at three poverty lines<br />
2011 income (2011 dollars) Sole parent, one child<br />
50% median income (moving line) BHC $446<br />
50% median income (moving line) AHC $336<br />
60% median income (moving line) BHC $536<br />
60% median income (moving line) AHC $404<br />
60% median income (fixed line) BHC $488<br />
60% median income (fixed line) AHC $367<br />
Internationally there is increased recognition that the role of housing must be taken into account in<br />
determining who is in poverty. The Human Rights Commission has also recently affirmed that it will<br />
track certain measures to assess progress toward the desired outcomes or improvements in welfare<br />
and well-being. The extent of child poverty will be monitored by using the two (60% of median after<br />
housing costs) income poverty lines, one relative and one absolute as described in Figure 2.5. This<br />
reinforces the use of the 60% median income AHC poverty line as the semi-official poverty line in<br />
New Zealand.<br />
CPAG believes the relative, 60% AHC poverty measurement, provides the best basis for examining<br />
the position of the poorest in relation to the rest of the community, a critical consideration in looking<br />
at poverty levels. However, it is necessary also to monitor fixed-value line 60% AHC poverty as any<br />
worsening on this measure means that there are more families who are not only relatively worse off but<br />
are also worse off in absolute terms. <strong>Further</strong>more however, counting children below a particular level<br />
of income as ‘in poverty’ needs to be supported with independent data on current living standards.<br />
Why did child poverty change 1980s–2000s?<br />
The benefit cuts in 1991 significantly increased poverty rates generally, but particularly for children.<br />
<strong>Child</strong> poverty rates rose steeply to unprecedented levels in the mid-1990s on both the constant value<br />
(35%) and the relative measure (29%) after housing costs as shown in Figure 2.5. From the late<br />
1990s to 2007, better economic conditions helped improve the constant value poverty rates, and the<br />
relative rate also fell.<br />
When the Government finally acted on child poverty by improving family<br />
assistance with its Working for Families (WFF) package (see chapter 6),<br />
child poverty rates fell from 28% in 2004 to 22% in 2007 (using the 60% of<br />
median relative income threshold). WFF transferred considerable financial<br />
support to low- to middle-income ‘working’ families with children, who also<br />
gained from improvements in employment in this period.<br />
18


