Left Further Behind - Child Poverty Action Group
Left Further Behind - Child Poverty Action Group
Left Further Behind - Child Poverty Action Group

You also want an ePaper? Increase the reach of your titles
YUMPU automatically turns print PDFs into web optimized ePapers that Google loves.
Presentations at the Welfare Forum at the University of Auckland in September 2010 highlighted<br />
the many difficulties experienced by sole parents, and hence their children, in a recession when<br />
the policy focus is on paid work. 13 Interviewees in CPAG’s What work counts? also reported major<br />
difficulties in both accessing and maintaining employment (Dale, Wynd, St John, & O’Brien, 2010).<br />
As well as entrenching poverty in these sectors of the population, the absence of employment<br />
opportunities for sole parents and young people and the strengthened discourse around ‘welfare<br />
dependency’ as exemplified in the Ministry of Social Development’s Future Focus literature and the<br />
WWG’s reports, cast them in the role of the undeserving poor. The noticeable change in the public<br />
policy rhetoric from welfare to workfare has significant consequences for children, as is reflected in<br />
this report.<br />
What is child poverty like in 2011?<br />
The statistical data on inequality and poverty provides a range of useful information about the position<br />
of children and families, but the nature of their collection via surveys means that the latest available<br />
figures do not necessarily reflect current conditions. It is therefore useful to monitor other indicators.<br />
Foodbank usage is one of those indicators.<br />
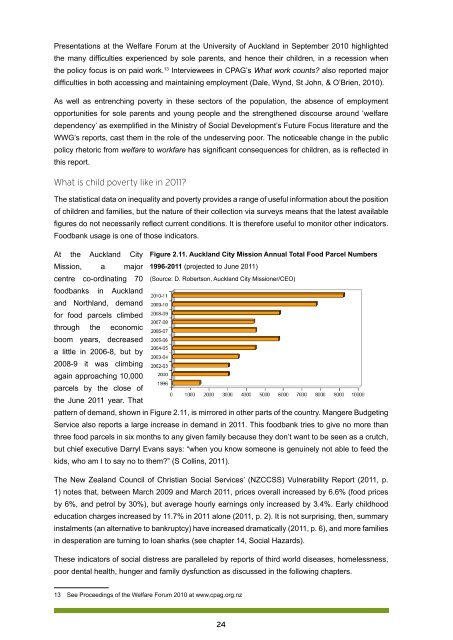
At the Auckland City Figure 2.11. Auckland City Mission Annual Total Food Parcel Numbers<br />
Mission, a major 1996-2011 (projected to June 2011)<br />
centre co-ordinating 70 (Source: D. Robertson, Auckland City Missioner/CEO)<br />
foodbanks in Auckland<br />
and Northland, demand<br />
for food parcels climbed<br />
through the economic<br />
boom years, decreased<br />
a little in 2006-8, but by<br />
2008-9 it was climbing<br />
again approaching 10,000<br />
parcels by the close of<br />
the June 2011 year. That<br />
pattern of demand, shown in Figure 2.11, is mirrored in other parts of the country. Mangere Budgeting<br />
Service also reports a large increase in demand in 2011. This foodbank tries to give no more than<br />
three food parcels in six months to any given family because they don’t want to be seen as a crutch,<br />
but chief executive Darryl Evans says: “when you know someone is genuinely not able to feed the<br />
kids, who am I to say no to them?” (S Collins, 2011).<br />
The New Zealand Council of Christian Social Services’ (NZCCSS) Vulnerability Report (2011, p.<br />
1) notes that, between March 2009 and March 2011, prices overall increased by 6.6% (food prices<br />
by 6%, and petrol by 30%), but average hourly earnings only increased by 3.4%. Early childhood<br />
education charges increased by 11.7% in 2011 alone (2011, p. 2). It is not surprising, then, summary<br />
instalments (an alternative to bankruptcy) have increased dramatically (2011, p. 6), and more families<br />
in desperation are turning to loan sharks (see chapter 14, Social Hazards).<br />
These indicators of social distress are paralleled by reports of third world diseases, homelessness,<br />
poor dental health, hunger and family dysfunction as discussed in the following chapters.<br />
13 See Proceedings of the Welfare Forum 2010 at www.cpag.org.nz<br />
24