- Page 1: Left further behind: how policies f
- Page 5 and 6: Preface Child Poverty Action Group
- Page 7 and 8: Executive Summary In 2008, Child Po
- Page 9 and 10: Contents Preface 1 Executive Summar
- Page 11 and 12: more and more relegated to the char
- Page 13 and 14: Another approach is to give childre
- Page 15 and 16: Chapter 2. Child poverty and inequa
- Page 17 and 18: Inequality in New Zealand has a sig
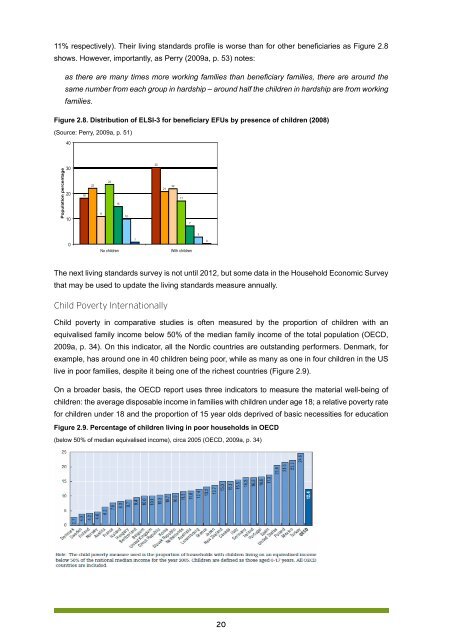
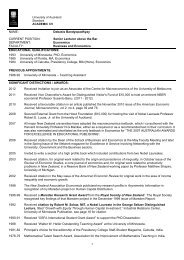
- Page 19 and 20: Poverty in New Zealand There are a
- Page 21 and 22: On the three measures of poverty in
- Page 23: But by 2009, after the early impact
- Page 27 and 28: Table 2.5. Ages of children depende
- Page 29 and 30: Despite the wealth of information o
- Page 31 and 32: Although the whole process was pred
- Page 33 and 34: that they belong in the society and
- Page 35 and 36: entrenchment of their poverty and s
- Page 37 and 38: Chapter 4. The Whānau Ora Approach
- Page 39 and 40: Development data shows, Māori chil
- Page 41 and 42: It is yet to be seen if, over time,
- Page 43 and 44: We are participants in a great Comm
- Page 45 and 46: Thus policies designed to improve d
- Page 47 and 48: social networks and increased self-
- Page 49 and 50: Chapter 5. New Zealand Pacific Chil
- Page 51 and 52: Figure 5.2. Proportion of Children
- Page 53 and 54: Table 5.1. Risk Factors for Hospita
- Page 55 and 56: PART TWO Chapter 6. Working for Fam
- Page 57 and 58: very significant increase in financ
- Page 59 and 60: from Work & Income. So, a few famil
- Page 61 and 62: Government-appointed Tax Working Gr
- Page 63 and 64: Thus the IWTC part of the WFF polic
- Page 65 and 66: Even between 2004 and 2007 when num
- Page 67 and 68: CPAG’s argument was that the IWTC
- Page 69 and 70: abatement from NZ$35,000. An Austra
- Page 71 and 72: Conclusions and key recommendations
- Page 73 and 74: Appendix 1. CPAG V Attorney General
- Page 75 and 76:
Appendix 2. Is a universal child be
- Page 77 and 78:
appear to address child poverty, it
- Page 79 and 80:
If the child is a new baby and the
- Page 81 and 82:
The Australian Productivity Commiss
- Page 83 and 84:
New Zealand has a large number of c
- Page 85 and 86:
Overall, New Zealand is well behind
- Page 87 and 88:
• The result is multiplied by a p
- Page 89 and 90:
of the liable parent’s ability to
- Page 91 and 92:
In contrast to New Zealand, in Aust
- Page 93 and 94:
Ultimately the extent to which oppo
- Page 95 and 96:
Chapter 9. Tax Reform and the macro
- Page 97 and 98:
Claiming that such ‘welfare’ tr
- Page 99 and 100:
Table 9.2 Gains from the October 20
- Page 101 and 102:
distinction between income from wor
- Page 103 and 104:
in these is said to go towards meet
- Page 105 and 106:
Early in 2010, the Māori Party’s
- Page 107 and 108:
While depreciation expenses are not
- Page 109 and 110:
Definition In her work on poverty a
- Page 111 and 112:
Table 10.2. Findings of investigati
- Page 113 and 114:
International Studies There are a n
- Page 115 and 116:
a range of cross-national studies s
- Page 117 and 118:
Appendix. Physical Punishment of ch
- Page 119 and 120:
Other recommendations included that
- Page 121 and 122:
Ye & Ors v Minister of Immigration
- Page 123 and 124:
Thus 22% of our country’s childre
- Page 125 and 126:
applying incorrect law in its benef
- Page 127 and 128:
The health inequity of children wit
- Page 129 and 130:
In recognition of the range of fact
- Page 131 and 132:
In New Zealand during the period 20
- Page 133 and 134:
Rheumatic Fever Acute rheumatic fev
- Page 135 and 136:
ehaviour. (D. M. Fergusson, Boden,
- Page 137 and 138:
al., 2007). A further study showed
- Page 139 and 140:
strongest associations with not get
- Page 141 and 142:
Chapter 13. Housing poverty and chi
- Page 143 and 144:
Not surprisingly tenant households
- Page 145 and 146:
Figure 13.2. Housing outgoings to i
- Page 147 and 148:
through a major recession. Figure 1
- Page 149 and 150:
Treasury has made broad estimates t
- Page 151 and 152:
Chapter 14. The impact of social ha
- Page 153 and 154:
• On average smokers have babies
- Page 155 and 156:
National drinking surveys have cons
- Page 157 and 158:
or café was associated with an ext
- Page 159 and 160:
Gambling in low-income communities
- Page 161 and 162:
After speaking strongly against Bea
- Page 163 and 164:
PART FOUR Chapter 15. Early childho
- Page 165 and 166:
Economic inequality will now be ass
- Page 167 and 168:
Funding issues • Vote Education E
- Page 169 and 170:
To those that have, more shall be g
- Page 171 and 172:
The significant difference between
- Page 173 and 174:
Table 15.7. Under 5’s population
- Page 175 and 176:
Table 15.9. Distribution of ECE pla
- Page 177 and 178:
Table 15.11. Changes in ECE provisi
- Page 179 and 180:
Chapter 16. A turn for the worse? S
- Page 181 and 182:
their primary school lives. Disadva
- Page 183 and 184:
funded by a charitable trust. Why i
- Page 185 and 186:
Conclusions This paper has traverse
- Page 187 and 188:
Also, employers do not have time or
- Page 189 and 190:
isk and prefer older, more experien
- Page 191 and 192:
ankruptcy and accepts that some of
- Page 193 and 194:
It will be several years before we
- Page 195 and 196:
children themselves, but also their
- Page 197 and 198:
the impact of child poverty but not
- Page 199 and 200:
Productivity costs, New Zealand The
- Page 201 and 202:
in government revenue of $500 milli
- Page 203 and 204:
Table 18.2. Relative effect of soci
- Page 205 and 206:
1.8% of GDP. DeVol and Bedroussian
- Page 207 and 208:
Eventually all benefits to society,
- Page 209 and 210:
Bringing up children in poverty has
- Page 211 and 212:
Chapter 5. New Zealand Pacific Chil
- Page 213 and 214:
Chapter 11. Families, Children, and
- Page 215 and 216:
• Base the new model of ECE provi
- Page 217 and 218:
References Aber, J. L., & Bennett,
- Page 219 and 220:
Bishop, R., Berryman, M., & Richard
- Page 221 and 222:
Cheung, J. (2007). Wealth Dispariti
- Page 223 and 224:
Delamere, J. P. (2011). New Zealand
- Page 225 and 226:
Families Commission. (2009). What s
- Page 227 and 228:
Henderson, J. (1963). Ratana: The M
- Page 229 and 230:
Jaine, R., Baker, M., & Venugopal,
- Page 231 and 232:
Lotu-Iiga, S. (2011). Peseta Sam Lo
- Page 233 and 234:
Ministry of Health. (2009b). Oral H
- Page 235 and 236:
New Zealand Police. (2010). Seventh
- Page 237 and 238:
Perry, B. (2011). Household Incomes
- Page 239 and 240:
Senate Community Affairs Reference
- Page 241 and 242:
Telford, M., & May, S. (2010). PISA
- Page 243 and 244:
United Nations Committee on the Rig
- Page 245 and 246:
241
- Page 247 and 248:
243