Bridging the Aging and Developmental Disabilities Service ... - rrtcadd
Bridging the Aging and Developmental Disabilities Service ... - rrtcadd
Bridging the Aging and Developmental Disabilities Service ... - rrtcadd

Create successful ePaper yourself
Turn your PDF publications into a flip-book with our unique Google optimized e-Paper software.
developmental disabilities require a much broader array of services <strong>and</strong> supports, <strong>and</strong> nei<strong>the</strong>r <strong>the</strong><br />
aging network nor most CILs have experience in serving this population.<br />
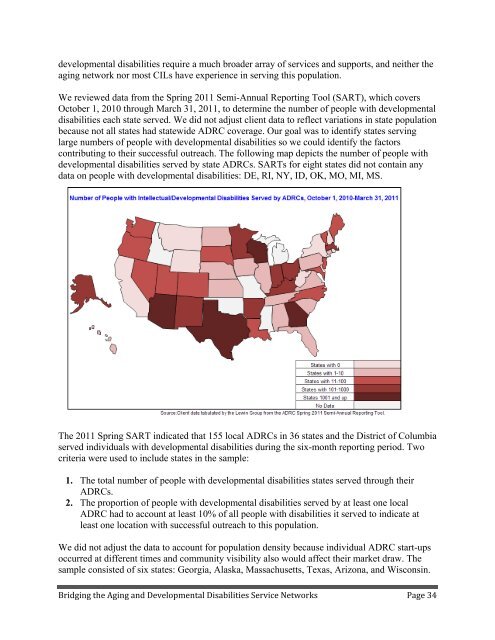
We reviewed data from <strong>the</strong> Spring 2011 Semi-Annual Reporting Tool (SART), which covers<br />
October 1, 2010 through March 31, 2011, to determine <strong>the</strong> number of people with developmental<br />
disabilities each state served. We did not adjust client data to reflect variations in state population<br />
because not all states had statewide ADRC coverage. Our goal was to identify states serving<br />
large numbers of people with developmental disabilities so we could identify <strong>the</strong> factors<br />
contributing to <strong>the</strong>ir successful outreach. The following map depicts <strong>the</strong> number of people with<br />
developmental disabilities served by state ADRCs. SARTs for eight states did not contain any<br />
data on people with developmental disabilities: DE, RI, NY, ID, OK, MO, MI, MS.<br />
The 2011 Spring SART indicated that 155 local ADRCs in 36 states <strong>and</strong> <strong>the</strong> District of Columbia<br />
served individuals with developmental disabilities during <strong>the</strong> six-month reporting period. Two<br />
criteria were used to include states in <strong>the</strong> sample:<br />
1. The total number of people with developmental disabilities states served through <strong>the</strong>ir<br />
ADRCs.<br />
2. The proportion of people with developmental disabilities served by at least one local<br />
ADRC had to account at least 10% of all people with disabilities it served to indicate at<br />
least one location with successful outreach to this population.<br />
We did not adjust <strong>the</strong> data to account for population density because individual ADRC start-ups<br />
occurred at different times <strong>and</strong> community visibility also would affect <strong>the</strong>ir market draw. The<br />
sample consisted of six states: Georgia, Alaska, Massachusetts, Texas, Arizona, <strong>and</strong> Wisconsin.<br />
<strong>Bridging</strong> <strong>the</strong> <strong>Aging</strong> <strong>and</strong> <strong>Developmental</strong> <strong>Disabilities</strong> <strong>Service</strong> Networks Page 34