Filter Design
Filter Design
Filter Design

You also want an ePaper? Increase the reach of your titles
YUMPU automatically turns print PDFs into web optimized ePapers that Google loves.
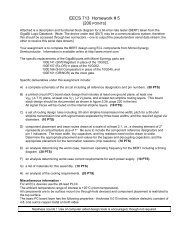
Observations<br />
Table: <strong>Filter</strong> gain versus frequency<br />
Frequency<br />
[kHz]<br />
Vin<br />
[V]<br />
Vout<br />
[V]<br />
0.1<br />
0.2<br />
0.5<br />
0.75<br />
1<br />
2<br />
3<br />
4<br />
5<br />
6<br />
7<br />
8<br />
9<br />
10<br />
15<br />
20<br />
50<br />
100<br />
Gain<br />
[V/V]<br />
Gain [dB] =<br />
20log 10 |Vout/Vin|<br />
1. Use your experimentally measured values to plot the magnitude of the Gain [dB]<br />
( | |) of the frequency response (the Bode plot) with Excel. Plot the<br />
magnitude (on a linear scale) on the ordinate axis and frequency (on a log scale) on<br />
the abscissa axis. This is the magnitude portion of the Bode plot.<br />
2. Use your experimentally measured values to plot the Gain [V/V] ( ) with Excel.<br />
Plot the magnitude (on a log scale) on the ordinate axis and frequency (on a log<br />
scale) on the abscissa axis.<br />
3. Compare the plot of of your experimentally measured values to your PSpice<br />
simulation of of the circuit. Or, you may compare the plot of | | of<br />
your experimentally measured values to your PSpice simulation of | |.<br />
4. You are required to include the following PSpice plots:<br />
a) (log scale) vs. frequency (log scale)<br />
b) | | (linear scale) vs. frequency (log scale)<br />
i. Consult Prelab 5 for how to plot | | in PSpice.<br />
5. Determine the cut off frequency from the plot of | | (linear scale) vs.<br />
frequency (log scale) and compare it to the theoretical value.<br />
6. Compare the actual and theoretical 20 Log (1 + R F /R G ) pass band gains.<br />
Date Last Modified: 5/6/2013 11:53 PM 7