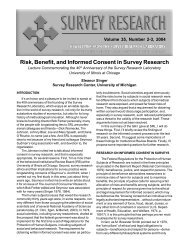
Toward an Understanding of Cross-Cultural Differences in ...
Toward an Understanding of Cross-Cultural Differences in ...
Toward an Understanding of Cross-Cultural Differences in ...

Create successful ePaper yourself
Turn your PDF publications into a flip-book with our unique Google optimized e-Paper software.
<strong>Toward</strong> <strong>an</strong> Underst<strong>an</strong>d<strong>in</strong>g <strong>of</strong><br />
<strong>Cross</strong>-<strong>Cultural</strong> <strong>Cultural</strong> <strong>Differences</strong> <strong>in</strong><br />
Acquiescence <strong>an</strong>d Extremity Scor<strong>in</strong>g<br />
Fons J. R. v<strong>an</strong> de Vijver<br />
University <strong>of</strong> Tilburg, the Netherl<strong>an</strong>ds, <strong>an</strong>d<br />
North-West University, South Africa<br />
George Ploubidis<br />
University <strong>of</strong> Cambridge, UK<br />
Di<strong>an</strong>ne A. v<strong>an</strong> Hemert<br />
University <strong>of</strong> Amsterdam, the Netherl<strong>an</strong>ds
Outl<strong>in</strong>e<br />
• Response styles <strong>in</strong> cross-cultural cultural research<br />
• Universality<br />
• Poorly understood (not just a nuis<strong>an</strong>ce):<br />
• What do response styles me<strong>an</strong>?<br />
• <strong>Toward</strong> a framework <strong>of</strong> underst<strong>an</strong>d<strong>in</strong>g cross-<br />
cultural differences <strong>in</strong> response styles<br />
• Secondary <strong>an</strong>alysis data <strong>of</strong> ISSP data<br />
• Integration:<br />
• Tentative model <strong>of</strong> response styles, useful for<br />
cross-cultural cultural research
Theoretical Outl<strong>in</strong>e<br />
What are the problems?<br />
1. Do response styles differ<br />
systematically across cultures? <br />
Description<br />
2. What is their pattern<strong>in</strong>g<br />
(relationship with <strong>in</strong>dividual- <strong>an</strong>d<br />
country-level variables)? <br />
Interpretation
• From a design perspective response<br />
styles c<strong>an</strong> be seen as characteristics<br />
<strong>of</strong><br />
• 1. Respondents<br />
• Persons /Cultures<br />
• 2. Instruments<br />
• Items / Constructs<br />
• 3. Interaction <strong>of</strong> subjects <strong>an</strong>d<br />
<strong>in</strong>struments
• Current study:<br />
• 1 (respondents) <strong>an</strong>d 2<br />
(<strong>in</strong>struments)<br />
• 3 (Interactions) not further studied<br />
here:<br />
• (a) no cross-cultural cultural data<br />
• (b) possibly less import<strong>an</strong>t source <strong>of</strong><br />
vari<strong>an</strong>ce
1. Response Styles as Person<br />
Characteristics: : Trick or Trait<br />
• Two views on the psychological<br />
me<strong>an</strong><strong>in</strong>g <strong>of</strong> response styles<br />
• “Trick”<br />
“Trick”:: styles distort the view on the<br />
particip<strong>an</strong>t’s reality/real attitudes<br />
• “Trait”<br />
“Trait”:: styles are personality<br />
characteristics (e.g., social desirability is<br />
part <strong>of</strong> agreeableness)
2. Response Styles as Stimulus<br />
Characteristics<br />
• Sensitivity <strong>of</strong> doma<strong>in</strong> may be<br />
import<strong>an</strong>t:<br />
• More personal/sensitive doma<strong>in</strong>s<br />
are more prone to response styles<br />
(cf. more <strong>in</strong>terviewer effects when<br />
deal<strong>in</strong>g with more sensitive topics)
<strong>Cross</strong>-<strong>Cultural</strong> <strong>Cultural</strong> Studies <strong>of</strong><br />
Acquiescence <strong>an</strong>d Extremity Scor<strong>in</strong>g<br />
• Watk<strong>in</strong>s & Cheung (1995)<br />
• less acquiescence among children <strong>in</strong> Australia compared<br />
to children <strong>in</strong> Ch<strong>in</strong>a, Nepal, <strong>an</strong>d the Philipp<strong>in</strong>es.<br />
• Grimm & Church (1999)<br />
• Philipp<strong>in</strong>e students acquiesced more th<strong>an</strong> Americ<strong>an</strong><br />
students<br />
• Steenkamp & Baumgartner (1998)<br />
• Greek respondents more acquiescence th<strong>an</strong> British <strong>an</strong>d<br />
Belgi<strong>an</strong> respondents.<br />
• Baumgartner & Steenkamp (2001)<br />
• Greek <strong>an</strong>d Portuguese respondents displayed more<br />
acquiescence th<strong>an</strong> respondents from other EU countries.
Acquiescence tendencies are consistent at<br />
country-level<br />
Smith (2004):<br />
Signific<strong>an</strong>t correlations between acquiescence<br />
<strong>in</strong>dicators at country level across studies:
V<strong>an</strong> Herk, , Poort<strong>in</strong>ga, & Verhallen, , 2004<br />
• Study <strong>of</strong> acquiescence <strong>an</strong>d extremity<br />
scor<strong>in</strong>g<br />
• <strong>in</strong> six EU countries (Greece, Italy, Spa<strong>in</strong>,<br />
Fr<strong>an</strong>ce, Germ<strong>an</strong>y, <strong>an</strong>d the United K<strong>in</strong>gdom)<br />
• market<strong>in</strong>g surveys (doma<strong>in</strong>s: cook<strong>in</strong>g,<br />
wash<strong>in</strong>g, <strong>an</strong>d personal care)<br />
• Conclusion:<br />
“These two response styles were found to be<br />
more present <strong>in</strong> the Mediterr<strong>an</strong>e<strong>an</strong> th<strong>an</strong> <strong>in</strong><br />
Northwestern Europe”
Correlates <strong>of</strong> Response Styles<br />
• Individual level:<br />
• Acquiescence shows a negative relation with<br />
education (McClendon, 1991b; Mirowsky &<br />
Ross, 1991; Naray<strong>an</strong> & Krosnick, , 1996;<br />
Schum<strong>an</strong> & Presser, 1981; Watson, 1992)<br />
• <strong>Cultural</strong> level<br />
• Social Desirability negatively related to GNP<br />
(V<strong>an</strong> Hemert et al., 2002), which is highly<br />
correlated with educational <strong>in</strong>dicators<br />
• Tri<strong>an</strong>dis (presentation yesterday):<br />
• More acquiescence <strong>in</strong> tighter societies (which dem<strong>an</strong>d<br />
more conformity)<br />
• More extreme response styles <strong>in</strong> simpler societies.
Questions/Hypotheses<br />
• Question 1<br />
• What are the relative sizes <strong>of</strong> <strong>in</strong>dividual-<br />
<strong>an</strong>d country-level differences <strong>in</strong><br />
acquiescence <strong>an</strong>d extremity scor<strong>in</strong>g?<br />
• Hypothesis 1:<br />
• Country differences are larger <strong>in</strong><br />
doma<strong>in</strong>s with more personal<br />
<strong>in</strong>volvement
• Question 2:<br />
• What are correlates <strong>of</strong> extremity scor<strong>in</strong>g<br />
<strong>an</strong>d acquiescence at <strong>in</strong>dividual <strong>an</strong>d<br />
country level?<br />
• Hypothesis 2:<br />
• Individual level:<br />
• Response style <strong>in</strong>dicators are<br />
negatively related to <strong>in</strong>dicators<br />
<strong>of</strong> resourcefulness (studied here:<br />
socioeconomic status <strong>an</strong>d<br />
gender)<br />
• Country level:<br />
• Country scores on both response<br />
style <strong>in</strong>dicators are negatively<br />
related to affluence
Survey 1: Social Inequality (1992)<br />
COUNTRY<br />
Valid<br />
AUS<br />
D-W<br />
D-E<br />
GB<br />
USA<br />
A<br />
H<br />
I<br />
N<br />
S<br />
CS<br />
SLO<br />
PL<br />
BG<br />
RUS<br />
NZ<br />
CDN<br />
RP<br />
Total<br />
Cumulative<br />
Frequency Percent Valid Percent Percent<br />
2203 9.2 9.2 9.2<br />
2297 9.6 9.6 18.8<br />
1094 4.6 4.6 23.4<br />
1066 4.5 4.5 27.9<br />
1273 5.3 5.3 33.2<br />
1027 4.3 4.3 37.5<br />
1250 5.2 5.2 42.7<br />
996 4.2 4.2 46.9<br />
1538 6.4 6.4 53.3<br />
749 3.1 3.1 56.4<br />
1101 4.6 4.6 61.1<br />
1049 4.4 4.4 65.4<br />
1636 6.8 6.8 72.3<br />
1198 5.0 5.0 77.3<br />
1983 8.3 8.3 85.6<br />
1239 5.2 5.2 90.8<br />
1004 4.2 4.2 95.0<br />
1200 5.0 5.0 100.0<br />
23903 100.0 100.0
Questionnaire (In All Surveys)<br />
• Response scales:<br />
• Strongly Agree to Strongly Disagree<br />
format
• Questionnaire should consist <strong>of</strong><br />
both positively <strong>an</strong>d negatively<br />
worded items (not all ISSP data<br />
could be used)<br />
• Mode <strong>of</strong> adm<strong>in</strong>istration varied<br />
across countries:<br />
• self-complet<strong>in</strong>g questionnaire or<br />
face-to<br />
to-face <strong>in</strong>terviews<br />
• Questionnaires were not<br />
developed as (unifactorial(<br />
unifactorial)<br />
psychometric scales; no<br />
equivalence studied here!
Examples <strong>of</strong> Questions (8 items)
Surveys: (1) Family <strong>an</strong>d gender (1994)<br />
Country<br />
Valid<br />
Cumulative<br />
Frequency Percent Valid Percent Percent<br />
AUS - Australia<br />
1779 5.3 5.3 5.3<br />
D-W - Germ<strong>an</strong>y-West 2324 6.9 6.9 12.2<br />
D-E - Germ<strong>an</strong>y-East 1097 3.3 3.3 15.5<br />
GB - Great Brita<strong>in</strong><br />
984 2.9 2.9 18.4<br />
NIRL- Northern Irel<strong>an</strong>d 647 1.9 1.9 20.3<br />
USA - United States 1447 4.3 4.3 24.6<br />
A - Austria<br />
977 2.9 2.9 27.6<br />
H - Hungary<br />
1500 4.5 4.5 32.0<br />
I - Italy<br />
1018 3.0 3.0 35.0<br />
IRL - Irel<strong>an</strong>d<br />
938 2.8 2.8 37.8<br />
NL - Netherl<strong>an</strong>ds<br />
1968 5.9 5.9 43.7<br />
N - Norway<br />
2087 6.2 6.2 49.9<br />
S - Sweden<br />
1272 3.8 3.8 53.7<br />
CZ - Czech Republic 1024 3.0 3.0 56.7<br />
SLO - Slovenia<br />
1032 3.1 3.1 59.8<br />
PL - Pol<strong>an</strong>d<br />
1597 4.8 4.8 64.6<br />
BG - Bulgaria<br />
1126 3.4 3.4 67.9<br />
RUS - Russia<br />
1998 5.9 5.9 73.9<br />
NZ - New Zeal<strong>an</strong>d 1047 3.1 3.1 77.0<br />
CDN - C<strong>an</strong>ada<br />
1440 4.3 4.3 81.3<br />
RP - Philipp<strong>in</strong>es<br />
1200 3.6 3.6 84.9<br />
IL - Israel<br />
1287 3.8 3.8 88.7<br />
J - Jap<strong>an</strong><br />
1307 3.9 3.9 92.6<br />
E - Spa<strong>in</strong><br />
2494 7.4 7.4 100.0<br />
Total<br />
33590 100.0 100.0
Examples <strong>of</strong> Questions (U.S.A.; 25 items)
Survey 2:<br />
Religion<br />
(1998)<br />
Valid<br />
Country<br />
Cumulative<br />
Frequency Percent Valid Percent Percent<br />
AUS-Australia<br />
1310 3.4 3.4 3.4<br />
D-W-Germ<strong>an</strong>y-West 1000 2.6 2.6 5.9<br />
D-E-Germ<strong>an</strong>y-East 1006 2.6 2.6 8.5<br />
GB-Great Brita<strong>in</strong><br />
804 2.1 2.1 10.6<br />
NIRL-Northern Irel<strong>an</strong>d 812 2.1 2.1 12.6<br />
USA-United States 1284 3.3 3.3 15.9<br />
A-Austria<br />
1002 2.6 2.6 18.5<br />
H-Hungary<br />
1000 2.6 2.6 21.1<br />
I-Italy<br />
1008 2.6 2.6 23.6<br />
IRL-Irel<strong>an</strong>d<br />
1010 2.6 2.6 26.2<br />
NL-Netherl<strong>an</strong>ds<br />
2020 5.2 5.2 31.4<br />
N-Norway<br />
1532 3.9 3.9 35.3<br />
S-Sweden<br />
1189 3.0 3.0 38.4<br />
CZ-Czech Republic 1224 3.1 3.1 41.5<br />
SLO-Slovenia<br />
1006 2.6 2.6 44.1<br />
PL-Pol<strong>an</strong>d<br />
1147 2.9 2.9 47.0<br />
BG-Bulgaria<br />
1102 2.8 2.8 49.8<br />
RUS-Russia<br />
1703 4.4 4.4 54.2<br />
NZ-New Zeal<strong>an</strong>d<br />
998 2.6 2.6 56.8<br />
CDN-C<strong>an</strong>ada<br />
974 2.5 2.5 59.3<br />
RP-Philipp<strong>in</strong>es<br />
1200 3.1 3.1 62.3<br />
IL-Israel Jews Arabs 1208 3.1 3.1 65.4<br />
J-Jap<strong>an</strong><br />
1368 3.5 3.5 68.9<br />
E-Spa<strong>in</strong><br />
2488 6.4 6.4 75.3<br />
LV-Latvia<br />
1200 3.1 3.1 78.4<br />
SK-Slovak Republic 1284 3.3 3.3 81.7<br />
F-Fr<strong>an</strong>ce<br />
1133 2.9 2.9 84.6<br />
CY-Cyprus<br />
1000 2.6 2.6 87.1<br />
P-Portugal<br />
1201 3.1 3.1 90.2<br />
RCH-Chile<br />
1503 3.9 3.9 94.1<br />
D-Denmark<br />
1114 2.9 2.9 96.9<br />
CH-Switzerl<strong>an</strong>d<br />
1204 3.1 3.1 100.0<br />
Total<br />
39034 100.0 100.0
Examples <strong>of</strong> Questions (17 items)
Extremity Index<br />
• Extremity score <strong>of</strong> a particip<strong>an</strong>t:<br />
• Proportion <strong>of</strong> items with a score at either<br />
extreme (V<strong>an</strong> Herk et al.: “The relative<br />
number <strong>of</strong> scores given on the extreme<br />
categories <strong>of</strong> a rat<strong>in</strong>g scale. We counted the<br />
responses <strong>in</strong> Categories 1 <strong>an</strong>d 5 on the 5-po<strong>in</strong>t 5<br />
rat<strong>in</strong>g scales”)<br />
• R<strong>an</strong>ge:<br />
• from 0 to 1<br />
• Interpretation:<br />
• Values close to 0 denote a low <strong>in</strong>cidence <strong>an</strong>d<br />
values close to 1 denote high <strong>in</strong>cidence <strong>of</strong><br />
extremity scor<strong>in</strong>g
Acquiescence Index<br />
• Acquiescence score <strong>of</strong> a particip<strong>an</strong>t:<br />
• proportion <strong>of</strong> responses <strong>in</strong> the two extreme<br />
agreement response categories m<strong>in</strong>us the<br />
proportion <strong>of</strong> responses <strong>in</strong> the opposite<br />
extremes<br />
• So, the number <strong>of</strong> 1s <strong>an</strong>d 2s m<strong>in</strong>us the<br />
number <strong>of</strong> 4s <strong>an</strong>d 5s, divided by the total<br />
number <strong>of</strong> items<br />
• Only bipolar (more or less bal<strong>an</strong>ced) scales<br />
used<br />
• R<strong>an</strong>ge:<br />
• from -11 to 1<br />
• Interpretation:<br />
• Values close to -1: low <strong>in</strong>cidence; values close<br />
to 1: high <strong>in</strong>cidence
Individual-Level Background Variables<br />
• Gender: Male = 1; Female = 2.<br />
• Status:
Results<br />
• 1. Relative proportion <strong>of</strong> <strong>in</strong>dividual-<br />
<strong>an</strong>d country-level differences to<br />
score variation
• Hypothesis:<br />
• Country differences are larger <strong>in</strong><br />
doma<strong>in</strong>s with more personal<br />
<strong>in</strong>volvement (assumption: family<br />
> religion, <strong>in</strong>equality)<br />
• Analysis:<br />
• DV: response style <strong>in</strong>dices<br />
• Vari<strong>an</strong>ce components model (null<br />
model, <strong>in</strong>tercept only)
Intraclass Correlations<br />
• Prop. <strong>of</strong> vari<strong>an</strong>ce accounted for by country<br />
• Cohen’s cut<strong>of</strong>f values <strong>of</strong> effects sizes:<br />
•.01<br />
(small), .06 (medium), .10 (large)<br />
Acquiescence<br />
Extremity<br />
Scor<strong>in</strong>g<br />
Me<strong>an</strong><br />
Social Inequality<br />
.06<br />
.23<br />
.15<br />
Religion<br />
.07<br />
.11<br />
.09<br />
Family<br />
.32<br />
.25<br />
.29
• Large effects <strong>in</strong> most <strong>an</strong>alyses<br />
• Subst<strong>an</strong>tial country differences <strong>in</strong> both<br />
response styles<br />
• Larger country differences <strong>in</strong><br />
extremity scor<strong>in</strong>g th<strong>an</strong> <strong>in</strong><br />
acquiescence<br />
• First hypothesis supported:<br />
• Family doma<strong>in</strong> largest effect sizes
Results<br />
• 2. Individual- <strong>an</strong>d Country-level<br />
correlates <strong>of</strong> response-style<br />
style<br />
<strong>in</strong>dicators<br />
• Analysis split up <strong>in</strong> two parts:<br />
1. Multilevel <strong>an</strong>alysis<br />
• Individual-level level factors (“Level 1”):<br />
• Gender <strong>an</strong>d socioeconomic status (multilevel<br />
model)<br />
• Country level (“Level 2”)<br />
2. Country-level factors (correlations)
1. Role <strong>of</strong> Individual Factors<br />
• Design:<br />
• Multilevel model with gender <strong>an</strong>d SES as<br />
predictors at <strong>in</strong>dividual level<br />
• (country-level predictors not used, due<br />
to the large number <strong>of</strong> country-level<br />
factors studied relative to the number <strong>of</strong><br />
countries <strong>in</strong>volved)
Design (cont’d)<br />
• Dist<strong>in</strong>ction between fixed <strong>an</strong>d<br />
r<strong>an</strong>dom slopes <strong>an</strong>d <strong>in</strong>tercepts<br />
• Regression coefficients fixed (fixed<br />
covariates)<br />
• Gender (scor<strong>in</strong>g: 1 = female; 2 = male)<br />
• Status (scor<strong>in</strong>g: higher score, higher class)<br />
• Intercepts r<strong>an</strong>dom at both levels<br />
• Signific<strong>an</strong>ce <strong>in</strong>dicates that there is r<strong>an</strong>dom<br />
variation at both <strong>in</strong>dividual level <strong>an</strong>d country<br />
level
Signific<strong>an</strong>ce <strong>of</strong> Effects<br />
Regression<br />
coefficient<br />
Intercepts<br />
Acquiescence<br />
Gender<br />
Status<br />
Country<br />
Social <strong>in</strong>equality<br />
-<br />
-<br />
sign.<br />
Religion<br />
-<br />
-<br />
sign.<br />
Family<br />
-<br />
-<br />
sign.<br />
Extremity<br />
Social <strong>in</strong>equality<br />
-<br />
-<br />
sign.<br />
Religion<br />
+<br />
+<br />
sign.<br />
Family<br />
-<br />
-<br />
sign.
Conclusions<br />
• Acquiescence…<br />
• shows systematic differences<br />
across <strong>in</strong>dividuals <strong>an</strong>d countries<br />
• is more prevalent among females<br />
th<strong>an</strong> among males<br />
• is negatively related to<br />
socioeconomic status
• Extremity<br />
• shows systematic differences across<br />
<strong>in</strong>dividuals <strong>an</strong>d countries<br />
• is usually stronger among females th<strong>an</strong><br />
among males (differential norms for<br />
expressiveness)<br />
• is negatively related to SES.<br />
• However,<br />
• relationship is moderated by doma<strong>in</strong> for<br />
extremity;<br />
• relationship is doma<strong>in</strong> <strong>in</strong>dependent for<br />
acquiescence
Correlations <strong>of</strong> Styles<br />
• Are both response styles correlated<br />
at <strong>in</strong>dividual <strong>an</strong>d/or country level?
Correlations at Individual Level<br />
• Scores st<strong>an</strong>dardized per country<br />
• Correlations <strong>of</strong> both response styles<br />
• Family: .00<br />
• Religion: .04* (N(<br />
= 38,945)<br />
• Inequality: .08* (N(<br />
= 23,714)
Averaged Correlations <strong>of</strong><br />
Response Styles at Country Level<br />
Extremity<br />
Acquiescence<br />
Extremity<br />
Acquiescence<br />
.36<br />
.09 (separate)<br />
.21 (averaged)<br />
.34<br />
Conclusion: With<strong>in</strong>-style cross-survey correlations<br />
signific<strong>an</strong>t, cross-style differences weaker
Conclusion<br />
• Both styles fairly consistent across<br />
surveys (me<strong>an</strong> r <strong>of</strong> about .35) (Note:<br />
found for identical response formats<br />
<strong>in</strong> surveys deal<strong>in</strong>g with different<br />
topics)<br />
• Styles are weakly correlated (at both<br />
<strong>in</strong>dividual <strong>an</strong>d country level)
2. Country-Level Correlates:<br />
Country Indicators Used<br />
• Purchas<strong>in</strong>g Power Parity<br />
• This measure reflects countries' price<br />
level <strong>of</strong> a fixed basket <strong>of</strong> goods <strong>an</strong>d<br />
services <strong>in</strong> <strong>in</strong>ternational dollars (World<br />
B<strong>an</strong>k, 1999)
Country Indicators Used (Cont’d)<br />
• Educational System<br />
• Georgas <strong>an</strong>d Berry (1995) comb<strong>in</strong>ed the<br />
teacher—pupil ratio <strong>in</strong> the first level, the<br />
gross enrolment <strong>in</strong> the first, the second<br />
<strong>an</strong>d the third level, <strong>an</strong>d the percentage<br />
<strong>of</strong> adult illiterates. The factor scores<br />
<strong>in</strong>dicate educational system
Country Indicators Used (Cont’d)<br />
• Ecological Factor<br />
• Georgas <strong>an</strong>d Berry (1995) comb<strong>in</strong>ed<br />
three ecological <strong>in</strong>dicators to establish<br />
<strong>an</strong> ecological factor: highest <strong>an</strong>d lowest<br />
average temperature <strong>an</strong>d highest<br />
monthly level <strong>of</strong> precipitation. Factor<br />
scores <strong>of</strong> this factor were used.
Country Indicators Used (Cont’d)<br />
• Political Rights <strong>an</strong>d Democracy<br />
• Comb<strong>in</strong>ation <strong>of</strong>:<br />
• Hum<strong>an</strong>a (1986) collected data from several United Nations<br />
<strong>in</strong>struments <strong>an</strong>d constructed the Hum<strong>an</strong> Rights Index for<br />
rights <strong>an</strong>d freedoms <strong>in</strong> 40 categories<br />
• The <strong>in</strong>dices for Political Rights <strong>in</strong> the year 1984 <strong>an</strong>d 1985<br />
from the Freedom House<br />
• Civil Liberties were taken (same source)<br />
• Inglehart’s (1997) measure <strong>of</strong> the level <strong>of</strong> democracy <strong>in</strong><br />
1990<br />
• Inglehart’s (1997) measure <strong>of</strong> the Stability <strong>of</strong> democracy<br />
(expressed <strong>in</strong> number <strong>of</strong> years <strong>of</strong> cont<strong>in</strong>uous democracy)<br />
• In each dataset, we factor <strong>an</strong>alyzed all five variables.<br />
One-factor solutions were found <strong>in</strong> all three sets, with<br />
eigenvalues from 4.56 to 4.77, expla<strong>in</strong><strong>in</strong>g 91.18% to<br />
95.40% <strong>of</strong> vari<strong>an</strong>ce. Factor scores on this Political Rights<br />
<strong>an</strong>d Democracy factor were used for further <strong>an</strong>alyses.
Country Indicators Used (Cont’d)<br />
• Religious Denom<strong>in</strong>ation<br />
• The Percentage <strong>of</strong> Protest<strong>an</strong>ts, taken from the<br />
Georgas <strong>an</strong>d Berry (1995) database
Country Indicators Used (Cont’d)<br />
• Subjective Well-Be<strong>in</strong>g<br />
• Diener’s subjective well-be<strong>in</strong>g was derived<br />
from Diener, Diener, , <strong>an</strong>d Diener (1995)<br />
• Inglehart’s (1997) measure <strong>of</strong> subjective well-<br />
be<strong>in</strong>g was derived from questions concern<strong>in</strong>g<br />
happ<strong>in</strong>ess <strong>an</strong>d satisfaction with life as a whole<br />
(World Values Survey)<br />
• Diener’s measure <strong>an</strong>d Inglehart’s measure<br />
were factor <strong>an</strong>alyzed (eigenvalues(<br />
1.67 to<br />
1.73, expla<strong>in</strong>ed vari<strong>an</strong>ce 83.34% to 86.55%)<br />
<strong>an</strong>d factor scores were used for futher<br />
<strong>an</strong>alyses
Country Indicators Used (Cont’d)<br />
• H<strong>of</strong>stede’s Measures (1980, 2001)<br />
• Individualism (IDV)<br />
• Power Dist<strong>an</strong>ce (PDI)<br />
• Uncerta<strong>in</strong>ty Avoid<strong>an</strong>ce (UAI)<br />
• Mascul<strong>in</strong>ity (MAS)<br />
• Long Term Orientation (LTO)
Country Indicators Used (Cont’d)<br />
• Social Desirability<br />
• Me<strong>an</strong>s<br />
on the Lie Scale <strong>of</strong> the Eysenck<br />
Personality Questionnaire (EPQ;<br />
Eysenck & Eysenck, , 1975) collected<br />
across 38 countries were taken from<br />
V<strong>an</strong> Hemert, V<strong>an</strong> de Vijver, Poort<strong>in</strong>ga,<br />
<strong>an</strong>d Georgas (2002)
Country Indicators Used (Cont’d)<br />
• Big Five Personality Traits<br />
• McCrae (2002):<br />
• Neuroticism<br />
• Extraversion<br />
• Openness to experience<br />
• Agreeableness<br />
• Conscientiousness
Overall: Extremity<br />
• Large effect size <strong>an</strong>d positive<br />
• LTO<br />
• Medium size <strong>an</strong>d positive<br />
Medium size <strong>an</strong>d positive<br />
• UAI, Neuroticism, Social Desirability<br />
• No effect (-.15(<br />
< r < .15)<br />
• Ecology, PDI, Purchas<strong>in</strong>g Power Parity,<br />
Openness to experience, Education<br />
• Small size <strong>an</strong>d negative<br />
• Democracy, Extraversion, IDV<br />
• Medium size <strong>an</strong>d negative<br />
• Subjective well-be<strong>in</strong>g, Percentage Protest<strong>an</strong>ts,<br />
Agreeableness, Conscientiousness
Overall: Acquiescence<br />
• Medium size <strong>an</strong>d positive<br />
• Social Desirability, Neuroticism, UAI, PDI<br />
• Small effect size <strong>an</strong>d positive<br />
• Ecology<br />
• No effect (-.15(<br />
< r < .15)<br />
• MAS, LTO, Conscientiousness, Openness to<br />
experience, Percentage Protest<strong>an</strong>ts<br />
• Small size <strong>an</strong>d negative<br />
• Agreeableness, Extraversion<br />
• Medium size <strong>an</strong>d negative<br />
• Education, Democracy, Subjective well-be<strong>in</strong>g,<br />
Purchas<strong>in</strong>g Power Parity 1997, IDV
Extremity <strong>an</strong>d Acquiescence:<br />
Their Similarities<br />
• Both are more triggered <strong>in</strong> personal<br />
doma<strong>in</strong>s (sensitivity to norms)<br />
• Size <strong>of</strong> correlations with country-level<br />
<strong>in</strong>dicators is similar for both (average<br />
absolute correlations with country<br />
<strong>in</strong>dicators .33 <strong>an</strong>d .29, respectively)
• Strongest relationships were found for Social<br />
Desirability <strong>an</strong>d Long-Term Orientation (East<br />
Asia aga<strong>in</strong>st the rest <strong>of</strong> the world well known<br />
response style to avoid extremes among East<br />
Asi<strong>an</strong>s). So, LTO also seems to be related to a<br />
response style response styles are<br />
<strong>in</strong>terrelated.<br />
• At country level social desirability, average<br />
extremity <strong>an</strong>d average acquiescence constitute<br />
a s<strong>in</strong>gle factor, expla<strong>in</strong><strong>in</strong>g 64% <strong>of</strong> the vari<strong>an</strong>ce
Extremity <strong>an</strong>d Acquiescence:<br />
Their <strong>Differences</strong><br />
• Correlations po<strong>in</strong>t to a somewhat different<br />
me<strong>an</strong><strong>in</strong>g <strong>of</strong> these response styles:<br />
• Extremity is more related to personality<br />
<strong>an</strong>d norms about the expression <strong>of</strong><br />
emotions (negatively related to “feel<strong>in</strong>g<br />
good” factor/ expression <strong>of</strong> positive<br />
emotions)<br />
• Acquiescence is more related to affluence<br />
(which is more related to conformity, Bond<br />
& Smith, 1996)<br />
• Second hypothesis (resourcefulness negative<br />
predictor <strong>of</strong> response styles) only supported for<br />
acquiescence
<strong>Toward</strong> <strong>an</strong> Underst<strong>an</strong>d<strong>in</strong>g <strong>of</strong><br />
<strong>Cross</strong>-<strong>Cultural</strong> <strong>Cultural</strong> <strong>Differences</strong> <strong>in</strong><br />
Response Styles<br />
• Model should <strong>in</strong>volve<br />
Acquiescence, Extremity<br />
Scor<strong>in</strong>g, <strong>an</strong>d Social<br />
Desirability (Johnson & V<strong>an</strong><br />
de Vijver, 2003; V<strong>an</strong> Hemert<br />
et al., 2002)<br />
• Model should <strong>in</strong>tegrate these
• What is the pattern<strong>in</strong>g <strong>of</strong> the<br />
cross-cultural cultural differences?<br />
• Extremity negatively related to<br />
“feel<strong>in</strong>g good”<br />
• Acquiescence negatively related<br />
to affluence<br />
• Comparison <strong>of</strong> relations with V<strong>an</strong><br />
Hemert et al. (2002):<br />
• Correlations with country <strong>in</strong>dicators<br />
are largely identical for acquiescence<br />
<strong>an</strong>d social desirability
The Argument <strong>in</strong> a Nutshell….<br />
• Response styles<br />
• are communication habits (self-<br />
presentation m<strong>an</strong>agement) which work<br />
like lenses traits<br />
• c<strong>an</strong> distort the view on particip<strong>an</strong>ts’ real<br />
attitudes <strong>an</strong>d behaviors tricks<br />
• are fairly consistent across survey topics<br />
• are more prevalent <strong>in</strong> sensitive doma<strong>in</strong>s<br />
• share a core with other response styles,<br />
but also have unique features:<br />
• Extremity has slightly different country-level<br />
correlates th<strong>an</strong> have acquiescence <strong>an</strong>d<br />
social desirability
•Distortion as “trick”, other aspects as “trait”<br />
•Distortion as the <strong>in</strong>tersection<br />
•Communication habits <strong>an</strong>d self-m<strong>an</strong>agement as the union<br />
Acquiescence<br />
Specific norms<br />
about deference<br />
Other<br />
expressiveness<br />
norms<br />
Norms about<br />
express<strong>in</strong>g negative/<br />
positive aspects<br />
Extremity<br />
Resourcefulness/<br />
<strong>in</strong>dependence<br />
Distortion<br />
Norms about<br />
express<strong>in</strong>g<br />
endorsement <strong>of</strong><br />
relev<strong>an</strong>t norms<br />
Specific norms<br />
about conformity<br />
Social Desirability
Implications<br />
• False dichotomy between subst<strong>an</strong>ce<br />
<strong>an</strong>d style/trait <strong>an</strong>d trick<br />
• Response styles……<br />
• tend to re<strong>in</strong>force each other<br />
• tend to systematically affect score<br />
comparisons (both overestimation <strong>an</strong>d<br />
underestimation possible)<br />
• prevalence <strong>of</strong> East—West two-country<br />
comparisons <strong>in</strong> cross-cultural cultural research
• should be taken <strong>in</strong>to account more <strong>of</strong>ten<br />
<strong>in</strong> cross-cultural cultural test<strong>in</strong>g <strong>in</strong> at least two<br />
ways:<br />
1. Their impact on results (<strong>an</strong>d implied bias<br />
toward or aga<strong>in</strong>st the hypothesis <strong>of</strong> <strong>in</strong>terest)<br />
should be acknowledged, both as trick <strong>an</strong>d<br />
trait<br />
• Response styles do not necessarily “expla<strong>in</strong><br />
away” subst<strong>an</strong>tive results<br />
2. Their impact should be measured more<br />
<strong>of</strong>ten (measures <strong>of</strong> perceived norms may be<br />
relev<strong>an</strong>t)
Correlations <strong>of</strong> Extremity with<br />
Purchas<strong>in</strong>g<br />
power<br />
Correlates<br />
Social<br />
Inequality<br />
-.50<br />
*<br />
Religion<br />
.28<br />
Family<br />
-.14<br />
Ecology<br />
-.27<br />
.02<br />
-.14<br />
Education<br />
-.07<br />
.31<br />
-.19<br />
Democracy<br />
-.66<br />
*<br />
.24<br />
-.20<br />
*<br />
% Christi<strong>an</strong>s<br />
-.77<br />
**<br />
-.11<br />
-.51<br />
*
LTO<br />
.52<br />
.71<br />
*<br />
.84<br />
**<br />
Correlations <strong>of</strong> Extremity with<br />
H<strong>of</strong>stede<br />
Correlates<br />
Social<br />
Inequality<br />
Religion<br />
Family<br />
PDI<br />
-.19<br />
-.19<br />
-.16<br />
UAI<br />
.76<br />
**<br />
-.02<br />
.41<br />
IDV<br />
-.18<br />
.06<br />
-.35<br />
MAS<br />
.29<br />
-.02<br />
.46
Correlations <strong>of</strong> Extremity with<br />
Correlates<br />
Social<br />
Inequality<br />
Religion<br />
Family<br />
Neuroticism<br />
.57<br />
-.01<br />
.38<br />
*<br />
Extraversion<br />
-.40<br />
.09<br />
-.20<br />
Openness<br />
-.00<br />
-.27<br />
.30<br />
Agreeableness<br />
-.63<br />
*<br />
.10<br />
-.50<br />
Conscientiousness<br />
-.25<br />
-.15<br />
-.51<br />
Happ<strong>in</strong>ess<br />
-.66<br />
*<br />
-.15<br />
-.59<br />
*<br />
Social desirability<br />
.62<br />
*<br />
.42<br />
.20
% Christi<strong>an</strong>s<br />
-.07<br />
.31<br />
-.25<br />
Correlations <strong>of</strong> Acquiescence with<br />
Purchas<strong>in</strong>g<br />
power<br />
Correlates<br />
Social<br />
<strong>in</strong>equality<br />
-.16<br />
Religion<br />
-.47<br />
Family<br />
-.78<br />
**<br />
Ecology<br />
.37<br />
.12<br />
.09<br />
Education<br />
-.10<br />
-.48<br />
*<br />
-.49<br />
*<br />
Democracy<br />
-.03<br />
-.37<br />
-.77<br />
**
LTO<br />
.07<br />
-.24<br />
.05<br />
Correlations <strong>of</strong> Acquiescence with<br />
H<strong>of</strong>stede<br />
Correlates<br />
Social<br />
<strong>in</strong>equality<br />
Religion<br />
Family<br />
PDI<br />
.14<br />
.34<br />
.44<br />
UAI<br />
.20<br />
.40<br />
.56<br />
*<br />
IDV<br />
.02<br />
-.62<br />
**<br />
-.88<br />
**<br />
MAS<br />
.14<br />
-.07<br />
.24
Correlations <strong>of</strong> Acquiescence with<br />
Correlates<br />
Social<br />
<strong>in</strong>equality<br />
Religion<br />
Family<br />
Neuroticism<br />
.17<br />
.38<br />
.48<br />
Extraversion<br />
-.45<br />
-.18<br />
-.37<br />
Openness<br />
.14<br />
.02<br />
.08<br />
Agreeableness<br />
.10<br />
-.19<br />
-.52<br />
Conscientiousness<br />
.05<br />
.27<br />
-.01<br />
Happ<strong>in</strong>ess<br />
-.05<br />
-.33<br />
-.79<br />
**<br />
Social desirability<br />
.47<br />
.36<br />
.41
Countries R<strong>an</strong>ked from Low to High Scores on<br />
Both Response Sets<br />
Low on Both Low on Extr., High on Acq.<br />
AUS-Australia<br />
NL-Netherl<strong>an</strong>ds<br />
NZ-New Zeal<strong>an</strong>d<br />
N-Norway<br />
E-Spa<strong>in</strong><br />
GB-Great Brita<strong>in</strong><br />
USA-United States<br />
RCH-Chile<br />
CY-Cyprus<br />
F-Fr<strong>an</strong>ce<br />
IRL-Irel<strong>an</strong>d<br />
RP-Philipp<strong>in</strong>es<br />
PL-Pol<strong>an</strong>d<br />
CH-Switzerl<strong>an</strong>d<br />
SLO-Slovenia<br />
LV-Latvia<br />
High on Extr., Low on Acq. High on Both<br />
A-Austria<br />
CDN-C<strong>an</strong>ada<br />
BG-Bulgaria<br />
CZ-Czech Republic<br />
D-W-Germ<strong>an</strong>y-West<br />
D-Denmark<br />
I-Italy<br />
H-Hungary<br />
P-Portugal<br />
IL-Israel Jews Arabs<br />
SK-Slovak Republic<br />
J-Jap<strong>an</strong><br />
S-Sweden<br />
RUS-Russia<br />
D-E-Germ<strong>an</strong>y-East