open file - Viru Peipsi
open file - Viru Peipsi
open file - Viru Peipsi

You also want an ePaper? Increase the reach of your titles
YUMPU automatically turns print PDFs into web optimized ePapers that Google loves.
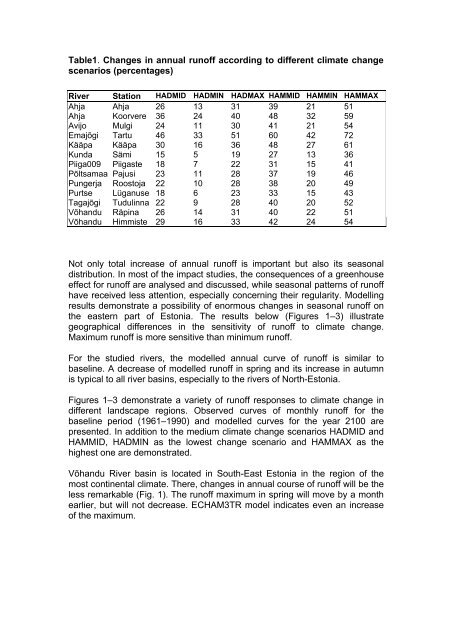
Table1. Changes in annual runoff according to different climate change<br />
scenarios (percentages)<br />
River Station HADMID HADMIN HADMAX HAMMID HAMMIN HAMMAX<br />
Ahja Ahja 26 13 31 39 21 51<br />
Ahja Koorvere 36 24 40 48 32 59<br />
Avijo Mulgi 24 11 30 41 21 54<br />
Emajõgi Tartu 46 33 51 60 42 72<br />
Kääpa Kääpa 30 16 36 48 27 61<br />
Kunda Sämi 15 5 19 27 13 36<br />
Piiga009 Piigaste 18 7 22 31 15 41<br />
Põltsamaa Pajusi 23 11 28 37 19 46<br />
Pungerja Roostoja 22 10 28 38 20 49<br />
Purtse Lüganuse 18 6 23 33 15 43<br />
Tagajõgi Tudulinna 22 9 28 40 20 52<br />
Võhandu Räpina 26 14 31 40 22 51<br />
Võhandu Himmiste 29 16 33 42 24 54<br />
Not only total increase of annual runoff is important but also its seasonal<br />
distribution. In most of the impact studies, the consequences of a greenhouse<br />
effect for runoff are analysed and discussed, while seasonal patterns of runoff<br />
have received less attention, especially concerning their regularity. Modelling<br />
results demonstrate a possibility of enormous changes in seasonal runoff on<br />
the eastern part of Estonia. The results below (Figures 1–3) illustrate<br />
geographical differences in the sensitivity of runoff to climate change.<br />
Maximum runoff is more sensitive than minimum runoff.<br />
For the studied rivers, the modelled annual curve of runoff is similar to<br />
baseline. A decrease of modelled runoff in spring and its increase in autumn<br />
is typical to all river basins, especially to the rivers of North-Estonia.<br />
Figures 1–3 demonstrate a variety of runoff responses to climate change in<br />
different landscape regions. Observed curves of monthly runoff for the<br />
baseline period (1961–1990) and modelled curves for the year 2100 are<br />
presented. In addition to the medium climate change scenarios HADMID and<br />
HAMMID, HADMIN as the lowest change scenario and HAMMAX as the<br />
highest one are demonstrated.<br />
Võhandu River basin is located in South-East Estonia in the region of the<br />
most continental climate. There, changes in annual course of runoff will be the<br />
less remarkable (Fig. 1). The runoff maximum in spring will move by a month<br />
earlier, but will not decrease. ECHAM3TR model indicates even an increase<br />
of the maximum.