ANNUAL REPORT 2003 - Fingrid
ANNUAL REPORT 2003 - Fingrid
ANNUAL REPORT 2003 - Fingrid

Create successful ePaper yourself
Turn your PDF publications into a flip-book with our unique Google optimized e-Paper software.
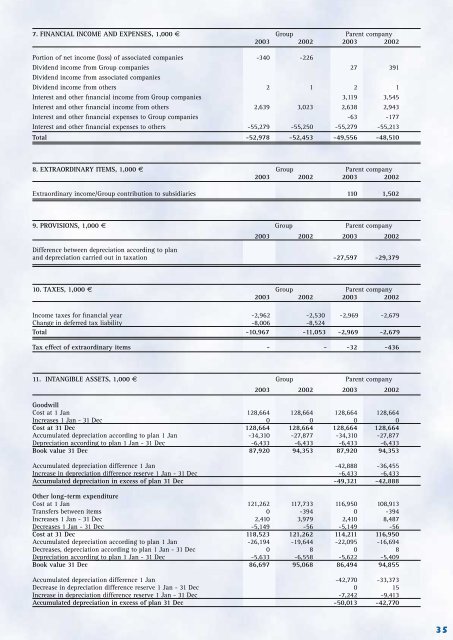
7. FINANCIAL INCOME AND EXPENSES, 1,000 € Group Parent company<br />
<strong>2003</strong> 2002 <strong>2003</strong> 2002<br />
Portion of net income (loss) of associated companies -340 -226<br />
Dividend income from Group companies 27 391<br />
Dividend income from associated companies<br />
Dividend income from others 2 1 2 1<br />
Interest and other financial income from Group companies 3,119 3,545<br />
Interest and other financial income from others 2,639 3,023 2,638 2,943<br />
Interest and other financial expenses to Group companies -63 -177<br />
Interest and other financial expenses to others -55,279 -55,250 -55,279 -55,213<br />
Total -52,978 -52,453 -49,556 -48,510<br />
8. EXTRAORDINARY ITEMS, 1,000 € Group Parent company<br />
<strong>2003</strong> 2002 <strong>2003</strong> 2002<br />
Extraordinary income/Group contribution to subsidiaries 110 1,502<br />
9. PROVISIONS, 1,000 € Group Parent company<br />
<strong>2003</strong> 2002 <strong>2003</strong> 2002<br />
Difference between depreciation according to plan<br />
and depreciation carried out in taxation -27,597 -29,379<br />
10. TAXES, 1,000 € Group Parent company<br />
<strong>2003</strong> 2002 <strong>2003</strong> 2002<br />
Income taxes for financial year -2,962 -2,530 -2,969 -2,679<br />
Change in deferred tax liability -8,006 -8,524<br />
Total -10,967 -11,053 -2,969 -2,679<br />
Tax effect of extraordinary items - - -32 -436<br />
11. INTANGIBLE ASSETS, 1,000 € Group Parent company<br />
<strong>2003</strong> 2002 <strong>2003</strong> 2002<br />
Goodwill<br />
Cost at 1 Jan 128,664 128,664 128,664 128,664<br />
Increases 1 Jan - 31 Dec 0 0 0 0<br />
Cost at 31 Dec 128,664 128,664 128,664 128,664<br />
Accumulated depreciation according to plan 1 Jan -34,310 -27,877 -34,310 -27,877<br />
Depreciation according to plan 1 Jan - 31 Dec -6,433 -6,433 -6,433 -6,433<br />
Book value 31 Dec 87,920 94,353 87,920 94,353<br />
Accumulated depreciation difference 1 Jan -42,888 -36,455<br />
Increase in depreciation difference reserve 1 Jan - 31 Dec -6,433 -6,433<br />
Accumulated depreciation in excess of plan 31 Dec -49,321 -42,888<br />
Other long-term expenditure<br />
Cost at 1 Jan 121,262 117,733 116,950 108,913<br />
Transfers between items 0 -394 0 -394<br />
Increases 1 Jan - 31 Dec 2,410 3,979 2,410 8,487<br />
Decreases 1 Jan - 31 Dec -5,149 -56 -5,149 -56<br />
Cost at 31 Dec 118,523 121,262 114,211 116,950<br />
Accumulated depreciation according to plan 1 Jan -26,194 -19,644 -22,095 -16,694<br />
Decreases, depreciation according to plan 1 Jan - 31 Dec 0 8 0 8<br />
Depreciation according to plan 1 Jan - 31 Dec -5,633 -6,558 -5,622 -5,409<br />
Book value 31 Dec 86,697 95,068 86,494 94,855<br />
Accumulated depreciation difference 1 Jan -42,770 -33,373<br />
Decrease in depreciation difference reserve 1 Jan - 31 Dec 0 15<br />
Increase in depreciation difference reserve 1 Jan - 31 Dec -7,242 -9,413<br />
Accumulated depreciation in excess of plan 31 Dec -50,013 -42,770<br />
35