Addressing the Challenge of Global Ageing—Funding Issues
Addressing the Challenge of Global Ageing—Funding Issues
Addressing the Challenge of Global Ageing—Funding Issues

Create successful ePaper yourself
Turn your PDF publications into a flip-book with our unique Google optimized e-Paper software.
28<br />
<strong>Addressing</strong> <strong>the</strong> <strong>Challenge</strong> <strong>of</strong> <strong>Global</strong> Ageing—Funding <strong>Issues</strong> and Insurance Solutions<br />
and <strong>the</strong>n, more recently, <strong>of</strong> China. 7 The dynamic is now also helping to propel <strong>the</strong> growth<br />
<strong>of</strong> o<strong>the</strong>r emerging markets around <strong>the</strong> world, from Brazil to India and Indonesia.<br />
In some <strong>of</strong> <strong>the</strong> developing world’s most successful economies, however, demographics<br />
are beginning to lean against economic growth. The initial economic impact <strong>of</strong> falling<br />
fertility may be positive, but as societies age <strong>the</strong> relative decline in <strong>the</strong> number <strong>of</strong> children<br />
is eventually overtaken by <strong>the</strong> relative growth in <strong>the</strong> number <strong>of</strong> elderly and dependency<br />
burdens once again rise. The emerging markets <strong>of</strong> East Asia, where fertility has fallen<br />
faster than elsewhere in <strong>the</strong> developing world, are now approaching this tipping point.<br />
All have rapidly ageing populations and all, including China, will have stagnant or<br />
contracting working-age populations within a decade. Demographics will also be leaning<br />
against growth throughout Central and Eastern Europe, whose fertility decline has not<br />
been as precipitous as East Asia’s but began much earlier.<br />
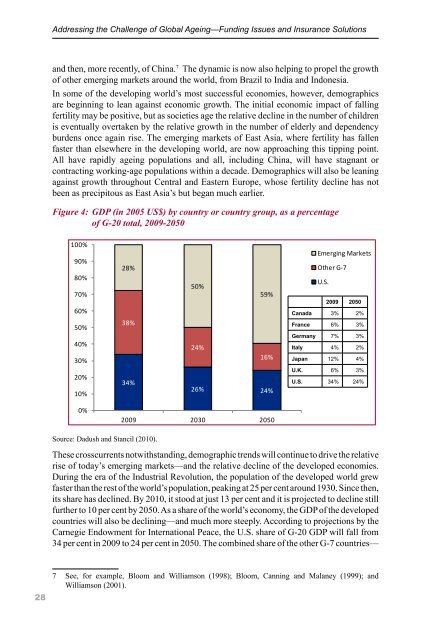
Figure 4: GDP (in 2005 US$) by country or country group, as a percentage<br />
<strong>of</strong> Figure G-20 total, 4: GDP 2009-2050 (in 2005 U.S. Dollars) by Country or Country Group, as<br />
a Percent <strong>of</strong> G-20 Total, 2009-2050<br />
100%<br />
Emerging Markets<br />
90%<br />
28%<br />
O<strong>the</strong>r G-7<br />
80%<br />
U.S.<br />
50%<br />
70%<br />
59%<br />
60%<br />
50%<br />
40%<br />
30%<br />
20%<br />
10%<br />
0%<br />
38%<br />
34%<br />
24%<br />
16%<br />
26% 24%<br />
2009 2030 2050<br />
2009 2050<br />
Canada 3% 2%<br />
France 6% 3%<br />
Germany 7% 3%<br />
Italy 4% 2%<br />
Japan 12% 4%<br />
U.K. 6% 3%<br />
U.S. 34% 24%<br />
Source: Uri Dadush and Bennett Stancil, “The World Order in 2050,” Policy Outlook (Carnegie Endowment<br />
Source: Dadush for International and Stancil Peace, (2010). April 2010).<br />
These crosscurrents notwithstanding, demographic trends will continue to drive <strong>the</strong> relative<br />
rise <strong>of</strong> today’s emerging markets—and <strong>the</strong> relative decline <strong>of</strong> <strong>the</strong> developed economies.<br />
During <strong>the</strong> era <strong>of</strong> <strong>the</strong> Industrial Revolution, <strong>the</strong> population <strong>of</strong> <strong>the</strong> developed world grew<br />
faster than <strong>the</strong> rest <strong>of</strong> <strong>the</strong> world’s population, peaking at 25 per cent around 1930. Since <strong>the</strong>n,<br />
its share has declined. By 2010, it stood at just 13 per cent and it is projected to decline still<br />
fur<strong>the</strong>r to 10 per cent by 2050. As a share <strong>of</strong> <strong>the</strong> world’s economy, <strong>the</strong> GDP <strong>of</strong> <strong>the</strong> developed<br />
countries will also be declining—and much more steeply. According to projections by <strong>the</strong><br />
Carnegie Endowment for International Peace, <strong>the</strong> U.S. share <strong>of</strong> G-20 GDP will fall from<br />
34 per cent in 2009 to 24 per cent in 2050. The combined share <strong>of</strong> <strong>the</strong> o<strong>the</strong>r G-7 countries—<br />
7 See, for example, Bloom and Williamson (1998); Bloom, Canning and Malaney (1999); and<br />
Williamson (2001).