- Page 1 and 2:
The ade4 Package February 16, 2008
- Page 3 and 4:
R topics documented: 3 dudi.acm . .
- Page 5 and 6:
R topics documented: 5 plot.phylog
- Page 7 and 8:
EH 7 EH Amount of Evolutionary Hist
- Page 9 and 10:
RV.rtest 9 RV.rtest Monte-Carlo Tes
- Page 11 and 12:
acacia 11 Format abouheif.eg is a l
- Page 13 and 14:
add.scatter 13 Usage add.scatter(fu
- Page 15 and 16:
ade4toR 15 Arguments fictab ficcoln
- Page 17 and 18:
amova 17 amova Analysis of molecula
- Page 19 and 20:
ardeche 19 ardeche Fauna Table with
- Page 21 and 22:
area.plot 21 Value possub cpoint la
- Page 23 and 24:
arrival 23 # 4 fr.poly
- Page 25 and 26:
atlas 25 par(mfrow = c(1,1)) all(di
- Page 27 and 28:
avijons 27 Examples ## Not run: dat
- Page 29 and 30:
avimedi 29 par(mfcol=c(3,2)) s.valu
- Page 31 and 32:
acteria 31 Details aviurba$mil cont
- Page 33 and 34:
aran95 33 eparlog : "Savings and lo
- Page 35 and 36:
etween 35 par(mfrow = c(1,1)) betwe
- Page 37 and 38:
icenter.wt 37 Format Source A list
- Page 39 and 40:
setal97 39 Format bsetal97 is a lis
- Page 41 and 42:
utterfly 41 Examples data(buech) pa
- Page 43 and 44:
capitales 43 is.euclid(d1) # TRUE p
- Page 45 and 46:
carniherbi49 45 Format Source carni
- Page 47 and 48:
cca 47 Usage data(casitas) Format T
- Page 49 and 50:
chatcat 49 s.match(iv1$ls, iv1$li,
- Page 51 and 52:
chazeb 51 chazeb Charolais-Zebus De
- Page 53 and 54:
cnc2003 53 Usage data(clementines)
- Page 55 and 56:
coinertia 55 coinertia Coinertia An
- Page 57 and 58:
coleo 57 coleo Table of Fuzzy Biolo
- Page 59 and 60:
corvus 59 Examples data(friday87) f
- Page 61 and 62:
disc 61 disc Rao’s dissimilarity
- Page 63 and 64:
discrimin.coa 63 See Also lda in pa
- Page 65 and 66:
dist.dudi 65 5 = Czekanowski (1913)
- Page 67 and 68:
dist.genet 67 Let P the table of ge
- Page 69 and 70:
dist.prop 69 Value returns a distan
- Page 71 and 72:
dist.quant 71 Arguments df method d
- Page 73 and 74:
divcmax 73 divcmax Maximal value of
- Page 75 and 76:
dotchart.phylog 75 Usage dotchart.p
- Page 77 and 78:
doubs 77 doubs Pair of Ecological T
- Page 79 and 80:
dpcoa 79 Value option csize the fun
- Page 81 and 82:
dudi.acm 81 Value as.dudi and all t
- Page 83 and 84:
dudi.coa 83 Examples data(ours) sum
- Page 85 and 86:
dudi.fca 85 Arguments df eff scannf
- Page 87 and 88:
dudi.hillsmith 87 data(bsetal97) w
- Page 89 and 90:
dudi.mix 89 Details If df contains
- Page 91 and 92:
dudi.pca 91 dudi.pca Principal Comp
- Page 93 and 94:
dudi.pco 93 Usage dudi.pco(d, row.w
- Page 95 and 96:
ecg 95 ecg Electrocardiogram data D
- Page 97 and 98:
elec88 97 References See a data des
- Page 99 and 100:
escopage 99 escopage K-tables of wi
- Page 101 and 102:
foucart 101 References Cheverud, J.
- Page 103 and 104:
friday87 103 friday87 Faunistic K-t
- Page 105 and 106:
fuzzygenet 105 fuzzygenet Reading a
- Page 107 and 108:
genet 107 Value Returns an object o
- Page 109 and 110:
genet 109 Value char2genet returns
- Page 111 and 112:
granulo 111 Examples if(require(pix
- Page 113 and 114:
hdpg 113 Examples w
- Page 115 and 116:
humDNAm 115 Usage data(housetasks)
- Page 117 and 118:
inertia.dudi 117 inertia.dudi Stati
- Page 119 and 120:
is.euclid 119 contour is a data fra
- Page 121 and 122:
julliot 121 Format julliot is a lis
- Page 123 and 124:
kcponds 123 Examples data(jv73) s.l
- Page 125 and 126:
kdist 125 Details The attributs of
- Page 127 and 128:
kdisteuclid 127 Value returns a lis
- Page 129 and 130:
kplot 129 kplot Generic Function fo
- Page 131 and 132:
kplot.mfa 131 csub possub a charact
- Page 133 and 134:
kplot.sepan 133 which.graph an opti
- Page 135 and 136:
kplot.statis 135 w
- Page 137 and 138:
ktab 137 Value plot.krandtest draws
- Page 139 and 140:
ktab.data.frame 139 Examples data(f
- Page 141 and 142:
ktab.list.dudi 141 Examples data(jv
- Page 143 and 144:
ktab.within 143 Examples data(meau)
- Page 145 and 146:
lingoes 145 Examples data(lascaux)
- Page 147 and 148:
macaca 147 References Bauwens, D.,
- Page 149 and 150:
mantel.randtest 149 Source Belair,
- Page 151 and 152:
maples 151 Arguments m1 m2 nrepet a
- Page 153 and 154:
mcoa 153 Source Codes for rows and
- Page 155 and 156:
meau 155 Examples data(friday87) w1
- Page 157 and 158:
mfa 157 mfa Multiple Factorial Anal
- Page 159 and 160:
microsatt 159 Format microsatt is a
- Page 161 and 162:
mld 161 Examples data(mjrochet) mjr
- Page 163 and 164:
monde84 163 Format Source mollusc i
- Page 165 and 166:
mstree 165 mstree Minimal Spanning
- Page 167 and 168:
multispati 167 Value Returns an obj
- Page 169 and 170:
multispati.randtest 169 w1.msm
- Page 171 and 172:
neig 171 Author(s) Daniel Chessel S
- Page 173 and 174:
neig 173 #hist(dist, nclass = 50) m
- Page 175 and 176:
newick2phylog 175 References Bauwen
- Page 177 and 178:
niche 177 w[19]
- Page 179 and 180:
njplot 179 Author(s) Daniel Chessel
- Page 181 and 182: optimEH 181 Source Example 357 in:
- Page 183 and 184: originality 183 Details Variables o
- Page 185 and 186: orisaved 185 orisaved Maximal or mi
- Page 187 and 188: orthobasis 187 Value All the functi
- Page 189 and 190: orthogram 189 orthogram Orthonormal
- Page 191 and 192: ours 191 Examples # a phylogenetic
- Page 193 and 194: palm 193 palm Phylogenetic and quan
- Page 195 and 196: pcaiv 195 pcaiv Principal component
- Page 197 and 198: pcaivortho 197 Arguments dudi df sc
- Page 199 and 200: perthi02 199 Author(s) Daniel Chess
- Page 201 and 202: phylog 201 paths droot call Wmat Wd
- Page 203 and 204: plot.phylog 203 f.phylog circle cle
- Page 205 and 206: presid2002 205 ## Not run: # plot a
- Page 207 and 208: procuste 207 Format procella is a l
- Page 209 and 210: procuste.randtest 209 References Di
- Page 211 and 212: pta 211 Arguments df1 df2 nrepet a
- Page 213 and 214: quasieuclid 213 Author(s) Pierre Ba
- Page 215 and 216: andtest-internal 215 References Nee
- Page 217 and 218: andtest.amova 217 Examples par(mfro
- Page 219 and 220: andtest.coinertia 219 randtest.coin
- Page 221 and 222: ankrock 221 # Df Pillai approx F nu
- Page 223 and 224: hone 223 rhone Physico-Chemistry Da
- Page 225 and 226: lq 225 nf RV eig lw cw tab li l1 co
- Page 227 and 228: test 227 Examples ## Not run: data(
- Page 229 and 230: test.discrimin 229 References Romes
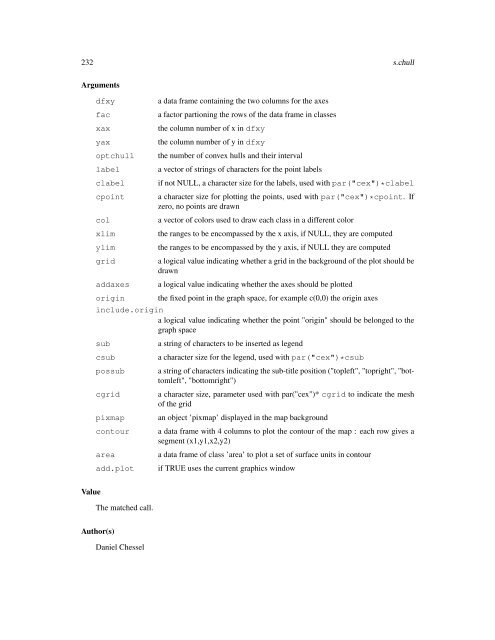
- Page 231: s.chull 231 addaxes cgrid sub csub
- Page 235 and 236: s.corcircle 235 possub = "bottomrig
- Page 237 and 238: s.distri 237 Value clabel cpoint pc
- Page 239 and 240: s.image 239 Examples data(rpjdl) co
- Page 241 and 242: s.kde2d 241 s.image(t3012$xy, scale
- Page 243 and 244: s.label 243 Arguments Value dfxy xa
- Page 245 and 246: s.logo 245 Value xax yax neig cneig
- Page 247 and 248: s.multinom 247 Value cgrid a charac
- Page 249 and 250: s.traject 249 Value Returns in a hi
- Page 251 and 252: s.value 251 Examples rw
- Page 253 and 254: santacatalina 253 par(mfrow = c(3,4
- Page 255 and 256: scalewt 255 scalewt Centring and Sc
- Page 257 and 258: scatter 257 Author(s) See Also Dani
- Page 259 and 260: scatter.dudi 259 Arguments x xax ya
- Page 261 and 262: scatter.fca 261 scatter.fca Plot of
- Page 263 and 264: sco.distri 263 banque.acm
- Page 265 and 266: score 265 Arguments score df fac cl
- Page 267 and 268: score.coa 267 Arguments x xax which
- Page 269 and 270: score.mix 269 par(mfrow = c(1,1)) s
- Page 271 and 272: seconde 271 seconde Students and Su
- Page 273 and 274: skulls 273 skulls Morphometric Evol
- Page 275 and 276: steppe 275 C.T4 TL TC T4 a data fra
- Page 277 and 278: suprow 277 Details If supcol.defaul
- Page 279 and 280: symbols.phylog 279 symbols.phylog R
- Page 281 and 282: table.cont 281 Format Source t3012
- Page 283 and 284:
table.paint 283 Usage table.dist(d,
- Page 285 and 286:
table.value 285 labels.col clabel.c
- Page 287 and 288:
tarentaise 287 Format tarentaise is
- Page 289 and 290:
testdim 289 testdim Function to per
- Page 291 and 292:
tithonia 291 s.label(tintoodiel$xy,
- Page 293 and 294:
toxicity 293 points(ref,xyz[,2], pc
- Page 295 and 296:
triangle.plot 295 show.position a l
- Page 297 and 298:
trichometeo 297 Examples data (euro
- Page 299 and 300:
uniquewt.df 299 Source Data were ob
- Page 301 and 302:
vegtf 301 Value Returns a list cont
- Page 303 and 304:
westafrica 303 Details The columns
- Page 305 and 306:
within 305 afri.ms
- Page 307 and 308:
withinpca 307 withinpca Normed with
- Page 309 and 310:
worksurv 309 References Cazes, P.,
- Page 311 and 312:
zealand 311 Examples data(yanomama)
- Page 313 and 314:
Index ∗Topic array cailliez, 36 d
- Page 315 and 316:
INDEX 315 krandtest, 130 randtest,
- Page 317 and 318:
INDEX 317 bf88, 30 bicenter.wt, 31
- Page 319 and 320:
INDEX 319 plot.procuste (procuste),
- Page 321:
INDEX 321 wavelet.filter, 181 westa


