The Inflation Cycle of 2002 to 2015 - Uhlmann Price Securities
The Inflation Cycle of 2002 to 2015 - Uhlmann Price Securities
The Inflation Cycle of 2002 to 2015 - Uhlmann Price Securities

Create successful ePaper yourself
Turn your PDF publications into a flip-book with our unique Google optimized e-Paper software.
For a printed copy <strong>of</strong> this report, contact your Legg Mason account representative.<br />
Equity Research<br />
Industrial Portfolio Strategy<br />
<strong>The</strong> <strong>Inflation</strong> <strong>Cycle</strong> <strong>of</strong> <strong>2002</strong> <strong>to</strong> <strong>2015</strong><br />
We Began With “Do Commodity-Serving Companies Deserve Your Capital?”<br />
• We believe that inflation versus deflation is underappreciated as a determinant <strong>of</strong> sec<strong>to</strong>r selection success.<br />
• In the past century, s<strong>to</strong>cks and commodities have alternated leadership in regular cycles averaging 18 years.<br />
• During commodity deflation, s<strong>to</strong>cks rose 11.6% per year, but during inflation s<strong>to</strong>cks rose 3.4% per year.<br />
• Although war contributes <strong>to</strong> inflation, s<strong>to</strong>cks <strong>of</strong>ten faltered in the pre-war decade for a variety <strong>of</strong> reasons.<br />
• We see strong developing country (China, FSU, etc.) usage relative <strong>to</strong> supply boosting commodity prices.<br />
• Or, if oil deflates, we see Persian Gulf instability leading <strong>to</strong> major conflict that disrupts oil supply.<br />
• By <strong>2015</strong>, we expect $60/bbl. oil, $4.50/bu. corn, and a 5.8% S&P 500 annual <strong>to</strong>tal return over the period.<br />
• Commodity strength may benefit machinery EPS, while inflation reduces real capital costs.<br />
• This potential widening <strong>of</strong> the EVA ® spread may be a reason for the machinery s<strong>to</strong>cks’ high P/Es.<br />
April 19, <strong>2002</strong><br />
• We upgraded our rating on Caterpillar, Deere and Joy Global shares from Market Performance <strong>to</strong> Buy.<br />
100<br />
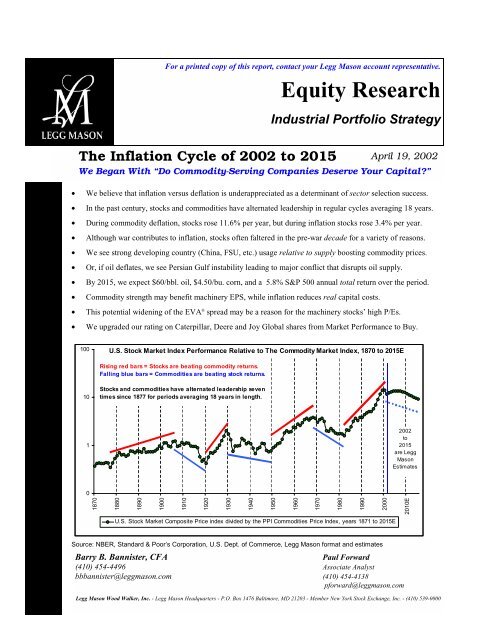
U.S. S<strong>to</strong>ck Market Index Performance Relative <strong>to</strong> <strong>The</strong> Commodity Market Index, 1870 <strong>to</strong> <strong>2015</strong>E<br />
Rising red bars = S<strong>to</strong>cks are beating commodity returns.<br />
Falling blue bars = Commodities are beating s<strong>to</strong>ck returns.<br />
10<br />
S<strong>to</strong>cks and commodities have alternated leadership seven<br />
times since 1877 for periods averaging 18 years in length.<br />
1<br />
<strong>2002</strong><br />
<strong>to</strong><br />
<strong>2015</strong><br />
are Legg<br />
Mason<br />
Estimates<br />
0<br />
1870<br />
1880<br />
1890<br />
1900<br />
1910<br />
1920<br />
1930<br />
1940<br />
1950<br />
1960<br />
1970<br />
1980<br />
1990<br />
2000<br />
U.S. S<strong>to</strong>ck Market Composite <strong>Price</strong> index divided by the PPI Commodities <strong>Price</strong> Index, years 1871 <strong>to</strong> <strong>2015</strong>E<br />
2010E<br />
Source: NBER, Standard & Poor’s Corporation, U.S. Dept. <strong>of</strong> Commerce, Legg Mason format and estimates<br />
Barry B. Bannister, CFA<br />
Paul Forward<br />
(410) 454-4496 Associate Analyst<br />
bbbannister@leggmason.com (410) 454-4138<br />
pforward@leggmason.com<br />
Legg Mason Wood Walker, Inc. - Legg Mason Headquarters - P.O. Box 1476 Baltimore, MD 21203 - Member New York S<strong>to</strong>ck Exchange, Inc. - (410) 539-0000
Industrial Portfolio Strategy<br />
<strong>The</strong> <strong>Inflation</strong> <strong>Cycle</strong> <strong>of</strong> <strong>2002</strong> <strong>to</strong> <strong>2015</strong> ⎯ April 19, <strong>2002</strong> -2- Legg Mason Wood Walker, Inc.<br />
Table <strong>of</strong> Contents<br />
Executive Summary……………………………………………………………………………….……… 5 – 6<br />
Report Conclusion: “His<strong>to</strong>ry Doesn’t Repeat Itself, But It Does Rhyme” – Mark Twain………7 – 25<br />
S<strong>to</strong>ck Rating Changes……………………………..…………………………………………… 8 – 15<br />
<strong>Inflation</strong> As a Trade-Off Between Hard Assets and Financial Assets……………………….. 16 – 23<br />
<strong>The</strong> Structure <strong>of</strong> This Report ..….……………………………………………………………..… 24 – 25<br />
Scenario (1) Continued Deflation, the U.S. Equity Bull Market, and Strong “Tech”<br />
Capital Spending: Probability: 15%……………………………………………………………………26 – 38<br />
Continued Deflation?………………………………………………………………………...… 26<br />
<strong>The</strong> His<strong>to</strong>rical Parallels in Monetary Policy His<strong>to</strong>ry………………...…………………….. 26 – 27<br />
Money Supply Growth and Deteriorating Velocity as Precursors <strong>of</strong> <strong>Inflation</strong> ..…………. 27 – 29<br />
<strong>The</strong> Outlook for Domestic Productivity as An Offset To Loose Monetary Policy……….. 29 – 30<br />
<strong>The</strong> Outlook for Productivity Improvement Overseas That Affects U.S. Competitiveness. 30 – 32<br />
<strong>The</strong> Commodity <strong>Price</strong> Sensitivity <strong>of</strong> the U.S. Economy…………………………………….… 32 – 35<br />
Continuation <strong>of</strong> the Bull Market and Strong “Tech” Spending (?)...………………………… 35 – 37<br />
<strong>The</strong> End <strong>of</strong> the Status Quo?……………...…………………………………………………..… 38<br />
Scenario (2) Rapid Developing Country Modernization And Global Economic Growth Leading<br />
To a Sustained and <strong>Inflation</strong>ary Boom in Commodity Demand: Probability: 60%…….…….39 – 62<br />
Will Surging Demand Create Peacetime Commodity <strong>Inflation</strong>?…….……………………… 39 – 40<br />
<strong>The</strong> Energy <strong>Price</strong> Drivers, 1870 <strong>to</strong> <strong>2015</strong>E………………………...…………….…………… 40 – 43<br />
<strong>The</strong> Demand Side <strong>of</strong> the Oil Equation – <strong>The</strong> 2001 <strong>to</strong> <strong>2015</strong> Environment……. ..………..… 43<br />
<strong>The</strong> China Example – Pushing the Oil Demand Envelope…………………….…………… 43 – 45<br />
<strong>The</strong> Supply Side <strong>of</strong> the Oil Equation – <strong>The</strong> 2001 <strong>to</strong> <strong>2015</strong> Environment.…………………… 45 – 48<br />
Substitute Fuels – Promising, But Enough <strong>to</strong> Make a Difference?…………………………... 49 – 50<br />
U.S. Farm Commodity Export and <strong>Inflation</strong> Prospects, <strong>2002</strong> <strong>to</strong> <strong>2015</strong>E…………………... 51 – 62<br />
U.S. Farm Commodity <strong>Price</strong> <strong>Cycle</strong>s…………………...…………….……………………..… 51 – 53<br />
<strong>The</strong> U.S. Farm Export Outlook………….………………………...…………….…………… 53 – 57<br />
U.S. Agricultural Exports and Deere S<strong>to</strong>ck……………………………….…. ..…………… 57 – 58<br />
<strong>The</strong> Global Competitiveness <strong>of</strong> the U.S. Farm Economy….…………………….…………. 58 – 62<br />
Scenario (3) Middle East War(s) in the Period <strong>2002</strong> <strong>to</strong> <strong>2015</strong> That Result in Extended Oil<br />
Supply Disruptions: Probability: 25%………………………………………………………...… 63 – 81<br />
<strong>The</strong> Risk <strong>of</strong> U.S. Military Action <strong>to</strong> Change the Iraqi Regime That May<br />
Lead <strong>to</strong> a Destabilized Region…………………………………………….………………….. 65 – 66<br />
<strong>The</strong> Risk That Iraq Has or Will Soon Succeed in the Development<br />
<strong>of</strong> Nuclear Weapons………………………………………………...……………….….…….66 – 69<br />
<strong>The</strong> Risk <strong>of</strong> Civil War That Targets Saudi Arabia's Ruling al-Saud Monarchy ..…………..69 – 74<br />
<strong>The</strong> Risk <strong>of</strong> Conventional (Non-Nuclear) War Between States in the Region……………... 74 – 77<br />
<strong>The</strong> Risk <strong>of</strong> Terrorists Obtaining Nuclear Weapons Developed in the Soviet Union……...78
Industrial Portfolio Strategy<br />
<strong>The</strong> <strong>Inflation</strong> <strong>Cycle</strong> <strong>of</strong> <strong>2002</strong> <strong>to</strong> <strong>2015</strong> ⎯ April 19, <strong>2002</strong> -3- Legg Mason Wood Walker, Inc.<br />
Non-Economic Contrasts Between East and West That Affect the Investment Outlook... 79 – 81<br />
Political and Cultural Differences Between East and West………………………………..… 79 – 80<br />
Areas <strong>of</strong> Instability in the Political and Cultural Relations Between East and West………. 80 – 81<br />
<strong>The</strong> Fork in the Road – Inves<strong>to</strong>rs are Along For the Ride………………….…. ..…………. 81<br />
Index <strong>of</strong> Exhibits<br />
Exhibit 1 – <strong>The</strong> S<strong>to</strong>ck Market Versus Machinery and the S<strong>to</strong>ck Market Versus Commodities,<br />
1945 <strong>to</strong> 2001 - Is this a new, secular bull market for machinery?…………..…………………. 8<br />
Exhibit 2 – Machinery Index (CAT+DE+IR+PH) <strong>Price</strong> <strong>Cycle</strong>s, January 1981 <strong>to</strong> Present…...…….…. 9<br />
Exhibit 3 – Machinery Index (CAT+DE+IR+PH) <strong>Price</strong> <strong>Cycle</strong>s, January 1965 <strong>to</strong> April 1981.…….…. 10<br />
Exhibit 4 – CAT Financial His<strong>to</strong>ry and Our Projections <strong>to</strong> 2006, including EVA…….……………….. 11<br />
Exhibit 5 – CAT <strong>Price</strong>-<strong>to</strong>-Sales Multiple Versus EVA, 1970 <strong>to</strong> 2006P…………………....……………. 12<br />
Exhibit 6 – DE s<strong>to</strong>ck Versus U.S. Farm Exports, 1962 <strong>to</strong> <strong>2015</strong>E…………………………….……….….. 13<br />
Exhibit 7 – U.S. Electricity Generation By Fuel Source, 1920-2001, Total and % Share By Fuel.…... 15<br />
Exhibit 8 – Coal <strong>Price</strong>s Versus S<strong>to</strong>ck <strong>Price</strong>s, real (index year 2000) prices, 1901 <strong>to</strong> 2001….………… 15<br />
Exhibit 9 – <strong>Inflation</strong> and Deflation <strong>Cycle</strong>s, 1898 <strong>to</strong> 2001……………………………………….…….…... 16<br />
Exhibit 10 – PPI All Commodities Index Y/Y % Change Compared <strong>to</strong> the PPI Subindices for<br />
Energy, Farm Products and Metals, 1870 <strong>to</strong> 2001…….…………………………………………... 17<br />
Exhibit 11 – Machinery Purchasers XOM, PD, IP and HM Fixed Asset Replacement Rate Versus<br />
Average Remaining Useful Life Of Property, Plant and Equipment, 1950 <strong>to</strong> 2001…..………. 18<br />
Exhibit 12 – PPI for All Commodities Index, 1870 <strong>to</strong> 2001, With Our Forecast <strong>to</strong> <strong>2015</strong>……………... 19<br />
Exhibit 13 – U.S. S<strong>to</strong>ck Market Index, 1870 <strong>to</strong> 2001, With Our Forecast <strong>to</strong> <strong>2015</strong>…………………….. 19<br />
Exhibit 14 – U.S. CPI <strong>Inflation</strong> <strong>Cycle</strong>s, 1880 <strong>to</strong> 2001, With Our <strong>2002</strong> <strong>to</strong> <strong>2015</strong> Estimates………….…. 20<br />
Exhibit 15 – S<strong>to</strong>ck Returns Minus <strong>Inflation</strong>, 1880 <strong>to</strong> 2001, with our <strong>2002</strong> <strong>to</strong> <strong>2015</strong> Estimates………... 21<br />
Exhibit 16 – <strong>The</strong> <strong>Inflation</strong>-Adjusted U.S. S<strong>to</strong>ck Market Index, M2 Money Supply, and U.S. Consumer<br />
<strong>Price</strong> <strong>Inflation</strong>, <strong>The</strong> 1901 and 1933 <strong>Inflation</strong> <strong>Cycle</strong> Turning Points +/- 12 Years……………... 22<br />
Exhibit 16 Cont’d. – <strong>Inflation</strong>-Adjusted U.S. S<strong>to</strong>ck Market Index, M2 Money Supply, and U.S.<br />
Consumer <strong>Inflation</strong>, <strong>The</strong> 1963 and 2001(E) <strong>Inflation</strong> <strong>Cycle</strong> Turning Points +/- 12 Years…….. 23<br />
Exhibit 17 – Return and Growth Table for Commodities, S<strong>to</strong>cks and <strong>Inflation</strong>, <strong>2002</strong> <strong>to</strong> <strong>2015</strong>E……….. 25<br />
Exhibit 18 – M2 Money Supply Vs. Consumer <strong>Inflation</strong>, 10-Year Moving Avg., 1880 <strong>to</strong> 2001……….. 28<br />
Exhibit 19 – M2 Velocity Versus Consumer <strong>Inflation</strong>, 10-Year Moving Average, 1880 <strong>to</strong> 2001………. 28<br />
Exhibit 20 – M2 Velocity Versus CPI <strong>Inflation</strong>, 1960 <strong>to</strong> 2001………………………………………………. 29<br />
Exhibit 21 – U.S. Productivity Growth Versus Demographic Measures: <strong>The</strong> Ratio <strong>of</strong> Experienced Workers<br />
<strong>to</strong> Less Experienced Workers as a Driver For U.S. Productivity Growth………………………. 30<br />
Exhibit 22 – Comparative Demographic Trends That We Believe Shape Productivity, the Ratio <strong>of</strong> 35-49<br />
Year Olds <strong>to</strong> 20-34 Year Olds, China, Japan and the U.S., 1950 <strong>to</strong> 2050E………………...…….. 31<br />
Exhibit 23 – U.S. End-Use Energy as a Percentage <strong>of</strong> GDP……………………………………………..…... 32<br />
Exhibit 24 – U.S. Home Size Versus Energy Costs……………………………………………………………. 33<br />
Exhibit 25 – Long-Term Temperature Trends And Energy <strong>Price</strong> <strong>Inflation</strong>……………………………….... 34<br />
Exhibit 26 – S&P Composite P/E Ratios And <strong>Inflation</strong> Based On the Experience <strong>of</strong> the Period 1927<br />
<strong>to</strong> 2001..…………………………………………………………………………………………………... 35<br />
Exhibit 27 – S&P S<strong>to</strong>ck Market Composite Average Annual P/E, 1927 <strong>to</strong> <strong>2015</strong>(E)……………………... 36<br />
Exhibit 28 – U.S. Financing Gap, 1952 <strong>to</strong> Present……………………………………………………………. 37<br />
Exhibit 29 – <strong>The</strong> Declining Ability Of Debt <strong>to</strong> Underpin U.S. GDP Growth……………………………... 39<br />
Exhibit 30 – Raw Materials Intensity At Different Stages <strong>of</strong> Economic Development………………….. 39
Industrial Portfolio Strategy<br />
<strong>The</strong> <strong>Inflation</strong> <strong>Cycle</strong> <strong>of</strong> <strong>2002</strong> <strong>to</strong> <strong>2015</strong> ⎯ April 19, <strong>2002</strong> -4- Legg Mason Wood Walker, Inc.<br />
Exhibit 31 – PPI Energy <strong>Price</strong> His<strong>to</strong>ry and Supply/Demand Drivers, 1870 <strong>to</strong> <strong>2015</strong>E...………………... 41<br />
Exhibit 32 – Oil Consumption Per Capita Versus Oil Intensity <strong>of</strong> GDP, 62 Nations, As Of Year 2000 42<br />
Exhibit 33 – Oil Consumption Per Capita for Japan, South Korea, and China, 1950-2001……………. 44<br />
Exhibit 34 – U.S. Oil Consumption vs. GDP, 1902 <strong>to</strong> 2001, and for China, 1975 <strong>to</strong> <strong>2015</strong>E…………... 45<br />
Exhibit 35 – World Oil Supply And Demand His<strong>to</strong>ry and Our Projection <strong>to</strong> <strong>2015</strong>……………………... 46<br />
Exhibit 36 – Oil Export-Based Economies as Share <strong>of</strong> World Oil Production, 1965-<strong>2015</strong>E…………… 47<br />
Exhibit 37 – Non-OPEC Reserve-To-Production Ratio, 1952 <strong>to</strong> <strong>2015</strong>E…………………………………... 47<br />
Exhibit 38 – Net Exports and Imports <strong>of</strong> Oil, and Oil <strong>Price</strong>s, 1965-<strong>2015</strong>E..……………………………… 48<br />
Exhibit 39 – Deere S<strong>to</strong>ck Is Driven By Food Exports………………………………………………………. 51<br />
Exhibit 40 – <strong>The</strong> PPI <strong>Price</strong> His<strong>to</strong>ry and Our Estimates For U.S. Agriculture, 1870 <strong>to</strong> <strong>2015</strong>E…………. 52<br />
Exhibit 41 – Deere S<strong>to</strong>ck Is Not Driven By Farm Aid……………………………………………………… 53<br />
Exhibit 42 – Grain Import Hubs Shift Over Time………………………………………………………….. 54<br />
Exhibit 43 – <strong>The</strong> Transition from Old <strong>to</strong> New Grain Markets……………………………………………. 54<br />
Exhibit 44 – U.S. Grain Trade Market Share……………………………………………………………….. 55<br />
Exhibit 45 – Key Drivers In Meat Product Trade…………………………………………………………... 56<br />
Exhibit 46 – Deere S<strong>to</strong>ck Follows Trac<strong>to</strong>r Sales Trends…………………………………………………... 58<br />
Exhibit 47 – U.S. Farm Acres and Farm Commodity Pricing……………………………………………... 58<br />
Exhibit 48 – Food Exports Help Drive Food <strong>Price</strong>s………………………………………………………... 59<br />
Exhibit 49 – Currency Moves Inversely <strong>to</strong> Food Exports………………………………………………….. 59<br />
Exhibit 50 – U.S. Corn Yields, +/(-) 10% From Trend…………………………………………………….. 60<br />
Exhibit 51 – U.S. Corn Yields and Fertilizer Usage………………………………………………………... 60<br />
Exhibit 52 – Deere S<strong>to</strong>ck and Corn <strong>Price</strong>s…………………………………………………………………... 62<br />
Exhibit 53 – Persian Gulf Oil as a Percentage <strong>of</strong> U.S. Consumption, 1970 <strong>to</strong> 2001……………………. 64<br />
Exhibit 54 – Persian Gulf Oil Exports in Real (Year 2000) U.S. Dollars, 1970 <strong>to</strong> <strong>2015</strong>E…………….. 64<br />
Discussion: Iraq’s Potential Approach <strong>to</strong> Nuclear Weapons………………………………………………. 66<br />
Exhibit 55 – Cumulative Effect <strong>of</strong> Oil <strong>Price</strong> Swings on Wealth Transfer, 1970 <strong>to</strong> 2001E……………... 70<br />
Discussion: A Brief His<strong>to</strong>ry <strong>of</strong> Saudi Arabia and the al Saud Royal Family…………………………….. 71<br />
Exhibit 56 – Saudi Arabian GNP Per Capita and Urbanization………………………………………..…... 73<br />
Exhibit 57 – Saudi Arabia Youth Wave, 1974 <strong>to</strong> 2040E……………………………………………….……. 73<br />
Exhibit 58 – Middle East Map………………………………………………………………………………….. 74<br />
Exhibit 59 – <strong>The</strong> Persian Gulf Military Balance in 2001 ………………………………………………….... 75<br />
Exhibit 60 – Military Quality versus Quantity in the Persian Gulf, 2001….………………………….…... 75<br />
Appendix A – U.S. <strong>Inflation</strong> <strong>Cycle</strong>s From a Monetary His<strong>to</strong>ry Perspective, 1898 <strong>to</strong> 2001……….... ….. 82<br />
Appendix B – Caterpillar Inc. Data Used To Build EVA Model, 1970 <strong>to</strong> 2006E………………………... 85
Industrial Portfolio Strategy<br />
<strong>The</strong> <strong>Inflation</strong> <strong>Cycle</strong> <strong>of</strong> <strong>2002</strong> <strong>to</strong> <strong>2015</strong> ⎯ April 19, <strong>2002</strong> -5- Legg Mason Wood Walker, Inc.<br />
Executive Summary<br />
By <strong>2015</strong>, we estimate prices <strong>of</strong> $60 per barrel for oil, $4.50 per bushel for corn, and a 5.8% S&P 500<br />
annual <strong>to</strong>tal return (0.4% after inflation) point-<strong>to</strong>-point from <strong>2002</strong> <strong>to</strong> <strong>2015</strong>. Since a reduction <strong>of</strong> S&P<br />
500 prospective returns lowers the opportunity cost <strong>of</strong> capital for machinery companies, and machinery EPS<br />
are <strong>of</strong>ten enhanced when the commodity producers they serve have pricing power, we upgraded our rating<br />
on the shares <strong>of</strong> Caterpillar Inc. (CAT), Deere and Company (DE) and Joy Global Inc. (JOYG) from<br />
Market Performance <strong>to</strong> Buy. In short, we believe that a secular bull market has begun for commodities<br />
and commodity-serving companies, with the normal peaks and valleys along the way. We are keeping some<br />
powder dry and deferring a Strong Buy rating on the basis <strong>of</strong> current valuation, the seasonality <strong>of</strong> machinery<br />
s<strong>to</strong>ck performance (which <strong>of</strong>ten peaks in May and bot<strong>to</strong>ms in Oc<strong>to</strong>ber), as well as our concern that gradually<br />
but steadily rising inflation, which is the view we describe in this report, ultimately will destabilize the<br />
prevailing market sentiment, which we believe retains a long-duration asset bias. <strong>The</strong> Fed has allowed a<br />
money supply “mountain” <strong>to</strong> build in recent years, and investments that benefit from even modest inflation,<br />
such as machinery s<strong>to</strong>cks, have a small capitalization relative <strong>to</strong> the liquidity that now seeks them. For that<br />
reason, as well as the positive spread between commodity industry-leveraged machinery company EPS and<br />
declining machinery company real capital costs as a result <strong>of</strong> inflation, we would expect machinery valuation<br />
multiples <strong>to</strong> remain high even as EPS recover, rather than compress rapidly as EPS rise, which is the<br />
his<strong>to</strong>rical norm. We believe that the machinery s<strong>to</strong>cks we upgraded would be especially attractive if they<br />
were <strong>to</strong> retrench, all else being equal, but despite their recent price run, CAT and DE s<strong>to</strong>cks are still within<br />
the multiyear trading range that began after the previous earnings peak in 1997 <strong>to</strong> 1998. We expect the<br />
s<strong>to</strong>cks we upgraded <strong>to</strong> lurch out <strong>of</strong> that multiyear trading range sometime in 2003.<br />
For a sense <strong>of</strong> his<strong>to</strong>ry, many commodity producers and the machinery s<strong>to</strong>cks serving them enjoyed a<br />
“secular” bull market from June 1970 <strong>to</strong> April 1981, but the festivities ended with the collapse <strong>of</strong> a commodity<br />
bubble around 1980, just as the Fed moved <strong>to</strong> break inflation, and OPEC overplayed its pricing<br />
hand, causing commodity prices <strong>to</strong> tumble. After a painful economic adjustment in 1980–82, the old inflation<br />
beneficiaries <strong>of</strong> the 1970s attempted a false rally in 1982–83, but quickly yielded price leadership <strong>to</strong><br />
the new “disinflation” plays. S<strong>to</strong>cks received a further boost around 1990 when the U.S.S.R. collapsed in a<br />
heap around the same time the U.S. military defeated Iraq in the Gulf War, creating a decade-long peace<br />
dividend, fiscal policy cover for an “easy money” Fed, and U.S. hegemony in the Persian Gulf that ensured<br />
cheap oil for years <strong>to</strong> come. We believe that the post-Gulf War “New World Order” began <strong>to</strong> unravel<br />
in 2000, signaled by the NASDAQ composite and then the S&P 500 rolling over, and we do not believe<br />
it was a coincidence that commodity prices and machinery s<strong>to</strong>cks beginning <strong>to</strong> rise around the<br />
same time.<br />
Commodity-serving machinery generally underperformed in the 1982 <strong>to</strong> 2000 period we described. But in<br />
his<strong>to</strong>rical terms, a shift from the 1982 <strong>to</strong> 2000 equity bull market <strong>to</strong> a new period <strong>of</strong> stronger commodity<br />
prices and, presumably, machinery s<strong>to</strong>ck performance, is completely normal. S<strong>to</strong>cks and commodities, in<br />
fact, have alternated relative and absolute price leadership in cycles averaging 18 years for over a century.<br />
Since 1870, and excluding dividends, U.S. s<strong>to</strong>ck prices rose 11.6% per year during deflation cycles and<br />
3.4% per year during inflation cycles. Commodity price bubbles tend <strong>to</strong> burst (ca. 1920, 1950, 1980) after<br />
military (or economic) warfare and before equity bull markets, the latter <strong>of</strong> which usually feature declining<br />
commodity input costs that improve business pr<strong>of</strong>it margins, falling inflation that increases the P/E multiple<br />
applied <strong>to</strong> those earnings, and rising debt ratios facilitated by cheaper credit. We do not find those "growth"
Industrial Portfolio Strategy<br />
<strong>The</strong> <strong>Inflation</strong> <strong>Cycle</strong> <strong>of</strong> <strong>2002</strong> <strong>to</strong> <strong>2015</strong> ⎯ April 19, <strong>2002</strong> -6- Legg Mason Wood Walker, Inc.<br />
markets <strong>to</strong> be receptive <strong>to</strong> machinery s<strong>to</strong>ck investing, generally speaking. Alternatively, when s<strong>to</strong>ck price<br />
bubbles begin <strong>to</strong> deflate or burst (ca. 1909, 1929, 1968, 2000), inflation cycles usually follow, largely because<br />
legacy debt must be reduced via some combination <strong>of</strong> inflation, increased export growth, or default,<br />
and the dislocation <strong>of</strong> this transition <strong>of</strong>ten leads <strong>to</strong> an “easy” monetary policy and, unfortunately, <strong>to</strong> military<br />
or economic warfare. <strong>The</strong> U.S. was embroiled in major (lengthy and global) periods <strong>of</strong> hot or economic<br />
warfare for 26% <strong>of</strong> the 20th century. Although war contributed greatly <strong>to</strong> inflation, s<strong>to</strong>cks <strong>of</strong>ten faltered in<br />
the pre-war decade for several reasons, the most common <strong>of</strong> which was excessive money supply growth<br />
relative <strong>to</strong> GDP as the central bankers sought <strong>to</strong> assuage debt problems or fight <strong>of</strong>f wars.<br />
We embarked on our report because we believe that the greatest rewards for inves<strong>to</strong>rs accrue <strong>to</strong> those who<br />
are best positioned for the era's big winners, not the occasional cyclical or product growth s<strong>to</strong>ry. This report<br />
is organized as a probability array <strong>of</strong> expected values, based on what we believe are the three most plausible<br />
<strong>2002</strong> <strong>to</strong> <strong>2015</strong> outcomes that shape the inflation and market returns picture, which, in turn, shapes the machinery<br />
sales outlook, in our view. We use over 100 years <strong>of</strong> his<strong>to</strong>rical precedent (since 1898) as the<br />
“effect,” and our assessment <strong>of</strong> facts and our forecasts as the “cause.” For such a long forecast period, we<br />
would expect some combination <strong>of</strong> these events, so a probability analysis seems the best approach, in our<br />
view. Of course, the scenarios are not mutually exclusive; for example, increased trade could forestall the<br />
risk <strong>of</strong> war. <strong>The</strong> scenarios we analyze are as follows.<br />
Scenario (1) Continued price disinflation/deflation, the Western-dominated status quo, resumption <strong>of</strong><br />
the technology capital expenditure boom, and prolonged strength for U.S. equity index returns<br />
(probability 15%). In the current cycle, we believe that a reliance on short-term debt has developed, and<br />
we also note the unsustainable divergence between rising debt as a percentage <strong>of</strong> U.S. GDP and the falling<br />
nominal GDP growth derived from that debt, which causes us <strong>to</strong> believe that the Fed will not be as aggressive<br />
raising rates this cycle. That is bullish for machinery, in our view, because the Fed's aggressive rate<br />
hikes in the mid-1990s helped cap the recovery in machinery s<strong>to</strong>cks despite generally strong EPS at the<br />
time.<br />
Scenario (2) Rapid developing country modernization and recovering U.S. growth that results in<br />
strong and sustained commodity demand relative <strong>to</strong> more inelastic supply (probability 60%). We analyze<br />
commodity supply and demand cycles since 1870, as well as the intensity <strong>of</strong> commodity use during<br />
those phases in which economies modernize and then mature. We believe that the world is in a transition<br />
from slack <strong>to</strong> generally tight oil supply, the result <strong>of</strong> strong Asian oil demand, recovering Former Soviet<br />
Union internal usage despite rising production, and the absence <strong>of</strong> any new “North Sea-sized” non-OPEC,<br />
price-spoiling, discoveries. Whereas OPEC's ability <strong>to</strong> constrict supply was the “oil weapon” <strong>of</strong> the 1970s,<br />
we believe that the key <strong>to</strong> OPEC's strength in the coming years will be its rising share in filling world demand<br />
for oil.<br />
Scenario (3) Major wars produce high inflation, and even minor wars can interrupt trade, so we devote<br />
a section <strong>of</strong> this report <strong>to</strong> analyzing the potential for major conflict in the Persian Gulf that may<br />
constrict oil supply (probability 25%). New<strong>to</strong>n's Third Law <strong>of</strong> Motion states, "For every action, there is<br />
an equal and opposite reaction.” We believe that the downward force applied <strong>to</strong> the Persian Gulf as a result<br />
<strong>of</strong> oil deflation may lead <strong>to</strong> an upward explosion <strong>of</strong> war, fueled by the unfortunate recruitment <strong>of</strong> increasingly<br />
young, disenfranchised male populations by radical leaders making a bid for power. We analyze the<br />
Persian Gulf risks we see, <strong>to</strong> include those involving Iraq, civil war risk in Saudi Arabia, and other threats.
Industrial Portfolio Strategy<br />
<strong>The</strong> <strong>Inflation</strong> <strong>Cycle</strong> <strong>of</strong> <strong>2002</strong> <strong>to</strong> <strong>2015</strong> ⎯ April 19, <strong>2002</strong> -7- Legg Mason Wood Walker, Inc.<br />
Report Conclusion: “His<strong>to</strong>ry Doesn’t Repeat Itself, But It Does<br />
Rhyme” – Mark Twain<br />
This report began with the question “Do commodity-serving companies, which have generally been<br />
poor investments since the early 1980s, deserve inves<strong>to</strong>rs’ capital in the coming decade?” Commodityserving<br />
companies generally perform best when commodity supply is tight and/or demand is strong, which<br />
generally has not been the case since 1981. <strong>The</strong> chart on the cover <strong>of</strong> this report shows that the U.S. s<strong>to</strong>ck<br />
market and the Producer <strong>Price</strong> Index for commodities have alternated leadership seven times since 1877, in<br />
cycles averaging 18 years, and the hard asset versus financial asset trade-<strong>of</strong>f is clearly driven by inflation.<br />
From 1982 <strong>to</strong> 2000, commodity prices deflated relative <strong>to</strong> the S&P 500, and the commodity-serving industries<br />
generally underperformed in that period.<br />
After deliberating on this subject since the growth s<strong>to</strong>ck bubble burst in 1Q00, we have come <strong>to</strong> the<br />
conclusion that the inflation cycle is currently turning up, and we further conclude that this is generally<br />
bullish for the s<strong>to</strong>cks <strong>of</strong> companies that serve the commodity producers (and, <strong>of</strong> course, the producers themselves).<br />
We believe signs include surging real estate prices, strong money supply growth, oil and gold<br />
strength, increasing geopolitical instability that may lead <strong>to</strong> inflationary warfare, and a potential peaking <strong>of</strong><br />
the trade-weighted U.S. dollar. While deflation benefits companies with high unit growth and negative pricing<br />
(e.g., computers, s<strong>of</strong>tware), inflation benefits companies with operating leverage and pricing power.<br />
Throughout this report we use the term deflation in lieu <strong>of</strong> “disinflation,” but the intent is the same.<br />
We believe a forward-looking approach, if correct, allows inves<strong>to</strong>rs <strong>to</strong> position themselves for outsized<br />
investment returns. Positioning is the key word, because analysts are one- or two-trick ponies ins<strong>of</strong>ar<br />
as they are generally “wedded” (for richer or poorer) <strong>to</strong> one or two narrow industry groups, and even<br />
non-specialist inves<strong>to</strong>rs <strong>of</strong>ten require several years <strong>to</strong> build sec<strong>to</strong>r expertise. Foresight is, <strong>of</strong> course, difficult,<br />
but adversity <strong>of</strong>ten has commensurate reward. For example, in 1970, when Middle East troubles were<br />
brewing (after the 1967 war but before the 1973 war) and OPEC (founded in Iraq in 1960) was little known,<br />
a forecast that called for oil <strong>to</strong> rise tenfold <strong>to</strong> $30 per barrel within a decade would have been outlandish. In<br />
1980, near the height <strong>of</strong> inflation, a prediction <strong>of</strong> double-digit real bond yields in less than a decade would<br />
have seemed absurd. In 1990, when technology s<strong>to</strong>cks were “value” s<strong>to</strong>cks because their earnings were<br />
volatile (sound familiar?), a prediction <strong>of</strong> a greater-than-tenfold increase <strong>to</strong> over 5,000 for the NASDAQ<br />
composite within a decade would have seemed ludicrous. But in each <strong>of</strong> those cases, inves<strong>to</strong>rs able <strong>to</strong> anticipate<br />
the environment were well positioned <strong>to</strong> capitalize on the changes. For the period <strong>2002</strong> <strong>to</strong> <strong>2015</strong>,<br />
we expect a macro-backdrop for our s<strong>to</strong>cks (and the market) with the following features.<br />
<br />
<br />
<br />
<br />
Strong nominal GDP growth, with a large real (ex-inflation) GDP component in the first half <strong>of</strong><br />
the <strong>2002</strong> <strong>to</strong> <strong>2015</strong> period, and a larger inflation component in the second half <strong>of</strong> the period.<br />
Sharply rising GDP leading <strong>to</strong> Fed rate hikes, but the Fed may have little choice but <strong>to</strong> return <strong>to</strong><br />
an accommodative stance due <strong>to</strong> the “hangover” <strong>of</strong> past financial excesses and, potentially, war.<br />
Strong global commodity demand and commodity prices; poor pr<strong>of</strong>its have discouraged commodity<br />
producer investment since around 1981, and Persian Gulf instability may constrict supply.<br />
Commodity price pressure that contributes <strong>to</strong> higher consumer inflation, or, in the case <strong>of</strong> commodity-consuming<br />
industries with excess capacity, cost pressure may compress pr<strong>of</strong>it margins.
Industrial Portfolio Strategy<br />
<strong>The</strong> <strong>Inflation</strong> <strong>Cycle</strong> <strong>of</strong> <strong>2002</strong> <strong>to</strong> <strong>2015</strong> ⎯ April 19, <strong>2002</strong> -8- Legg Mason Wood Walker, Inc.<br />
<br />
<br />
<br />
We expect the PPI All Commodities index <strong>to</strong> outpace the S&P 500 over the <strong>2002</strong> <strong>to</strong> <strong>2015</strong> period;<br />
we see commodity outperformance particularly strong later in the period.<br />
We see single-digit compounded S&P 500 price returns over the <strong>2002</strong> <strong>to</strong> <strong>2015</strong> period, as the focus<br />
shifts from liquidity plus rising P/Es <strong>to</strong> falling P/Es plus EPS growth driving earnings “power.”<br />
<strong>Inflation</strong> could be made significantly worse if increasing geopolitical instability leads <strong>to</strong> wars in<br />
the <strong>2002</strong> <strong>to</strong> <strong>2015</strong> period, possibly in the volatile Middle East where pressures are intense.<br />
S<strong>to</strong>ck Rating Changes<br />
As a result <strong>of</strong> our research and the preparation <strong>of</strong> this report, we have upgraded our rating on Caterpillar<br />
Inc. (CAT – $54.92), Deere & Company (DE – $43.25), and Joy Global (JOYG – $16.25) shares<br />
from Market Performance <strong>to</strong> Buy, since machinery tracks the relative strength <strong>of</strong> commodity prices,<br />
shown in Exhibit 1. Although none <strong>of</strong> the s<strong>to</strong>cks appear inexpensive <strong>to</strong> us on our 2003 estimates, they are<br />
Exhibit 1 – <strong>The</strong> S<strong>to</strong>ck Market Versus Machinery (Black Line) and the S<strong>to</strong>ck Market Versus<br />
Commodities (Green Line), 1945 <strong>to</strong> 2001 - Is this a new, secular bull market for machinery?<br />
3.00<br />
2.50<br />
2.00<br />
Note the red and blue lines <strong>of</strong> alternating s<strong>to</strong>ck<br />
market and commodity price leadership correspond<br />
<strong>to</strong> the cover chart <strong>of</strong> this report.<br />
S&P beats machinery<br />
and<br />
S&P beats commodities<br />
12.00<br />
?<br />
10.00<br />
8.00<br />
6.00<br />
1.50<br />
S&P beats machinery<br />
and<br />
S&P beats commodities<br />
Machinery beats S&P<br />
and<br />
Commodities beat S&P<br />
4.00<br />
1.00<br />
2.00<br />
0.50<br />
0.00<br />
1945<br />
1950<br />
1955<br />
1960<br />
1965<br />
1970<br />
1975<br />
1980<br />
1985<br />
1990<br />
1995<br />
2000<br />
S<strong>to</strong>ck Market Relative <strong>to</strong> Machinery<br />
S<strong>to</strong>ck Market Relative <strong>to</strong> Commodities<br />
Source: U.S. Department <strong>of</strong> Commerce, Standard & Poor’s Corporation
Industrial Portfolio Strategy<br />
<strong>The</strong> <strong>Inflation</strong> <strong>Cycle</strong> <strong>of</strong> <strong>2002</strong> <strong>to</strong> <strong>2015</strong> ⎯ April 19, <strong>2002</strong> -9- Legg Mason Wood Walker, Inc.<br />
moderately attractive because <strong>of</strong> their leverage <strong>to</strong> the environment we expect in the coming years. For example,<br />
Caterpillar is the leading provider <strong>of</strong> engines used in the production and movement <strong>of</strong> hydrocarbons, as<br />
well as the leading provider <strong>of</strong> heavy machinery used <strong>to</strong> extract minerals or build basic infrastructure in<br />
many emerging markets, a number <strong>of</strong> which are commodity producers. Deere & Company is the leading provider<br />
<strong>of</strong> farm machinery in the world, and Joy Global has a leading position in electric shovels and underground<br />
coal mining equipment. Our posture since 2000 with respect <strong>to</strong> CAT and DE has been <strong>to</strong> trade the<br />
s<strong>to</strong>cks within a price range until EPS began <strong>to</strong> recover. Both CAT and DE have performed well since 3Q00,<br />
around the same time the price <strong>of</strong> the S&P 500 began <strong>to</strong> decline, which we do not believe is coincidental<br />
since that is around the same time the secular changes we outline in this report began <strong>to</strong> emerge. We turned<br />
neutral on CAT and DE in December 2001 as a result <strong>of</strong> macroeconomic “balance sheet” concerns that have<br />
since been overshadowed by aggressive (preinflationary?) policy bandages applied <strong>to</strong> the “cash flow” side <strong>of</strong><br />
the economy.<br />
Exhibit 2 – Machinery Index (CAT+DE+IR+PH) <strong>Price</strong> <strong>Cycle</strong>s, January 1981 <strong>to</strong> Present<br />
250.00<br />
200.00<br />
150.00<br />
100.00<br />
50.00<br />
Secular<br />
peak<br />
Apr. 1981<br />
Trading<br />
Range<br />
CAT+DE+IR+PH Combined S<strong>to</strong>ck <strong>Price</strong> Jan-1981 <strong>to</strong> Present<br />
A pull-back is possible,<br />
our view.<br />
"Cyclical"<br />
+150%<br />
July 1984 <strong>to</strong><br />
May 1990<br />
vs. S&P 500 up<br />
140% in the same<br />
period.<br />
Trading<br />
Range<br />
"Cyclical"<br />
+293%<br />
Aug. 1992 <strong>to</strong><br />
Mar. 1998 vs. S&P<br />
500 up 223% in the<br />
same period.<br />
Trading<br />
Range<br />
0.00<br />
1981<br />
1982<br />
1983<br />
1984<br />
1985<br />
1986<br />
1987<br />
1988<br />
1989<br />
1990<br />
1991<br />
1992<br />
1993<br />
1994<br />
1995<br />
1996<br />
1997<br />
1998<br />
1999<br />
2000<br />
2001<br />
<strong>2002</strong><br />
Source: S&P CompuStat, Legg Mason<br />
<strong>The</strong> machinery s<strong>to</strong>cks have enjoyed a considerable rally since they bot<strong>to</strong>med in 3Q00, although the<br />
group has not yet broken out <strong>of</strong> the roughly four-year trading range in which it has been locked. As shown in<br />
Exhibit 2, if there is “only” a post-recession, cyclical recovery in s<strong>to</strong>re for machinery, similar <strong>to</strong> the July<br />
1984 <strong>to</strong> May 1990 period (+150% absolute performance and +10% relative <strong>to</strong> the S&P 500), or perhaps<br />
August 1992 <strong>to</strong> March 1998 (+293% absolute and +70% relative), then we may see a mild pullback before a<br />
multiyear recovery begins. As a result, we are keeping some powder dry and deferring a Strong Buy rating<br />
until we see lower s<strong>to</strong>ck prices or a more sustainable EPS recovery on the horizon, all else being<br />
equal.<br />
Our greater interest, and the subject <strong>of</strong> this report, is a secular, long-term s<strong>to</strong>ry that may be brewing<br />
for commodities. Since such a s<strong>to</strong>ry is tied <strong>to</strong> the inflation outlook, we are mindful that there may be numerous<br />
market dislocations if the inflation mentality changes, and those dislocations may provide lower prices
Industrial Portfolio Strategy<br />
<strong>The</strong> <strong>Inflation</strong> <strong>Cycle</strong> <strong>of</strong> <strong>2002</strong> <strong>to</strong> <strong>2015</strong> ⎯ April 19, <strong>2002</strong> -10- Legg Mason Wood Walker, Inc.<br />
Exhibit 3 – Machinery Index (CAT+DE+IR+PH) <strong>Price</strong> <strong>Cycle</strong>s, January 1965 <strong>to</strong> April 1981<br />
55.00<br />
50.00<br />
45.00<br />
40.00<br />
CAT+DE+IR+PH Combined S<strong>to</strong>ck <strong>Price</strong> Jan-1965 <strong>to</strong> Apr-1981<br />
"Secular"<br />
+221% Machinery<br />
Jun. 1970 <strong>to</strong> Apr. 1981<br />
vs. S&P S<strong>to</strong>ck Composite +83% in<br />
same period.<br />
35.00<br />
30.00<br />
25.00<br />
Trading<br />
Range<br />
20.00<br />
15.00<br />
1965<br />
1966<br />
1967<br />
1968<br />
1969<br />
1970<br />
1971<br />
1972<br />
1973<br />
1974<br />
1975<br />
1976<br />
1977<br />
1978<br />
1979<br />
1980<br />
1981<br />
Source: S&P CompuStat, Legg Mason<br />
for new inves<strong>to</strong>rs in machinery s<strong>to</strong>cks, even though the group may outperform on a relative basis since it<br />
has his<strong>to</strong>rically benefited from commodity inflation. For example, in Exhibit 3 we show the secular bull<br />
market for the machinery s<strong>to</strong>cks in our index during the 1970s, when the group rose 221% from June 1970<br />
<strong>to</strong> April 1981, versus only an 83% increase for the S&P 500. We note in the chart the sharp price decline<br />
for our machinery index after the 1973 <strong>to</strong> 1974 OPEC oil embargo and related recession/bear market, and<br />
the sharp rebound when markets realized that machinery s<strong>to</strong>cks were a beneficiary <strong>of</strong> the inflation that was<br />
created. Potential dislocations may include falling bond prices if <strong>2002</strong> GDP growth is sharply higher, some<br />
Fed rate hikes, commodity and CPI inflation pressure, Middle East political instability, and overseas economic<br />
woes. In addition, as an element <strong>of</strong> caution, machinery s<strong>to</strong>cks are seasonal, <strong>of</strong>ten peaking in May and<br />
bot<strong>to</strong>ming in Oc<strong>to</strong>ber, per our research, so we are cautious in a seasonal sense. Lastly, Exhibit 3 shows<br />
that machinery s<strong>to</strong>cks in bullish cycles do have price dips along the way, so we are patient. But we believe<br />
that a longer-term horizon justifies a Buy rating, however, and if there is a pullback in the interim, it may<br />
warrant a Strong Buy rating for CAT, DE or JOYG s<strong>to</strong>ck, all else being equal.<br />
Caterpillar’s vertical integration makes it the quintessential operating leverage play in machinery, in<br />
our view. Our approach <strong>to</strong> CAT and all machinery s<strong>to</strong>cks is <strong>to</strong> separate the “P” from the “E” in the P/E ratio.<br />
In Exhibit 4, we provide a long-term analysis <strong>of</strong> CAT in terms <strong>of</strong> sales, pr<strong>of</strong>it margins, EPS and, most<br />
importantly in our view, Economic Value Added (EVA ® ), which is the excess <strong>of</strong> return on capital over the<br />
cost <strong>of</strong> capital employed. (Supporting data for these charts are contained in Appendix B.) Starting from the<br />
<strong>to</strong>p left, we forecast that by 2006, CAT’s consolidated sales and revenue growth should climb <strong>to</strong> the<br />
his<strong>to</strong>rical average. In the <strong>to</strong>p right chart, our view is that CAT’s net pr<strong>of</strong>it margin as a percent <strong>of</strong> sales and<br />
revenues should benefit from cost reduction and recovering commodity markets, with a potentially weaker
Industrial Portfolio Strategy<br />
<strong>The</strong> <strong>Inflation</strong> <strong>Cycle</strong> <strong>of</strong> <strong>2002</strong> <strong>to</strong> <strong>2015</strong> ⎯ April 19, <strong>2002</strong> -11- Legg Mason Wood Walker, Inc.<br />
Exhibit 4 – CAT Financial His<strong>to</strong>ry and Our Projections <strong>to</strong> 2006, including EVA<br />
25.0%<br />
21.0%<br />
17.0%<br />
13.0%<br />
9.0%<br />
5.0%<br />
1.0%<br />
-3.0%<br />
-7.0%<br />
-11.0%<br />
-15.0%<br />
CAT Sales & Revenue, 3-Year Growth, 1950-2006E<br />
We estimate<br />
moderate sales<br />
growth <strong>to</strong> 2006.<br />
50<br />
52<br />
54<br />
56<br />
58<br />
60<br />
62<br />
64<br />
66<br />
68<br />
70<br />
72<br />
74<br />
76<br />
78<br />
80<br />
82<br />
84<br />
86<br />
88<br />
90<br />
92<br />
94<br />
96<br />
98<br />
00<br />
02E<br />
04E<br />
06E<br />
CAT Sales and Revenues, 3-Year Moving Average Growth Rate<br />
LM<br />
Ests.<br />
13.0%<br />
11.0%<br />
9.0%<br />
7.0%<br />
5.0%<br />
3.0%<br />
1.0%<br />
-1.0%<br />
-3.0%<br />
-5.0%<br />
-7.0%<br />
CAT Consolidated Net Pr<strong>of</strong>it Margin, 1950 <strong>to</strong> 2006E<br />
We estimate net margin<br />
<strong>to</strong> recover substantially<br />
by 2006.<br />
50<br />
52<br />
54<br />
56<br />
58<br />
60<br />
62<br />
64<br />
66<br />
68<br />
70<br />
72<br />
74<br />
76<br />
78<br />
80<br />
82<br />
84<br />
86<br />
88<br />
90<br />
92<br />
94<br />
96<br />
98<br />
00<br />
02E<br />
04E<br />
06E<br />
CAT Consolidated Net Pr<strong>of</strong>it Percent <strong>of</strong> Sales and Revenues<br />
LM<br />
Ests.<br />
$10.00<br />
$1.00<br />
$0.10<br />
CAT EPS (Excl. Loss Years), 1963 <strong>to</strong> 2006E<br />
We expect EPS <strong>to</strong><br />
recover on a log scale<br />
<strong>to</strong> a <strong>to</strong>p-<strong>of</strong>-trend level<br />
by 2006.<br />
L<br />
O<br />
S<br />
S<br />
E<br />
S<br />
63<br />
65<br />
67<br />
69<br />
71<br />
73<br />
75<br />
77<br />
79<br />
81<br />
83<br />
85<br />
87<br />
89<br />
91<br />
93<br />
95<br />
97<br />
99<br />
01<br />
03E<br />
05E<br />
L<br />
O<br />
S<br />
S<br />
E<br />
S<br />
LM<br />
Ests.<br />
NOPAT ROIC Minus WACC<br />
12.00%<br />
10.00%<br />
8.00%<br />
6.00%<br />
4.00%<br />
2.00%<br />
0.00%<br />
(2.00%)<br />
(4.00%)<br />
(6.00%)<br />
(8.00%)<br />
(10.00%)<br />
(12.00%)<br />
(14.00%)<br />
(16.00%)<br />
(18.00%)<br />
Caterpillar EVA (%) Each Year, 1970 <strong>to</strong> 2001 Actual<br />
With Our <strong>2002</strong> <strong>to</strong> 2006 Estimates and Projections<br />
EVA finally recovers significantly<br />
through 2006 in our model.<br />
1970<br />
1972<br />
1974<br />
1976<br />
1978<br />
1980<br />
1982<br />
1984<br />
1986<br />
1988<br />
1990<br />
1992<br />
1994<br />
1996<br />
1998<br />
2000<br />
<strong>2002</strong>E<br />
2004E<br />
2006E<br />
Caterpillar EPS (Log Scale, Excludes Loss Years)<br />
(20.00%)<br />
Source: Company reports, Moody’s Industrial Manuals, Standard and Poor’s Corporation, Legg Mason estimates. EVA is a registered<br />
U.S. dollar as well. As a result, by 2006, we foresee a 9.6% net pr<strong>of</strong>it margin, eclipsing the 8.8% peak<br />
achieved in 1997, thus rivaling the best <strong>of</strong> the post-World War II years, since CAT is significantly more<br />
lean and well managed after 20 years <strong>of</strong> surviving hardship, in our view. Multiplying the results from the<br />
preceding charts, and dividing by shares outstanding, in the bot<strong>to</strong>m left chart we show CAT’s EPS tracking<br />
<strong>to</strong> a potential “cyclical peak” level <strong>of</strong> about $8.00 by 2006. In the bot<strong>to</strong>m right chart, we show the net<br />
operating pr<strong>of</strong>it after taxes (NOPAT) return on invested capital (ROIC) comfortably rising above the<br />
weighted average cost <strong>of</strong> capital (WACC), generating positive EVA in the <strong>2002</strong> <strong>to</strong> 2006 period.<br />
<strong>The</strong>re is a clear relationship between CAT’s s<strong>to</strong>ck price as a multiple <strong>of</strong> consolidated sales and<br />
revenues per share (i.e., P/S) and CAT’s EVA, shown in Exhibit 5. By analyzing the period 1970 <strong>to</strong><br />
2006E in our chart, we capture most <strong>of</strong> one entire inflation cycle (the 1970s), one deflation cycle (1980s<br />
and 1990s), and the beginnings <strong>of</strong> what we view <strong>to</strong> be another moderate inflation cycle (the first five years
Industrial Portfolio Strategy<br />
<strong>The</strong> <strong>Inflation</strong> <strong>Cycle</strong> <strong>of</strong> <strong>2002</strong> <strong>to</strong> <strong>2015</strong> ⎯ April 19, <strong>2002</strong> -12- Legg Mason Wood Walker, Inc.<br />
Exhibit 5 – CAT <strong>Price</strong>-<strong>to</strong>-Sales Multiple Versus EVA, 1970 <strong>to</strong> 2006E<br />
1.30<br />
CAT <strong>Price</strong>/Sales vs. Annual EVA , 1970 <strong>to</strong> 2006P<br />
(1997 (Prior EPS Peak) = Black Circle; 2000 (Cyclical Trough <strong>Price</strong>) = Blue Triangle; Current <strong>Price</strong>/Sales Multiple on<br />
2003E = Red Circle, Current <strong>Price</strong>/Sales on 2006P Potential Cyclical Peak = Green Square)<br />
<strong>Price</strong> / Sales Multiple<br />
1.20<br />
1.10<br />
1.00<br />
0.90<br />
0.80<br />
0.70<br />
0.60<br />
0.50<br />
0.40<br />
0.30<br />
0.20<br />
0.10<br />
CAT's price/sales multiple versus<br />
EVA guides our full-cycle trading<br />
range expectations.<br />
0.00<br />
(18.00%) (15.00%) (12.00%) (9.00%) (6.00%) (3.00%) 0.00% 3.00% 6.00% 9.00% 12.00%<br />
Caterpillar Annual EVA % (NOPAT ROIC minus WACC)<br />
2003E<br />
2000<br />
1997<br />
2006P<br />
Source: Moody’s Industrial Manual, Company reports, Legg Mason <strong>2002</strong> <strong>to</strong> 2006 estimates<br />
<strong>of</strong> 2001 <strong>to</strong> <strong>2015</strong>). Of course, part <strong>of</strong> Caterpillar’s improvement in EVA since the absolute trough in 1984 is<br />
that CAT has developed a large finance company, which tends <strong>to</strong> lower the WACC but increase debt leverage.<br />
Largely for that reason, Caterpillar’s consolidated debt divided by the market value <strong>of</strong> equity rose from<br />
48% in 1984 <strong>to</strong> 97% in 2001. At CAT’s prior cyclical peak EPS ($4.37) in 1997, the company’s EVA was<br />
584 basis points, and the P/S multiple was 0.97x, shown in Exhibit 5 as a black circle. By 2000, at what we<br />
believe <strong>to</strong> be the cyclical trough for CAT’s average annual s<strong>to</strong>ck price ($37.90), CAT inves<strong>to</strong>rs were<br />
positioned for only about 100 basis points, on average, <strong>of</strong> EVA in the subsequent two years, and the P/S in<br />
2000 was only 0.65x, shown by a blue triangle. Currently, CAT s<strong>to</strong>ck trades at a P/S <strong>of</strong> 0.89x our 2003<br />
expectation for sales and revenues per share, with an EVA <strong>of</strong> 100 basis points, shown by a red circle. In<br />
our view, CAT’s 2003 P/S multiple is a bit rich, but does not negate the likelihood <strong>of</strong> positive absolute<br />
returns if one sees CAT nearing cyclical peak EPS in the year 2006. If CAT’s results track as we expect<br />
<strong>to</strong> 2006, then the EPS <strong>of</strong> $8.00 and consolidated sales and revenues <strong>of</strong> $28.9 billion in that year produce a<br />
current P/S multiple (using the current price divided by sales and revenues per share in 2006E) <strong>of</strong> 0.66x,<br />
and an EVA <strong>of</strong> 552 basis points that year.<br />
<strong>The</strong> purchase decision with respect <strong>to</strong> CAT s<strong>to</strong>ck is, <strong>of</strong> course, tied <strong>to</strong> what sort <strong>of</strong> return expectations<br />
satisfy the buyer <strong>of</strong> the shares. We believe CAT s<strong>to</strong>ck could earn a P/S multiple <strong>of</strong> 1.00x in 2006, a<br />
premium <strong>to</strong> the regression line in Exhibit 5, as a result <strong>of</strong> then-expected cyclical optimism, equating <strong>to</strong> a<br />
price <strong>of</strong> $83 in our model ($28.9 billion 2006E sales and revenues divided by 348.5 million shares). This<br />
price is also a P/E just over 10x our “peak” projected level <strong>of</strong> $8.00. From the current price <strong>of</strong><br />
approximately $54.92, that is a price return potential <strong>of</strong> about 11% and a <strong>to</strong>tal return potential <strong>of</strong> 13%<br />
including dividends on an annual basis. We prefer a 20% annual <strong>to</strong>tal return for a Strong Buy rating, which<br />
equates <strong>to</strong> a price <strong>of</strong> $43 for CAT s<strong>to</strong>ck now, all else being equal. Returns are <strong>of</strong>ten relative, however, and
Industrial Portfolio Strategy<br />
<strong>The</strong> <strong>Inflation</strong> <strong>Cycle</strong> <strong>of</strong> <strong>2002</strong> <strong>to</strong> <strong>2015</strong> ⎯ April 19, <strong>2002</strong> -13- Legg Mason Wood Walker, Inc.<br />
our previous WACC calculations contained a S&P 500 “opportunity cost” price return projection. For the<br />
period <strong>of</strong> this writing <strong>to</strong> 2006, we forecast an annual <strong>to</strong>tal return for the S&P 500 <strong>of</strong> approximately 8.0%<br />
(2.1% dividend reinvested, 5.9% price). CAT s<strong>to</strong>ck appears <strong>to</strong> <strong>of</strong>fer a superior relative <strong>to</strong>tal return <strong>of</strong> over<br />
300 basis points, warranting a Buy rating, in our view. In addition <strong>to</strong> the normal retinue <strong>of</strong> cyclical<br />
economic indica<strong>to</strong>rs in recovery mode, as a nonstandard indica<strong>to</strong>r we also cite the recent strength <strong>of</strong> gold.<br />
Recall that in February 1993 gold prices began <strong>to</strong> rise sharply, and CAT s<strong>to</strong>ck also continued a strong,<br />
cyclical recovery in that year. Later in this report we outline a view that the Greespan Fed depends upon the<br />
U.S. consumer <strong>to</strong> sustain the economic recovery, and since the consumer appears <strong>to</strong> require low interest<br />
rates <strong>to</strong> avoid a painful and abrupt decline in consumer activity, we doubt the Fed will pursue an<br />
aggressive rate policy in <strong>2002</strong>–2003 as it did in the earlier, mid-1990s cyclical economic recovery.<br />
Deere s<strong>to</strong>ck is the quintessential farm economy “macro-play,” in our view. Despite diversification efforts<br />
that <strong>of</strong>ten have proven fruitless, Deere, fortunately, has enhanced its leadership position in farm machinery.<br />
In Exhibit 6, we show that DE s<strong>to</strong>ck tracks U.S. agricultural exports, the latter being driven by a<br />
complex mix <strong>of</strong> global GDP, dietary enrichment, foreign exchange, hydrocarbon input costs, weather, free<br />
trade practices, interest rates, and government payments <strong>to</strong> farmers. But a 20-year period <strong>of</strong> hardship has a<br />
way <strong>of</strong> warping the mindset <strong>of</strong> an industry, and we believe most analyses <strong>of</strong> agriculture are not sufficiently<br />
Exhibit 6 – DE s<strong>to</strong>ck Versus U.S. Farm Exports, 1962 <strong>to</strong> <strong>2015</strong>E<br />
Real U.S. Agricultural Exports ($ Mil.)<br />
$110,000<br />
$100,000<br />
$90,000<br />
$80,000<br />
$70,000<br />
$60,000<br />
$50,000<br />
$40,000<br />
$30,000<br />
$20,000<br />
Deere Performance Tracks U.S. Food Exports<br />
Real Export<br />
CAGR 1962 <strong>to</strong><br />
1996 =<br />
2.7%/year<br />
Machinery industry and farmer over-capacity<br />
plagued pr<strong>of</strong>its, but consolidation resulted.<br />
1962<br />
1964<br />
1966<br />
1968<br />
1970<br />
1972<br />
1974<br />
1976<br />
1978<br />
1980<br />
1982<br />
1984<br />
1986<br />
1988<br />
1990<br />
1992<br />
1994<br />
1996<br />
1998<br />
2000<br />
<strong>2002</strong>E<br />
2004E<br />
LM<br />
Ests.<br />
Real Export<br />
CAGR 1996 <strong>to</strong><br />
<strong>2015</strong>E =<br />
2.4%/year<br />
2006E<br />
2008E<br />
2010E<br />
2012E<br />
2014E<br />
14.0%<br />
12.0%<br />
10.0%<br />
8.0%<br />
6.0%<br />
4.0%<br />
2.0%<br />
Deere Relative <strong>to</strong> the S&P 500<br />
Real U.S. Farm Product Exports, U.S. $ Mil. (Left)<br />
Deere S<strong>to</strong>ck Relative <strong>to</strong> the S&P Composite (Right)<br />
Source: USDA, S&P Compustat, Legg Mason <strong>2002</strong> <strong>to</strong> <strong>2015</strong> estimates
Industrial Portfolio Strategy<br />
<strong>The</strong> <strong>Inflation</strong> <strong>Cycle</strong> <strong>of</strong> <strong>2002</strong> <strong>to</strong> <strong>2015</strong> ⎯ April 19, <strong>2002</strong> -14- Legg Mason Wood Walker, Inc.<br />
open <strong>to</strong> the improving conditions. <strong>The</strong> actual trend for real U.S. agricultural exports was 2.7% growth (PPI<br />
index year 2000) from 1962 <strong>to</strong> 1996, and we see real growth <strong>of</strong> only 2.4% from 1996 <strong>to</strong> <strong>2015</strong>E, or from<br />
$64.3 billion <strong>of</strong> real U.S. agricultural exports in 1996 ($52.3 billion in current, 2001 dollars) <strong>to</strong> $100 billion<br />
in <strong>2015</strong>. U.S. agricultural exports have been volatile, with inflation-adjusted U.S. agricultural exports rising<br />
from $27 billion in 1969 <strong>to</strong> a peak <strong>of</strong> $67.2 billion in 1980, but then plunging <strong>to</strong> $32.4 billion in 1986. Exports<br />
then climbed <strong>to</strong> a peak <strong>of</strong> $64.3 billion in 1996, on the strength <strong>of</strong> developing country demand and<br />
weather-related supply disruptions, but fell <strong>to</strong> $50.8 billion in 2000 before beginning a gradual recovery.<br />
Generally speaking, we see higher commodity prices, a weaker U.S. dollar, and improved emerging<br />
market economies, all <strong>of</strong> which support export prospects for U.S. farmers, in our view. <strong>The</strong> diminution<br />
<strong>of</strong> European Union (EU) and Former Soviet Union (FSU) grain and meat import markets, which had been<br />
the “s<strong>to</strong>ry” <strong>of</strong> the 1970s and 1980s but burst in the 1990s, is key. While the EU and FSU have contracted,<br />
the “new” markets in the Atlantic, Pacific and Middle East have continued <strong>to</strong> expand, which we believe is<br />
key <strong>to</strong> U.S. export prospects. A weaker U.S. dollar cycle also would assist U.S. farm exports, since U.S. agricultural<br />
exports fell 14.1% from 1995 <strong>to</strong> 2000, as the U.S. farm trade-weighted dollar rose 18.9% in that<br />
period. Since the U.S. farmer competes with currencies that may appreciate along with commodity prices (e.<br />
g., those <strong>of</strong> Canada, Australia, and the FSU), as well as against the low-priced European euro, the stage may<br />
be set for stronger U.S. agricultural exports in the coming decade. <strong>The</strong> U.S. Department <strong>of</strong> Agriculture<br />
(USDA) estimates agricultural exports <strong>of</strong> $54.5 billion in <strong>2002</strong>, up 10.8% from the trough <strong>of</strong> $49.2 billion<br />
in 1998, which we see as the beginning <strong>of</strong> a long-term recovery for various reasons outlined later in this report.<br />
As a result, we expect DE s<strong>to</strong>ck <strong>to</strong> outperform the S&P 500 more frequently in the period from <strong>2002</strong><br />
<strong>to</strong> <strong>2015</strong>.<br />
Although conditions have been less rosy for Deere in terms <strong>of</strong> U.S. agricultural trade since 1981, a favorable<br />
side effect has been farm machinery industry capacity rationalization. As <strong>to</strong>tal U.S. row crop<br />
trac<strong>to</strong>r plus combine harvester unit sales fell from 94,700 units in 1979 <strong>to</strong> 23,482 units in 2001, the farm<br />
machinery industry consolidated <strong>to</strong> a handful <strong>of</strong> global players. Also, the number <strong>of</strong> U.S. farms fell 10.9%<br />
from 1979 <strong>to</strong> 2001, and U.S. planted acreage fell 7.9%. Were it not for farm subsidies, capacity would have<br />
been reduced further, but we note that Deere targets larger, more pr<strong>of</strong>itable farms that tend <strong>to</strong> purchase and<br />
turn over equipment fleets more frequently. We discuss the farm outlook in greater detail later in this report.<br />
We view Joy Global (JOYG) as the quintessential coal play; seeking <strong>to</strong> participate in those cycles, we<br />
upgraded our rating on JOYG s<strong>to</strong>ck from Market Performance <strong>to</strong> Buy. We view JOYG s<strong>to</strong>ck as a<br />
prime beneficiary <strong>of</strong> the recovery <strong>of</strong> the worldwide coal, copper, and steel (via iron ore) prices, as well as<br />
the recent strength in gold mining, since the company is a dominant niche producer <strong>of</strong> electric shovels and<br />
underground coal mining machines. Having emerged from bankruptcy on July 12, 2001, with greatly reduced<br />
debt, Joy Global (formerly known as Harnischfeger Inc.) has been buffeted by an unusually warm<br />
winter that depressed electric utility output, and thus coal mining, since approximately 90% <strong>of</strong> U.S. coal is<br />
used <strong>to</strong> provide electricity, and utilities have accumulated coal inven<strong>to</strong>ry left over from the mild winter. We<br />
note, however, that coal inven<strong>to</strong>ry at electricity producers as a percentage <strong>of</strong> trailing 5-year average annual<br />
usage was 13.9% in 2001, versus 11.1% in 2000, but still below the 10-year average <strong>of</strong> 14.6%. In addition,<br />
electricity utility industrial production has begun <strong>to</strong> recover from the recession. Weak housing, au<strong>to</strong> and<br />
electronics markets also have depressed the copper and steel (iron ore) markets <strong>to</strong> which Joy Global sells,<br />
but those markets appear <strong>to</strong> be resilient and, as we said, we do not wish <strong>to</strong> fight the Fed anymore with respect<br />
<strong>to</strong> those early cycle groups, at least for the time being. Given that Joy’s wagon is tied <strong>to</strong> coal, in Exhibit<br />
7 we show that coal has provided 52% <strong>of</strong> growing U.S. electric power for the past 80 years with an an-
Industrial Portfolio Strategy<br />
<strong>The</strong> <strong>Inflation</strong> <strong>Cycle</strong> <strong>of</strong> <strong>2002</strong> <strong>to</strong> <strong>2015</strong> ⎯ April 19, <strong>2002</strong> -15- Legg Mason Wood Walker, Inc.<br />
nual standard deviation <strong>of</strong> only 3%, and coal’s<br />
outlook as a domestic, thermally efficient, increasingly<br />
clean source <strong>of</strong> power remains solid,<br />
in our view.<br />
Exhibit 7 – U.S. Electricity Generation By Fuel<br />
Source, 1920-2001, Total and % Share By Fuel<br />
100%<br />
Other<br />
Joy Global has more “low-hanging fruit” costreduction<br />
potential than most machinery makers,<br />
in our opinion, such as inven<strong>to</strong>ry turns <strong>of</strong> only<br />
1.9x (FIFO basis), the improvement <strong>of</strong> which could<br />
reduce Joy Global’s modest 30% net debt <strong>to</strong> capital.<br />
Whether management will improve the company<br />
is difficult <strong>to</strong> say, but the cycle is our main<br />
interest, and the cycle is largely beyond management’s<br />
control, in our opinion. In Exhibit 8, we<br />
show that the inflation-adjusted price <strong>of</strong> coal and<br />
the U.S. s<strong>to</strong>ck market move in opposite directions,<br />
and appear <strong>to</strong> be converging yet again. For more<br />
information on JOYG s<strong>to</strong>ck, we refer inves<strong>to</strong>rs <strong>to</strong><br />
our basic report on the company dated September<br />
10, 2001.<br />
90%<br />
80%<br />
70%<br />
60%<br />
50%<br />
40%<br />
30%<br />
20%<br />
10%<br />
0%<br />
1920<br />
1925<br />
1930<br />
1935<br />
1940<br />
1945<br />
1950<br />
Hydroelectric<br />
Gas<br />
Coal<br />
1955<br />
1960<br />
Petroleum<br />
Nuclear<br />
1965<br />
1970<br />
1975<br />
1980<br />
1985<br />
1990<br />
1995<br />
2000<br />
Source: Bureau <strong>of</strong> Labor Statistics;.EIA; U.S. Census Bureau, His<strong>to</strong>rical<br />
Statistics <strong>of</strong> the United States, Colonial Times <strong>to</strong> 1970<br />
Exhibit 8 – Coal <strong>Price</strong>s Versus S<strong>to</strong>ck <strong>Price</strong>s, real (index year 2000) prices, 1901 <strong>to</strong> 2001.<br />
$100.00<br />
Good for coal = bad for s<strong>to</strong>ck prices:<br />
<strong>The</strong>re is a 100 year precedent showing an inverse<br />
relationship between coal prices and the S&P<br />
S<strong>to</strong>ck Market Composite price.<br />
10,000<br />
1,000<br />
Average<br />
2001 coal<br />
spot price<br />
100<br />
$10.00<br />
10<br />
1901<br />
1905<br />
1909<br />
1913<br />
1917<br />
1921<br />
1925<br />
1929<br />
1933<br />
1937<br />
1941<br />
1945<br />
1949<br />
1953<br />
1957<br />
1961<br />
1965<br />
1969<br />
1973<br />
1977<br />
1981<br />
1985<br />
1989<br />
1993<br />
1997<br />
2001<br />
Bituminous Coal FOB Mine, $ per Short Ton, Real (year 2000) <strong>Price</strong>s, Left<br />
S&P S<strong>to</strong>ck Market Composite, Real (year 2000) <strong>Price</strong>s, Right<br />
Source: EIA; U.S. Census Bureau, His<strong>to</strong>rical Statistics <strong>of</strong> the United States, Colonial Times <strong>to</strong> 1970
Industrial Portfolio Strategy<br />
<strong>The</strong> <strong>Inflation</strong> <strong>Cycle</strong> <strong>of</strong> <strong>2002</strong> <strong>to</strong> <strong>2015</strong> ⎯ April 19, <strong>2002</strong> -16- Legg Mason Wood Walker, Inc.<br />
<strong>Inflation</strong> As a Trade-Off Between Hard Assets and Financial Assets<br />
Until now, we have discussed our conclusions, but now it is time <strong>to</strong> discuss the reasoning behind those<br />
conclusions. Exhibit 9 shows the three U.S. commodity inflation (pre-war and wartime) and deflation periods<br />
<strong>of</strong> the 20th century. We note the following cyclical characteristics and similarities.<br />
<br />
<strong>The</strong> commodity inflation periods averaged 19 years in length, but have grown shorter, and regardless <strong>of</strong><br />
whether the pre-war or war years are examined, the entire period featured generally high money supply<br />
(M2) growth, moderately high or high inflation, and uniformly low s<strong>to</strong>ck market returns.<br />
Exhibit 9 – <strong>Inflation</strong> and Deflation <strong>Cycle</strong>s, 1898 <strong>to</strong> 2001<br />
<strong>Inflation</strong> (Pre-War and War) <strong>Cycle</strong>s CAGR <strong>of</strong> CAGR <strong>of</strong> CAGR <strong>of</strong> CAGR <strong>of</strong> CAGR <strong>of</strong> CAGR <strong>of</strong> CAGR <strong>of</strong><br />
PPI - All PPI PPI M2 Money Real U.S. CPI U.S. S<strong>to</strong>ck<br />
Com- Farm Fuels Supply Economic Urban Market<br />
Start End Yrs. modities Products & Power Growth Growth (1) <strong>Inflation</strong> Index (2)<br />
<strong>Cycle</strong> One 1898 <strong>to</strong> 1920 22 5.4% 5.7% 7.3% 7.6% 3.4% 4.1% 2.2%<br />
Pre-war period was: 1898 <strong>to</strong> 1914 16 2.2% 2.9% 3.1% 6.5% 3.9% 1.2% 3.0%<br />
War years were (3) : 1914 <strong>to</strong> 1920 6 14.6% 13.3% 19.4% 10.8% 1.1% 12.2% 0.1%<br />
<strong>Cycle</strong> Two 1933 <strong>to</strong> 1951 18 5.6% 7.9% 3.6% 8.2% 5.4% 4.0% 5.6%<br />
Pre-war period was: 1933 <strong>to</strong> 1939 6 2.6% 4.1% 1.6% 7.7% 5.7% 1.2% 5.8%<br />
War years were (4) : 1939 <strong>to</strong> 1951 12 7.1% 9.9% 4.7% 8.5% 5.5% 5.3% 5.5%<br />
<strong>Cycle</strong> Three 1965 <strong>to</strong> 1981 16 7.2% 8.1% 13.2% 8.4% 3.4% 6.8% 2.3%<br />
Pre-Oil Embargo (5) was: 1965 <strong>to</strong> 1973 8 4.3% 4.1% 4.4% 7.7% 4.2% 4.4% 2.3%<br />
Oil Embargo(es) were: 1973 <strong>to</strong> 1981 8 10.2% 12.2% 22.8% 9.2% 2.9% 9.4% 2.3%<br />
<strong>Cycle</strong> One, Two, and Three Average:<br />
<strong>of</strong> which the pre-war average was:<br />
and the war-related (6) average was:<br />
19 6.1% 7.2% 8.1% 8.1% 4.1% 5.0% 3.4%<br />
10 3.0% 3.7% 3.0% 7.3% 4.6% 2.3% 3.7%<br />
9 10.7% 11.8% 15.6% 9.5% 3.2% 9.0% 2.6%<br />
Deflation (Post-War) <strong>Cycle</strong>s<br />
CAGR <strong>of</strong> CAGR <strong>of</strong> CAGR <strong>of</strong> CAGR <strong>of</strong> CAGR <strong>of</strong> CAGR <strong>of</strong> CAGR <strong>of</strong><br />
PPI - All PPI PPI M2 Real U.S. CPI U.S. S<strong>to</strong>ck<br />
Com- Farm Fuels Y/Y % Economic Urban Market<br />
Start End Yrs. modities Products & Power Growth Growth (1) <strong>Inflation</strong> Index (2)<br />
<strong>Cycle</strong> One 1920 <strong>to</strong> 1933 13 ( 6.3 )% ( 8.0 )% ( 6.7 )% 1.0% 0.1% ( 3.3 )% ( 0.1 )%<br />
Roaring 20s were: 1920 <strong>to</strong> 1929 9 ( 5.2 )% ( 4.0 )% ( 7.2 )% 4.3% 3.6% ( 1.7 )% 12.8%<br />
<strong>Cycle</strong> Two 1951 <strong>to</strong> 1965 14 0.4% ( 1.6 )% 0.4% 5.6% 4.0% 1.4% 10.4%<br />
<strong>Cycle</strong> Three 1981 <strong>to</strong> 2001 20 1.6% 1.8% 0.4% 5.8% 3.1% 3.4% 11.8%<br />
<strong>Cycle</strong> One, Two, and Three Average (7): 14 ( 1.1 )% ( 1.3 )% ( 2.2 )% 5.2% 3.6% 1.0% 11.7%<br />
(1) For U.S. economic growth, we use real GNP prior <strong>to</strong> 1947, and GDP thereafter, indexed <strong>to</strong> year 2001 U.S. dollars.<br />
(2) This is the U.S. s<strong>to</strong>ck market composite index price return only, and does not include reinvested dividends.<br />
(3) Though World War I ended in 1918, we include 1919 <strong>to</strong> 1920 because the war's commodity bubble and deficit spending continued.<br />
(4) We include the post-World War Two period since price controls were lifted after the war, and the Korean Conflict had some impact.<br />
(5) <strong>The</strong> Great Society "war" on poverty, plus Vietnam, were more regional rather that global in focus, in our view.<br />
(6) Average <strong>of</strong> World Wars I and II, as well as the global economic warfare <strong>of</strong> the Middle East war-related Oil Embargoes <strong>of</strong> the 1970s.<br />
(7) Average <strong>of</strong> Roaring 20s, <strong>Cycle</strong> Two and Three; the deflationary calamity <strong>of</strong> the early 1930s renders comparable analysis meaningless.<br />
Source: Legg Mason, data from U.S. Dept. <strong>of</strong> Commerce, U.S. Census publication “His<strong>to</strong>rical Statistics <strong>of</strong> the United States, Colonial<br />
Times <strong>to</strong> 1970,” Standard and Poor’s Corporation, National Bureau <strong>of</strong> Economic Research macroeconomic database
Industrial Portfolio Strategy<br />
<strong>The</strong> <strong>Inflation</strong> <strong>Cycle</strong> <strong>of</strong> <strong>2002</strong> <strong>to</strong> <strong>2015</strong> ⎯ April 19, <strong>2002</strong> -17- Legg Mason Wood Walker, Inc.<br />
<strong>The</strong> commodity inflation cycles were followed by deflation (peace dividend) cycles that averaged 14<br />
years in length, but have grown longer, and featured moderate M2 and real GDP growth, low inflation<br />
and high equity returns.<br />
We foresee a period in the <strong>2002</strong> <strong>to</strong> <strong>2015</strong> time frame in which M2 growth generally maintains its current,<br />
high growth rate, inflation gradually begins <strong>to</strong> accelerate, and s<strong>to</strong>ck market returns moderate. We also believe<br />
that the <strong>2002</strong> <strong>to</strong> <strong>2015</strong> period may feature either a “pre-war” phase, or a new type <strong>of</strong> global<br />
“growth explosion” phase, and that issue is the subject <strong>of</strong> this report.<br />
Even though commodities have different applications, inflation is a uniting fac<strong>to</strong>r, and in Exhibit 10<br />
we show that their prices tend <strong>to</strong> rise and fall in unison. <strong>The</strong> three major commodity inflation periods highlighted<br />
in Exhibit 10 are labeled “A” for inflation <strong>Cycle</strong> One (1898 <strong>to</strong> 1920), “B” for <strong>Cycle</strong> Two (1933 <strong>to</strong><br />
1951), and “C” for <strong>Cycle</strong> Three (1965 <strong>to</strong> 1981). <strong>The</strong> fourth expected cycle, <strong>2002</strong> <strong>to</strong> <strong>2015</strong>, is the subject <strong>of</strong><br />
this report. Note that in addition <strong>to</strong> the PPI for All Commodities, shown as a red line in Exhibit 10, we provide<br />
the subindices for Fuels and Electricity, Farm Products, and Metals, all <strong>of</strong> which are <strong>of</strong> interest in our<br />
machinery research. <strong>The</strong> polarizing inflation effect <strong>of</strong> major wars is clear, but we observe that the commodity<br />
inflation periods generally began before the “hot” or economic warfare began in earnest. For the years<br />
<strong>2002</strong> <strong>to</strong> <strong>2015</strong>, we forecast a 6.1% compound annual growth rate for the PPI for All Commodities index.<br />
Exhibit 10 – PPI All Commodities Index Y/Y % Change Compared <strong>to</strong> the PPI Subindices for<br />
Energy, Farm Products and Metals, 1870 <strong>to</strong> 2001<br />
25%<br />
Commodity inflations tend <strong>to</strong> occur in unison.<br />
20%<br />
y/y %, 10-year moving average<br />
15%<br />
10%<br />
5%<br />
0%<br />
A<br />
B<br />
C<br />
LM forecast<br />
for PPI All<br />
Commodities<br />
<strong>2002</strong> <strong>to</strong> <strong>2015</strong><br />
-5%<br />
-10%<br />
1880<br />
1890<br />
1900<br />
1910<br />
1920<br />
1930<br />
1940<br />
1950<br />
1960<br />
1970<br />
1980<br />
1990<br />
2000<br />
2010E<br />
PPI All Commodities 10-Yr. Moving Average<br />
PPI Fuels and Electric Power 10-Yr. Moving Average<br />
PPI Farm Products 10-Yr. Moving Average<br />
PPI Metals and Metal Products 10-Yr. Moving Average<br />
Source: U.S. Dept. <strong>of</strong> Commerce, U.S. Census publication “His<strong>to</strong>rical Statistics <strong>of</strong> the United States, Colonial Times <strong>to</strong> 1970,” Standard<br />
and Poor’s Corporation, National Bureau <strong>of</strong> Economic Research macroeconomic database, Legg Mason estimates for <strong>2002</strong> <strong>to</strong>
Industrial Portfolio Strategy<br />
<strong>The</strong> <strong>Inflation</strong> <strong>Cycle</strong> <strong>of</strong> <strong>2002</strong> <strong>to</strong> <strong>2015</strong> ⎯ April 19, <strong>2002</strong> -18- Legg Mason Wood Walker, Inc.<br />
Companies that produce commodities spend more on capital assets when they are pr<strong>of</strong>itable, which<br />
occurs when commodity prices and demand are strong. In Exhibit 11, for the half-century period 1950<br />
<strong>to</strong> 2001, we show the fixed asset replacement rate relative <strong>to</strong> annual depreciation, depletion and amortization<br />
(DD&A), as well as the remaining useful (book) life <strong>of</strong> fixed assets, for four consumers <strong>of</strong> various<br />
types <strong>of</strong> machinery produced by Caterpillar, Deere, or Joy Global. Those companies are Exxon Mobil<br />
(XOM), Phelps Dodge (PD), International Paper (IP), and the former Homestake Mining (HM is latest 12<br />
months through September 2001). Note the way in which those companies spent capital when they had pricing<br />
and volume, circa 1965 <strong>to</strong> 1980. Times have changed, and we expect those companies, as well as other<br />
survivors in their industries, <strong>to</strong> be more careful with respect <strong>to</strong> spending than they were in the commodity<br />
bubble <strong>of</strong> the 1970s. Nevertheless, we find it interesting that capital spending is currently at a his<strong>to</strong>rically<br />
low level relative <strong>to</strong> DD&A, and there is room <strong>to</strong> increase the remaining useful life <strong>of</strong> the producers’ net<br />
fixed assets if pr<strong>of</strong>its allow for capital spending, which we believe would require demand and pricing for<br />
commodities <strong>to</strong> surprise on the upside. Even without a repeat <strong>of</strong> the 1970s aberration, our goal is <strong>to</strong> position<br />
inves<strong>to</strong>rs <strong>to</strong> take advantage <strong>of</strong> the demand and pricing recovery cycle we see from <strong>2002</strong> <strong>to</strong> <strong>2015</strong>.<br />
Exhibit 11 – Machinery Purchasers XOM, PD, IP and HM Fixed Asset Replacement Rate<br />
Versus Average Remaining Useful Life Of Property, Plant and Equipment, 1950 <strong>to</strong> 2001<br />
Capital Exp. Divided by DD&A (%<br />
400%<br />
300%<br />
200%<br />
100%<br />
0%<br />
1950<br />
<strong>The</strong> Average Fixed Asset Replacement And <strong>The</strong> Remaining Useful (Book) Life Of Fixed<br />
Assets, For Several Major Commodity Producers, 1950 <strong>to</strong> 2001<br />
18 Yrs.<br />
<strong>The</strong> prior<br />
commodity<br />
16 Yrs.<br />
inflation.<br />
1955<br />
1960<br />
1965<br />
1970<br />
1975<br />
1980<br />
1985<br />
Capital Expenditures Divided By DD&A for XOM, PD, HM, and IP, Straight Average (Left Axis)<br />
Net PP&E Divided By DD&A for XOM, PD, HM, and IP, Straight Average (Right Axis)<br />
1990<br />
1995<br />
2000<br />
2005E<br />
?<br />
2010E<br />
<strong>2015</strong>E<br />
14 Yrs.<br />
12 Yrs.<br />
10 Yrs.<br />
8Yrs.<br />
Net PP&E Divided By DD&A<br />
(Average Remaining Life <strong>of</strong> Net<br />
PP&E), years<br />
Source: Company reports<br />
<strong>The</strong> relative performance <strong>of</strong> commodities versus s<strong>to</strong>cks, shown on the cover <strong>of</strong> this report, is an interesting<br />
concept, but inves<strong>to</strong>rs cannot “spend relative performance.” In Exhibit 12, we drill deeper in<strong>to</strong><br />
our cover page chart, and show the actual values for the PPI All Commodities index in the years 1870 <strong>to</strong><br />
2001, with our forecast for the period <strong>2002</strong> <strong>to</strong> <strong>2015</strong>. In Exhibit 13, we show the same for the U.S. s<strong>to</strong>ck<br />
market.
Industrial Portfolio Strategy<br />
<strong>The</strong> <strong>Inflation</strong> <strong>Cycle</strong> <strong>of</strong> <strong>2002</strong> <strong>to</strong> <strong>2015</strong> ⎯ April 19, <strong>2002</strong> -19- Legg Mason Wood Walker, Inc.<br />
Exhibit 12 – PPI for All Commodities Index, 1870 <strong>to</strong> 2001, With Our Forecast <strong>to</strong> <strong>2015</strong><br />
1000<br />
100<br />
Note the trade-<strong>of</strong>f between<br />
commodity and s<strong>to</strong>ck price<br />
leadership.<br />
1898 <strong>to</strong><br />
1920<br />
+219%<br />
(57)%<br />
1933<br />
<strong>to</strong><br />
1951<br />
+167%<br />
+6%<br />
1965<br />
<strong>to</strong><br />
1981<br />
+204%<br />
+38%<br />
2001 <strong>to</strong><br />
<strong>2015</strong>?<br />
+130%<br />
LM<br />
Ests.<br />
10<br />
1<br />
1870<br />
1880<br />
1890<br />
1900<br />
1910<br />
1920<br />
1930<br />
1940<br />
1950<br />
1960<br />
1970<br />
1980<br />
1990<br />
2000<br />
2010E<br />
PPI- All Commodities Index<br />
Source: U.S. Dept. <strong>of</strong> Commerce, U.S. Census publication “His<strong>to</strong>rical Statistics <strong>of</strong> the United States, Colonial Times <strong>to</strong> 1970,” Standard<br />
and Poor’s Corporation, National Bureau <strong>of</strong> Economic Research macroeconomic database, Legg Mason estimates for <strong>2002</strong> <strong>to</strong><br />
Exhibit 13 – U.S. S<strong>to</strong>ck Market Index, 1870 <strong>to</strong> 2001, With Our Forecast <strong>to</strong> <strong>2015</strong><br />
10000<br />
1000<br />
100<br />
Note the trade-<strong>of</strong>f between<br />
s<strong>to</strong>ck and commodity price<br />
leadership.<br />
1898 <strong>to</strong><br />
1920<br />
61%<br />
+196%<br />
1920<br />
<strong>to</strong><br />
1929<br />
1933<br />
<strong>to</strong><br />
1951<br />
+167%<br />
1933-51<br />
+299%<br />
1965<br />
<strong>to</strong><br />
1981<br />
+45%<br />
+798%<br />
2001 <strong>to</strong><br />
<strong>2015</strong>?<br />
+83%<br />
LM<br />
Ests.<br />
10<br />
1<br />
1870<br />
1880<br />
1890<br />
1900<br />
1910<br />
1920<br />
1930<br />
1940<br />
1950<br />
1960<br />
1970<br />
1980<br />
1990<br />
2000<br />
2010E<br />
S&P S<strong>to</strong>ck Market Composite (Log Scale)<br />
Source: U.S. Dept. <strong>of</strong> Commerce, U.S. Census publication “His<strong>to</strong>rical Statistics <strong>of</strong> the United States, Colonial Times <strong>to</strong> 1970,” Standard<br />
and Poor’s Corporation, National Bureau <strong>of</strong> Economic Research macroeconomic database, Legg Mason estimates for <strong>2002</strong> <strong>to</strong>
Industrial Portfolio Strategy<br />
<strong>The</strong> <strong>Inflation</strong> <strong>Cycle</strong> <strong>of</strong> <strong>2002</strong> <strong>to</strong> <strong>2015</strong> ⎯ April 19, <strong>2002</strong> -20- Legg Mason Wood Walker, Inc.<br />
We believe inflation cycles are more regular and pronounced when viewed through the lens <strong>of</strong> longterm<br />
his<strong>to</strong>ry. In Exhibit 14, we show the 10-year moving average <strong>of</strong> consumer price inflation, with our<br />
forecast for the <strong>2002</strong> <strong>to</strong> <strong>2015</strong> period. <strong>The</strong> trough years for the inflation index cycles were 1901, 1933, 1963<br />
and, we believe, 2001. Bonds are usually the first <strong>to</strong> react <strong>to</strong> those inflation concerns, and thus far we note<br />
that there is little reason for alarm. For example, Treasury <strong>Inflation</strong>-Protected <strong>Securities</strong> (TIPS) spreads<br />
have widened, but no differently than they did in the Spring <strong>of</strong> 2001 when there was also economic recovery<br />
optimism. <strong>The</strong> fact that so little inflation risk is embedded in market expectations only raises the risk <strong>to</strong><br />
inves<strong>to</strong>rs if we are correct about the direction change.<br />
Exhibit 14 – U.S. CPI <strong>Inflation</strong> <strong>Cycle</strong>s, 1880 <strong>to</strong> 2001, With Our <strong>2002</strong> <strong>to</strong> <strong>2015</strong> Estimates<br />
CPI - Urban <strong>Inflation</strong> Rate, 10-Yr. Moving Average<br />
10%<br />
8%<br />
6%<br />
4%<br />
2%<br />
0%<br />
-2%<br />
-4%<br />
Periods <strong>of</strong> commodity inflation have similar implications for consumer inflation, as well<br />
as the s<strong>to</strong>ck market via compression <strong>of</strong> valuation and pr<strong>of</strong>it margins.<br />
1901<br />
1933<br />
CPI <strong>Inflation</strong> <strong>Cycle</strong>s<br />
1880<br />
1885<br />
1890<br />
1895<br />
1900<br />
1905<br />
1910<br />
1915<br />
1920<br />
1925<br />
1930<br />
1935<br />
1940<br />
1945<br />
1950<br />
1955<br />
1960<br />
1965<br />
1970<br />
1975<br />
1980<br />
1985<br />
1990<br />
1995<br />
2000<br />
2005E<br />
2010E<br />
<strong>2015</strong>E<br />
1963<br />
CPI Urban <strong>Inflation</strong> Rate, 10-Yr. Moving Average<br />
2001<br />
<strong>2002</strong> <strong>to</strong><br />
<strong>2015</strong><br />
LMWW<br />
Ests.<br />
Repeat<br />
<strong>of</strong> the<br />
<strong>Cycle</strong>?<br />
Source: U.S. Department <strong>of</strong> Commerce, U.S. Bureau <strong>of</strong> the Census, Standard and Poor’s Corp., Legg Mason estimates for <strong>2002</strong> <strong>to</strong><br />
For inves<strong>to</strong>rs with a long-term horizon, acknowledging the inflation cycle enables them <strong>to</strong> position<br />
portfolios by better understanding the real return cycles <strong>of</strong> the inflating and deflating assets. In Exhibit<br />
15, we show the 10-year moving average <strong>of</strong> the real (after consumer inflation) price return <strong>of</strong> the U.S.<br />
s<strong>to</strong>ck market composite for the 1880 <strong>to</strong> <strong>2015</strong>E period. We note the way in which the real price return <strong>of</strong><br />
s<strong>to</strong>cks fluctuates around 0% plus-or-minus 10%. After a fairly normal retrace from negative-<strong>to</strong>-positive returns<br />
in the 1982 <strong>to</strong> 2000 period, we believe the recent market break foreshadows a period <strong>of</strong> declining real<br />
returns, with the greatest adversity felt later in the <strong>2002</strong> <strong>to</strong> <strong>2015</strong> period.
Industrial Portfolio Strategy<br />
<strong>The</strong> <strong>Inflation</strong> <strong>Cycle</strong> <strong>of</strong> <strong>2002</strong> <strong>to</strong> <strong>2015</strong> ⎯ April 19, <strong>2002</strong> -21- Legg Mason Wood Walker, Inc.<br />
Exhibit 15 – S<strong>to</strong>ck Returns Minus <strong>Inflation</strong>, 1880 <strong>to</strong> 2001, with our <strong>2002</strong> <strong>to</strong> <strong>2015</strong> Estimates<br />
S<strong>to</strong>ck <strong>Price</strong> Return Minus CPI <strong>Inflation</strong>, 10-Year M.A.<br />
15%<br />
10%<br />
5%<br />
0%<br />
-5%<br />
-10%<br />
-15%<br />
CPI inflation cycles shown in boxes. Note that s<strong>to</strong>cks follow a +/- 10% real return track.<br />
1880<br />
1885<br />
1890<br />
1895<br />
1900<br />
1905<br />
1910<br />
1915<br />
1920<br />
1925<br />
1930<br />
1935<br />
1940<br />
1945<br />
1950<br />
1955<br />
1960<br />
1965<br />
1970<br />
1975<br />
1980<br />
1985<br />
1990<br />
1995<br />
2000<br />
2005E<br />
2010E<br />
<strong>2015</strong>E<br />
S&P S<strong>to</strong>ck Composite Return Minus Consumer <strong>Inflation</strong> 10-yr. Moving Average<br />
<strong>2002</strong> <strong>to</strong><br />
<strong>2015</strong><br />
LMWW<br />
Ests.<br />
Source: U.S. Department <strong>of</strong> Commerce, U.S. Bureau <strong>of</strong> the Census, Standard & Poor’s Corp., Legg Mason estimates for <strong>2002</strong> <strong>to</strong> <strong>2015</strong><br />
Although we have stated that war and inflation are linked, we observe that rapid money supply<br />
growth typically has begun several years before wars. In Exhibit 16, we walk through the quantitative<br />
side <strong>of</strong> the macro-his<strong>to</strong>ry <strong>of</strong> U.S. inflation and s<strong>to</strong>ck market cycles, and demonstrate the effect each has on<br />
the s<strong>to</strong>ck market. <strong>The</strong> chart pairs are displayed as follows:<br />
<br />
<br />
<br />
<br />
Each <strong>of</strong> the chart pairs in Exhibit 16 is centered on the trough year for the inflation cycle previously<br />
identified as 1901, 1933, 1963 and, we believe, 2001.<br />
For each <strong>of</strong> those years, we show the inflation-adjusted U.S. s<strong>to</strong>ck market index versus M2 money supply<br />
growth (left chart) and versus the U.S. consumer price inflation index (right chart), in the 12 years<br />
before and after the inflation cycle trough year. Each point is a 12-month average.<br />
<strong>The</strong> charts show the way in which, approximately every one-third <strong>of</strong> a century, (1) M2 rises, (2) s<strong>to</strong>cks<br />
rise, (3) inflation rises, (4) s<strong>to</strong>cks go flat in real terms, and (5) war in one form or another ensues.<br />
Not shown in the charts, but discussed later in this report, is the fact that there <strong>of</strong>ten has been a deterioration<br />
<strong>of</strong> the velocity <strong>of</strong> M2 (rearranged as M2 divided by real GDP or GNP in our analysis).<br />
Regardless <strong>of</strong> the “New Era” thinking <strong>of</strong> the time, or the transi<strong>to</strong>ry effects <strong>of</strong> liquidity preferences,<br />
we believe that money supply growth is at the core <strong>of</strong> inflation cycles. Later in this report we discuss<br />
recent trends in M2, real U.S. GDP and CPI inflation growth.
Industrial Portfolio Strategy<br />
<strong>The</strong> <strong>Inflation</strong> <strong>Cycle</strong> <strong>of</strong> <strong>2002</strong> <strong>to</strong> <strong>2015</strong> ⎯ April 19, <strong>2002</strong> -22- Legg Mason Wood Walker, Inc.<br />
Exhibit 16 – <strong>The</strong> <strong>Inflation</strong>-Adjusted U.S. S<strong>to</strong>ck Market Index, M2 Money Supply, and U.S.<br />
Consumer <strong>Price</strong> <strong>Inflation</strong>, <strong>The</strong> 1901 and 1933 <strong>Inflation</strong> <strong>Cycle</strong> Turning Points +/- 12 Years<br />
Note the way in which rising money supply precedes and then feeds inflation, ultimately causing<br />
real s<strong>to</strong>ck prices <strong>to</strong> enter a secular bear market, and then, finally, war results.<br />
M2 Money Supply $ Bil.<br />
25<br />
23<br />
21<br />
19<br />
17<br />
15<br />
13<br />
11<br />
9<br />
7<br />
5<br />
(2)<br />
S<strong>to</strong>cks<br />
rise.<br />
1901 +/- 12 yrs.<br />
(1) M2<br />
rises.<br />
210<br />
190<br />
170<br />
150<br />
130<br />
110<br />
90<br />
70<br />
50<br />
U.S. <strong>Price</strong> <strong>Inflation</strong> Index, 2000 = 100.00<br />
6.00<br />
5.75<br />
5.50<br />
5.25<br />
5.00<br />
4.75<br />
1901 +/- 12 yrs.<br />
(4) S<strong>to</strong>cks<br />
flatten.<br />
(3) <strong>Inflation</strong><br />
rises.<br />
210<br />
190<br />
170<br />
150<br />
130<br />
110<br />
90<br />
(5)<br />
70<br />
War<br />
begins.<br />
50<br />
U.S. S<strong>to</strong>ck Market Index<br />
1889<br />
1891<br />
1893<br />
1895<br />
1897<br />
1899<br />
1901<br />
1903<br />
1905<br />
1907<br />
1909<br />
1911<br />
1913<br />
U.S. <strong>Price</strong> <strong>Inflation</strong> Index, Year 2000 = 100.00 (Left Axis)<br />
<strong>Inflation</strong>-adjusted U.S. S<strong>to</strong>ck Market Index (Right Axis)<br />
M2 Money Supply $ Bil.<br />
195<br />
175<br />
155<br />
135<br />
115<br />
95<br />
75<br />
55<br />
35<br />
1933 +/- 12 yrs.<br />
1921<br />
1923<br />
1925<br />
1927<br />
1929<br />
1931<br />
1933<br />
1935<br />
1937<br />
1939<br />
1941<br />
1943<br />
1945<br />
(2)<br />
S<strong>to</strong>cks<br />
rise.<br />
(1) M2<br />
rises.<br />
300<br />
250<br />
200<br />
150<br />
100<br />
50<br />
US. S<strong>to</strong>ck Market Index<br />
10.75<br />
10.50<br />
10.25<br />
10.00<br />
9.75<br />
9.50<br />
9.25<br />
9.00<br />
8.75<br />
8.50<br />
8.25<br />
8.00<br />
7.75<br />
7.50<br />
7.25<br />
7.00<br />
1921<br />
1923<br />
1925<br />
1927<br />
1929<br />
1931<br />
1933<br />
1935<br />
1937<br />
1939<br />
1941<br />
1943<br />
1945<br />
1889<br />
1891<br />
1893<br />
1895<br />
1897<br />
1899<br />
1901<br />
1903<br />
1905<br />
1907<br />
1909<br />
1911<br />
1913<br />
US. S<strong>to</strong>ck Market Index<br />
U.S. M2 Money Supply (Left Axis)<br />
<strong>Inflation</strong> Adjusted U.S. S<strong>to</strong>ck Market Index (Right Axis)<br />
U.S. <strong>Price</strong> <strong>Inflation</strong> Index, 2000 = 100.00<br />
1933 +/- 12 yrs.<br />
(4) S<strong>to</strong>cks<br />
flatten.<br />
(3) <strong>Inflation</strong><br />
rises.<br />
300<br />
250<br />
200<br />
150<br />
100<br />
(5) War<br />
begins.<br />
50<br />
U.S. S<strong>to</strong>ck Market Index<br />
U.S. M2 Money Supply (Left Axis)<br />
<strong>Inflation</strong>-adjusted U.S. S<strong>to</strong>ck Market Index (Right Axis)<br />
U.S. <strong>Price</strong> <strong>Inflation</strong> Index, Year 2000 = 100.00 (Left Axis)<br />
<strong>Inflation</strong>-adjusted U.S. S<strong>to</strong>ck Market Index (Right Axis)<br />
Source: NBER, Standard & Poor’s Corporation, U.S. Dept. <strong>of</strong> Commerce, Legg Mason format and estimates
Industrial Portfolio Strategy<br />
<strong>The</strong> <strong>Inflation</strong> <strong>Cycle</strong> <strong>of</strong> <strong>2002</strong> <strong>to</strong> <strong>2015</strong> ⎯ April 19, <strong>2002</strong> -23- Legg Mason Wood Walker, Inc.<br />
Exhibit 16 Cont’d. – <strong>Inflation</strong>-Adjusted U.S. S<strong>to</strong>ck Market Index, M2 Money Supply, and<br />
U.S. Consumer <strong>Inflation</strong>, <strong>The</strong> 1963 and 2001(E) <strong>Inflation</strong> <strong>Cycle</strong> Turning Points +/- 12 Years<br />
1,035<br />
1963 +/- 12 yrs.<br />
525<br />
37.00<br />
1963 +/- 12 yrs.<br />
525<br />
M2 Money Supply $ Bil.<br />
935<br />
835<br />
735<br />
635<br />
535<br />
435<br />
335<br />
235<br />
135<br />
(2)<br />
S<strong>to</strong>cks<br />
rise.<br />
(1) M2<br />
rises.<br />
1951<br />
1953<br />
1955<br />
1957<br />
1959<br />
1961<br />
1963<br />
1965<br />
1967<br />
1969<br />
1971<br />
1973<br />
1975<br />
U.S. M2 Money Supply (Left Axis)<br />
<strong>Inflation</strong>-adjusted U.S. S<strong>to</strong>ck Market Index (Right Axis)<br />
475<br />
425<br />
375<br />
325<br />
275<br />
225<br />
175<br />
125<br />
US. S<strong>to</strong>ck Market Index<br />
U.S. <strong>Price</strong> <strong>Inflation</strong> Index, 2000 = 100.00<br />
32.00<br />
27.00<br />
22.00<br />
17.00<br />
12.00<br />
(4)<br />
S<strong>to</strong>cks<br />
flatten.<br />
(3) <strong>Inflation</strong><br />
rises.<br />
1951<br />
1953<br />
1955<br />
1957<br />
1959<br />
1961<br />
1963<br />
1965<br />
1967<br />
1969<br />
1971<br />
1973<br />
1975<br />
475<br />
425<br />
375<br />
325<br />
275<br />
225<br />
(5) Economic<br />
warfare. 175 *<br />
U.S. <strong>Price</strong> <strong>Inflation</strong> Index, Year 2000 = 100.00 (Left Axis)<br />
<strong>Inflation</strong>-adjusted U.S. S<strong>to</strong>ck Market Index (Right Axis)<br />
7,000<br />
2001 +/- 12 yrs.<br />
1,525<br />
6,500<br />
6,000<br />
5,500<br />
5,000<br />
4,500<br />
4,000<br />
3,500<br />
3,000<br />
2,500<br />
1989<br />
1991<br />
1993<br />
1995<br />
1997<br />
1999<br />
2001<br />
2003E<br />
2005E<br />
2007E<br />
2009E<br />
2011E<br />
2013E<br />
* This report makes a case that the OPEC embargo w as global economic w arfare.<br />
125<br />
U.S. S<strong>to</strong>ck Market Index<br />
200.00<br />
2001 +/- 12 yrs.<br />
1,525<br />
M2 Money Supply $ Bil.<br />
(2)<br />
S<strong>to</strong>cks<br />
rise.<br />
(1) M2<br />
rises.<br />
1,325<br />
1,125<br />
925<br />
725<br />
525<br />
US. S<strong>to</strong>ck Market Index<br />
U.S. <strong>Price</strong> <strong>Inflation</strong> Index, 2000 = 100.00<br />
175.00<br />
150.00<br />
125.00<br />
100.00<br />
75.00<br />
(4)<br />
S<strong>to</strong>cks<br />
flatten.<br />
(3) <strong>Inflation</strong><br />
rises.<br />
1,325<br />
1,125<br />
925<br />
725<br />
(5) War 525<br />
risk.<br />
325<br />
50.00<br />
1989<br />
1991<br />
1993<br />
1995<br />
1997<br />
1999<br />
2001<br />
2003E<br />
2005E<br />
2007E<br />
2009E<br />
2011E<br />
2013E<br />
U.S. S<strong>to</strong>ck Market Index<br />
325<br />
U.S. M2 Money Supply (Left Axis)<br />
<strong>Inflation</strong>-adjusted U.S. S<strong>to</strong>ck Market Index (Right Axis)<br />
U.S. <strong>Price</strong> <strong>Inflation</strong> Index, Year 2000 = 100.00 (Left Axis)<br />
<strong>Inflation</strong>-adjusted U.S. S<strong>to</strong>ck Market Index (Right Axis)<br />
Source: NBER, Standard & Poor’s Corporation, U.S. Dept. <strong>of</strong> Commerce, Legg Mason format and estimates
Industrial Portfolio Strategy<br />
<strong>The</strong> <strong>Inflation</strong> <strong>Cycle</strong> <strong>of</strong> <strong>2002</strong> <strong>to</strong> <strong>2015</strong> ⎯ April 19, <strong>2002</strong> -24- Legg Mason Wood Walker, Inc.<br />
<strong>The</strong> Structure <strong>of</strong> This Report<br />
This report is constructed as a probability array <strong>of</strong> expected values, based on what we believe are the<br />
three most plausible <strong>2002</strong> <strong>to</strong> <strong>2015</strong> outcomes; we use his<strong>to</strong>rical precedent as the “effect,” and our objective<br />
assessment <strong>of</strong> the facts presented in the remainder <strong>of</strong> this report as the “cause.” For a long period<br />
such as <strong>2002</strong> <strong>to</strong> <strong>2015</strong>, we would expect some combination <strong>of</strong> the <strong>of</strong>ten mutually exclusive events we<br />
cite, so a probability-weighted analysis seems the best approach, in our view. <strong>The</strong> scenarios we describe are<br />
as follows.<br />
<br />
<br />
<br />
Scenario (1) Continued deflation and a continuation <strong>of</strong> the western-dominated status quo, <strong>to</strong> include<br />
the (technology) capital spending boom and sustained, double-digit U.S. equity bull market returns in<br />
the <strong>2002</strong> <strong>to</strong> <strong>2015</strong> period. (Probability 15%)<br />
Scenario (2) Rapid developing country modernization, combined with synchronous G-7 economic recovery,<br />
leading <strong>to</strong> a sustained boom in commodity demand relative <strong>to</strong> more inelastic supply. <strong>The</strong>re is<br />
the potential for Persian Gulf conflict that may periodically constrict supply, further tilting the supply/<br />
demand equation in favor <strong>of</strong> commodity inflation in the <strong>2002</strong> <strong>to</strong> <strong>2015</strong> period. (Probability 60%)<br />
Scenario (3) Middle East war(s) that result in large oil supply disruptions. Because major wars produce<br />
high inflation and low real s<strong>to</strong>ck price gains, and even minor wars can interrupt trade, we devote a<br />
section <strong>of</strong> this report <strong>to</strong> analyzing the potential for conflict in the Persian Gulf. (Probability 25%)<br />
As a result <strong>of</strong> this probability matrix, for the period <strong>2002</strong> <strong>to</strong> <strong>2015</strong>, we see the PPI All Commodities as<br />
outpacing the price return <strong>of</strong> the broad U.S. s<strong>to</strong>ck market (S&P 500) index, and we expect gradually<br />
rising CPI inflation. As Exhibit 17 shows, we expect the following:<br />
• 6.1% CAGR for the PPI commodities (back-half higher),<br />
• 4.4% price only CAGR for the U.S. s<strong>to</strong>ck market (front-half higher),<br />
• 5.4% CAGR for consumer price inflation (back-half higher), and<br />
• CPI-urban inflation cresting at a rate <strong>of</strong> almost 8% late in the <strong>2002</strong> <strong>to</strong> <strong>2015</strong> period.<br />
This is not a forecast for specific years, in which leadership may alternate from one year <strong>to</strong> the next, but<br />
rather, it is a full-cycle view meant <strong>to</strong> position long-term inves<strong>to</strong>rs, as well as guide short-term inves<strong>to</strong>rs<br />
who may employ a trading discipline. His<strong>to</strong>ry and probability assessments based on current events are imperfect<br />
as forecasting <strong>to</strong>ols, but using the <strong>to</strong>ols <strong>to</strong> the best <strong>of</strong> our ability is our purpose as an analyst. Our<br />
report concludes that Caterpillar, Deere, and Joy Global would be beneficiaries <strong>of</strong> the environment<br />
we foresee <strong>to</strong> <strong>2015</strong>, which is a marked change from the environment <strong>of</strong> the last two decades.
Industrial Portfolio Strategy<br />
<strong>The</strong> <strong>Inflation</strong> <strong>Cycle</strong> <strong>of</strong> <strong>2002</strong> <strong>to</strong> <strong>2015</strong> ⎯ April 19, <strong>2002</strong> -25- Legg Mason Wood Walker, Inc.<br />
Exhibit 17 – Return and Growth Table for Commodities, S<strong>to</strong>cks and <strong>Inflation</strong>, <strong>2002</strong> <strong>to</strong> <strong>2015</strong>E<br />
<strong>2002</strong> <strong>to</strong> <strong>2002</strong> <strong>to</strong><br />
PPI All Commodities Expected Growth, <strong>2002</strong> <strong>to</strong> <strong>2015</strong>E <strong>2015</strong>E PPI <strong>2015</strong>E PPI<br />
Com- Com-<br />
Prob- modities modities<br />
ability Growth Est. CAGR%<br />
Status Quo 15.0% x ( 1.1 )% = ( 0.2 )%<br />
Sharply Higher World GDP Growth, Some Warfare 60.0% x 6.1% = 3.6%<br />
Major Middle East Conflicts That Disrupt Oil Supply 25.0% x 10.7% = 2.7%<br />
Sum or Average 100.0% nmf 6.1%<br />
<strong>2002</strong> <strong>to</strong> <strong>2002</strong> <strong>to</strong><br />
S&P 500 Expected <strong>Price</strong> Return, <strong>2002</strong> <strong>to</strong> <strong>2015</strong>E<br />
<strong>2015</strong>E S&P <strong>2015</strong>E S&P<br />
Composite Composite<br />
Prob- <strong>Price</strong> <strong>Price</strong><br />
ability Growth Est. CAGR%<br />
Status Quo 15.0% x 11.7% = 1.7%<br />
Sharply Higher World GDP Growth, Some Warfare 60.0% x 3.4% = 2.0%<br />
Major Middle East War 25.0% x 2.6% = 0.7%<br />
Sum or Average 100.0% nmf 4.4%<br />
<strong>2002</strong> <strong>to</strong> <strong>2002</strong> <strong>to</strong><br />
U.S. Consumer <strong>Price</strong> <strong>Inflation</strong>, <strong>2002</strong> <strong>to</strong> <strong>2015</strong>E<br />
<strong>2015</strong>E CPI <strong>2015</strong>E CPI<br />
Urban Urban<br />
Prob- <strong>Inflation</strong> <strong>Inflation</strong><br />
ability Growth Est. CAGR%<br />
Status Quo 15.0% x 1.0% = 0.2%<br />
Sharply Higher World GDP Growth, Some Warfare 60.0% x 5.0% = 3.0%<br />
Major Middle East War 25.0% x 9.0% = 2.2%<br />
Sum or Average 100.0% nmf 5.4%<br />
Source: Legg Mason estimates and format
Industrial Portfolio Strategy<br />
<strong>The</strong> <strong>Inflation</strong> <strong>Cycle</strong> <strong>of</strong> <strong>2002</strong> <strong>to</strong> <strong>2015</strong> ⎯ April 19, <strong>2002</strong> -26- Legg Mason Wood Walker, Inc.<br />
Scenario (1) Continued Deflation, the U.S. Equity Bull Market, and<br />
Strong “Tech” Capital Spending: Probability: 15%<br />
Continued Deflation?<br />
To gauge the potential for continued deflation, a corners<strong>to</strong>ne <strong>of</strong> the status quo and a negative for Caterpillar,<br />
Deere and Joy Global, in our view, we highlight the following five issues.<br />
(1) <strong>The</strong> his<strong>to</strong>rical parallels in monetary policy his<strong>to</strong>ry.<br />
(2) Money supply growth and deteriorating velocity as precursors <strong>of</strong> inflation.<br />
(3) <strong>The</strong> outlook for domestic productivity as an <strong>of</strong>fset <strong>to</strong> loose monetary policy.<br />
(4) <strong>The</strong> outlook for productivity improvement overseas that affects U.S. competitiveness.<br />
(5) <strong>The</strong> commodity price sensitivity <strong>of</strong> the U.S. economy.<br />
<strong>The</strong> His<strong>to</strong>rical Parallels in Monetary Policy His<strong>to</strong>ry<br />
To frame the issue in a his<strong>to</strong>rical context, in Appendix A we provide a brief review <strong>of</strong> the 20th<br />
century monetary his<strong>to</strong>ry <strong>of</strong> the United States, which we believe shows several parallels <strong>to</strong> current<br />
events. Although no two cycles are exactly alike, as Mark Twain said, they do rhyme. <strong>The</strong> following are examples.<br />
• All <strong>of</strong> the major “hot” or economic wars <strong>of</strong> the past century were preceded by high growth in reserve<br />
currencies. This was the case with gold supplies before World War I, the U.S. dollar and the U.<br />
K. pound in the 1930s as the world struggled <strong>to</strong> shake <strong>of</strong>f the Great Depression, and during the 1960s<br />
and 1970s as the U.S. pursued a “guns and butter” policy <strong>of</strong> domestic spending and foreign war, but<br />
was ultimately roiled by the economic warfare <strong>of</strong> the OPEC oil embargoes.<br />
• <strong>The</strong> type <strong>of</strong> asset bubble that bursts has been a reliable predic<strong>to</strong>r <strong>of</strong> the future inflation or deflation<br />
cycle, and the future potential <strong>of</strong> warfare. <strong>The</strong> asset price inflation/deflation phenomenon has<br />
been repeated several times, with commodity price bubbles occurring and then bursting after wars and<br />
before deflation, and equity price bubbles occurring and then bursting after peace and before inflation.<br />
Examining the decades, bubbles burst for commodities around 1920, 1950 and 1980, and for s<strong>to</strong>cks<br />
around 1909, 1929, 1968, and 2000.<br />
• <strong>The</strong> Fed places the support <strong>of</strong> war and/or avoidance <strong>of</strong> panic ahead <strong>of</strong> price stability in its mission,<br />
a point that is sometimes lost on inves<strong>to</strong>rs since wars and panics are separated by long intervals.<br />
When war arrives, dollars are furnished <strong>to</strong> the strained financial system. <strong>The</strong> aggressive response by the<br />
current Fed <strong>to</strong> recent world crises stems from a desire not <strong>to</strong> repeat past mistakes caused by Fed lethargy,<br />
or <strong>to</strong> be caught in a liquidity trap that renders the Fed impotent, in our view.<br />
• Also sparking inflation, his<strong>to</strong>ry shows that reserve currency devaluation has been employed as a<br />
policy <strong>to</strong>ol. In 1933, President Roosevelt devalued the dollar versus gold <strong>to</strong> escape from the Great Depression.<br />
In 1971, President Nixon abandoned the Bret<strong>to</strong>n Woods Agreement. In the modern period <strong>of</strong>
Industrial Portfolio Strategy<br />
<strong>The</strong> <strong>Inflation</strong> <strong>Cycle</strong> <strong>of</strong> <strong>2002</strong> <strong>to</strong> <strong>2015</strong> ⎯ April 19, <strong>2002</strong> -27- Legg Mason Wood Walker, Inc.<br />
currency “blocs,” perhaps the competitive devaluation <strong>of</strong> the European euro, Japanese yen, Brazilian<br />
real and Argentine peso mark a return <strong>to</strong> economic unilateralism, since we believe those countries seem<br />
unwilling <strong>to</strong> make structural adjustments and thus avoid devaluation. Is the U.S. dollar next?<br />
• Social costs are again on the rise, and inflation expectations are low, reminiscent <strong>of</strong> the 1960s. <strong>The</strong><br />
“Great Society” <strong>of</strong> President Johnson proved more costly than expected, and we believe that the aging<br />
<strong>of</strong> the baby boomer generation may eclipse the cost <strong>of</strong> the Great Society. U.S. government forecasts for<br />
medical price inflation are below what recent trends would indicate, and government CPI inflation projections<br />
are below what his<strong>to</strong>rical precedent would suggest. Also, 70% <strong>of</strong> federal debt matures by February<br />
28, 2007, heightening the financing roll-over rate risk, in our view.<br />
• Open-ended wars like the current War on Terrorism and Vietnam have a meaningful inflation<br />
impact. In his Third Law <strong>of</strong> Motion, Sir Isaac New<strong>to</strong>n said "For every action, there is an equal and<br />
opposite reaction.” We believe that the downward force applied <strong>to</strong> the Persian Gulf as a result <strong>of</strong> oil deflation<br />
may lead <strong>to</strong> an upward explosion <strong>of</strong> war, fueled by the recruitment <strong>of</strong> young, disenfranched male<br />
populations by radical leaders making a bid for power. In past wars, we observe that the seeds <strong>of</strong> the<br />
future conflict were planted a decade or more before the outbreak <strong>of</strong> hostilities.<br />
Money Supply Growth and Deteriorating Velocity as Precursors <strong>of</strong> <strong>Inflation</strong><br />
Excessive monetary growth relative <strong>to</strong> GDP growth has his<strong>to</strong>rically been inflationary. In Exhibit 18,<br />
we compare U.S. M2 money supply growth <strong>to</strong> consumer price inflation, with annual data for the period<br />
1870 <strong>to</strong> 2001 used <strong>to</strong> calculate 10-year moving averages. We use M2, which required some reconstruction<br />
prior <strong>to</strong> 1959, as a compromise between narrow M1 and broad M3. Although the charts show a close relationship<br />
between money supply and inflation, what matters is the rate <strong>of</strong> growth <strong>of</strong> money relative <strong>to</strong> GDP<br />
(GNP prior <strong>to</strong> 1947), which is the velocity equation. Money supply growth has his<strong>to</strong>rically turned inflationary<br />
when the rate <strong>of</strong> expansion exceeded real GDP for a prolonged period, and in Exhibit 19, we show velocity<br />
versus inflation turning up in recent years (note that we rearrange the velocity formula <strong>to</strong> be M2 divided<br />
by real GDP). In Exhibit 20, we take a closer look at the upturn in M2 growth relative <strong>to</strong> GDP in the<br />
past few decades, and note that the rise in money supply relative <strong>to</strong> GDP began in 1994, at the same time<br />
the second leg <strong>of</strong> the 1990s bull market began, which we do not believe is coincidental. Our view is that<br />
money supply growth initially provides an aura <strong>of</strong> prosperity, but comes home <strong>to</strong> roost via higher inflation.<br />
Money supply growth was instrumental in facilitating the 1990s’ consumer spending and corporate<br />
capital spending surge that was funded, in large part, by debt and equity <strong>of</strong>ferings in the case <strong>of</strong> corporations,<br />
and balance sheet inflation and low-cost credit in the case <strong>of</strong> consumers. <strong>The</strong> surge in money supply<br />
required safety valves <strong>to</strong> mitigate the inflation impact, and two <strong>of</strong> those valves were labor productivity and<br />
tight fiscal policy. We discuss productivity later in this section, for which the news may be favorable in the<br />
near term, in our view. But on the subject <strong>of</strong> fiscal policy, we believe that the brief U.S. federal budget surplus<br />
<strong>of</strong> former President Clin<strong>to</strong>n’s second term provided the fiscal cover (surplus = tight fiscal policy, and<br />
deficit = loose fiscal policy) that gave the Fed some room <strong>to</strong> pursue an expansionary monetary policy. But<br />
with the rapidly eroding fiscal discipline in Washing<strong>to</strong>n, D.C., the War On Terrorism (and possibly Iraq’s<br />
political leadership), as well as the mounting Medicare and Social Security burden on society, we would<br />
contend that we have seen the end <strong>of</strong> federal budget surpluses for the foreseeable future.
Industrial Portfolio Strategy<br />
<strong>The</strong> <strong>Inflation</strong> <strong>Cycle</strong> <strong>of</strong> <strong>2002</strong> <strong>to</strong> <strong>2015</strong> ⎯ April 19, <strong>2002</strong> -28- Legg Mason Wood Walker, Inc.<br />
Exhibit 18 – M2 Money Supply Vs. Consumer <strong>Inflation</strong>, 10-Year Moving Avg., 1880 <strong>to</strong> 2001<br />
12.0%<br />
10.0%<br />
Money supply growth and inflation are inexorably linked.<br />
10.0%<br />
8.0%<br />
M2 Y/Y % Growth<br />
8.0%<br />
6.0%<br />
4.0%<br />
2.0%<br />
0.0%<br />
U.S. Federal<br />
Reserve Act <strong>of</strong> 1913<br />
Too much money<br />
supply?<br />
6.0%<br />
4.0%<br />
2.0%<br />
0.0%<br />
-2.0%<br />
-4.0%<br />
1880<br />
1890<br />
1900<br />
1910<br />
1920<br />
1930<br />
CPI <strong>Inflation</strong> Rate<br />
1940<br />
1950<br />
1960<br />
1970<br />
1980<br />
1990<br />
2000<br />
M2 Money Supply, 10-Yr. Moving Avg. <strong>of</strong> y/y % Growth, (Left axis)<br />
U.S. CPI <strong>Inflation</strong>, 10-Yr. Moving Avg. <strong>of</strong> y/y % Growth (Right axis)<br />
Source: National Bureau <strong>of</strong> Economic Research macroeconomic database, U.S. Federal Reserve for M2 1970 <strong>to</strong> present, for M2 prior<br />
<strong>to</strong> 1970 we add M1 + time deposits in banks + bank vault cash + monetary gold s<strong>to</strong>ck + mutual savings bank deposits + S&L deposits<br />
as provided in the U.S. Census publication “His<strong>to</strong>rical Statistics <strong>of</strong> the United States, Colonial Times <strong>to</strong> 1970”<br />
Exhibit 19 – M2 Velocity Versus Consumer <strong>Inflation</strong>, 10-Year Moving Average, 1880 <strong>to</strong> 2001<br />
8.0%<br />
We believe the upturn in M2relative <strong>to</strong> real GDP growth (Left axis, green)<br />
is a catalyst for rising CPI inflation (Right axis, red)<br />
10.0%<br />
6.0%<br />
8.0%<br />
M2 / Real GDP, Y/Y%<br />
4.0%<br />
2.0%<br />
0.0%<br />
-2.0%<br />
6.0%<br />
4.0%<br />
2.0%<br />
0.0%<br />
CPI <strong>Inflation</strong> Rate<br />
-4.0%<br />
-6.0%<br />
1880<br />
1890<br />
1900<br />
1910<br />
1920<br />
1930<br />
1940<br />
1950<br />
1960<br />
1970<br />
1980<br />
1990<br />
2000<br />
Too much money supply<br />
relative <strong>to</strong> GDP?<br />
-2.0%<br />
-4.0%<br />
M2 Divided by Real GDP, y/y% Chg., 10-Yr. Moving Avg., (Left)<br />
U.S. CPI <strong>Inflation</strong> 10-Yr. Moving Avg. <strong>of</strong> y/y % Growth (Right)<br />
Source: Note that we use GDP data from 1947 <strong>to</strong> present, and U.S. GNP 1870 <strong>to</strong> 1946, U.S. Department <strong>of</strong> Commerce, Standard &<br />
Poor’s Corporation, National Bureau <strong>of</strong> Economic Research macroeconomic database, U.S. Federal Reserve for M2 1970 <strong>to</strong> present,<br />
for M2 prior <strong>to</strong> 1970 we add M1 + time deposits in banks + bank vault cash + monetary gold s<strong>to</strong>ck + mutual savings bank deposits +<br />
S&L deposits as provided in the U.S. Census publication “His<strong>to</strong>rical Statistics <strong>of</strong> the United States, Colonial Times <strong>to</strong> 1970”
Industrial Portfolio Strategy<br />
<strong>The</strong> <strong>Inflation</strong> <strong>Cycle</strong> <strong>of</strong> <strong>2002</strong> <strong>to</strong> <strong>2015</strong> ⎯ April 19, <strong>2002</strong> -29- Legg Mason Wood Walker, Inc.<br />
Exhibit 20 – M2 Velocity Versus CPI <strong>Inflation</strong>, 1960 <strong>to</strong> 2001<br />
16.0%<br />
14.0%<br />
12.0%<br />
M2 growth is back <strong>to</strong> the 1960s<br />
<strong>to</strong> 1970s level. Future inflation<br />
trouble?<br />
10.0%<br />
8.0%<br />
6.0%<br />
4.0%<br />
2.0%<br />
0.0%<br />
-2.0%<br />
-4.0%<br />
Mar-60<br />
Mar-62<br />
Mar-64<br />
Mar-66<br />
Mar-68<br />
Mar-70<br />
Mar-72<br />
Mar-74<br />
Mar-76<br />
Mar-78<br />
Mar-80<br />
Mar-82<br />
Mar-84<br />
Mar-86<br />
Mar-88<br />
Mar-90<br />
Mar-92<br />
Mar-94<br />
Mar-96<br />
Mar-98<br />
Mar-00<br />
M2 money supply, SA, y/y% change<br />
CPI Urban inflation, all items, y/y% change<br />
Real U.S. GDP, y/y% change<br />
Source: U.S. Dept. <strong>of</strong> Commerce, U.S. Bureau <strong>of</strong> the Census, U.S. Federal Reserve<br />
Although inves<strong>to</strong>rs have benefited from the 1990s’ monetary policy, we would not confuse benefit<br />
with benevolence. As an <strong>of</strong>fset <strong>to</strong> inflation, we do expect a cyclical bounce in productivity in the next few<br />
years, as the demographics that support labor productivity are now at their zenith, in our view. Later, however,<br />
if productivity loses momentum as we expect, prompting unit labor costs <strong>to</strong> climb, we ask rhe<strong>to</strong>rically<br />
“Will the Fed tighten and risk bringing lingering balance sheet problems <strong>to</strong> the fore, possibly laying waste<br />
<strong>to</strong> a leveraged global financial system?” We do not think so. Despite a rise in liquidity preferences, asset<br />
inflation and debt are less fleeting, in our view, and we know <strong>of</strong> no example in which prolonged money<br />
supply growth above the rate <strong>of</strong> GDP expansion, or borrowing based on inflated assets, did not invite<br />
financial difficulties and, as a response, Fed over-accommodation that reduces real equity values.<br />
<strong>The</strong> Outlook for Domestic Productivity as An Offset To Loose Monetary Policy<br />
<strong>The</strong> outlook for domestic productivity as an <strong>of</strong>fset <strong>to</strong> loose monetary policy is favorable, in our view,<br />
but may be peaking in terms <strong>of</strong> beneficial impact in the next few years. Productivity quantifies output<br />
per hour, and if a case can be made for exceptionally strong real GDP growth via productivity and/or labor<br />
force expansion, inflation may be kept at bay. Taking a longer view, employers in the next decade may be<br />
forced <strong>to</strong> pay more for workers, health benefits packages, and the commodity inputs <strong>to</strong> cost <strong>of</strong> goods sold,<br />
which has the effect <strong>of</strong> squeezing pr<strong>of</strong>it margins unless prices and/or productivity can be raised <strong>to</strong> <strong>of</strong>fset the<br />
pressure. In Exhibit 21, we show U.S. productivity growth in relation <strong>to</strong> the experience pr<strong>of</strong>ile <strong>of</strong> the U.S.
Industrial Portfolio Strategy<br />
<strong>The</strong> <strong>Inflation</strong> <strong>Cycle</strong> <strong>of</strong> <strong>2002</strong> <strong>to</strong> <strong>2015</strong> ⎯ April 19, <strong>2002</strong> -30- Legg Mason Wood Walker, Inc.<br />
work force. <strong>The</strong> huge influx <strong>of</strong> young and less experienced people joining the U.S. work force in the 1970s<br />
contributed <strong>to</strong> low productivity, as well as the political expediency <strong>of</strong> higher inflation for the purposes <strong>of</strong> job<br />
creation, in our view. <strong>The</strong> subsequent rebound <strong>of</strong> older, more experienced workers relative <strong>to</strong> young people<br />
since 1981 has boosted productivity, but that is nearing a peak, as Exhibit 21 shows. Perhaps it is the glacial<br />
pace at which demographic changes progress that causes population trends <strong>to</strong> be downplayed as a key driver<br />
<strong>of</strong> productivity. But if human capital is related <strong>to</strong> human experience, then it follows that human capital is cumulative,<br />
net <strong>of</strong> deletions (the retirement or death rate). As a result, our view is that human experience is the<br />
base from which productivity grows. Furthermore, we believe that the age 35 <strong>to</strong> 49 group forms the heart <strong>of</strong><br />
the economy <strong>of</strong> any country, since they tend <strong>to</strong> invest in homes, families, and retirement savings. Our outlook<br />
calls for the level <strong>of</strong> productivity growth <strong>to</strong> be favorable in the next few years, but then slow appreciably<br />
as demographic headwinds emerge.<br />
Exhibit 21 – U.S. Productivity Growth Versus Demographic Measures: <strong>The</strong> Ratio <strong>of</strong> Experienced<br />
Workers <strong>to</strong> Less Experienced Workers as a Driver For U.S. Productivity Growth<br />
1.25x<br />
1961 age<br />
wave<br />
peak and<br />
productivity peak<br />
2001 age wave peak<br />
4.5%<br />
4.0%<br />
3.5%<br />
Ratio <strong>of</strong> 35 - 49 <strong>to</strong> 20 - 34 Year Olds<br />
1.00x<br />
0.75x<br />
Three-year centered<br />
average<br />
through 12/31/01<br />
U.S. Census<br />
Bureau population<br />
estimates <strong>2002</strong> <strong>to</strong> 2020<br />
3.0%<br />
2.5%<br />
2.0%<br />
1.5%<br />
1.0%<br />
0.5%<br />
0.50x<br />
Dec-48<br />
Dec-53<br />
Dec-58<br />
Dec-63<br />
Dec-68<br />
Dec-73<br />
Dec-78<br />
Dec-83<br />
Dec-88<br />
U.S. Productivity Growth<br />
Dec-93<br />
Dec-98<br />
Dec-03<br />
Dec-08<br />
Dec-13<br />
Dec-18<br />
1981 = age wave<br />
trough and<br />
productivity trough<br />
0.0%<br />
-0.5%<br />
U.S. Ratio <strong>of</strong> Experienced People Age 35-49 To Less Experienced People Age 20-34 (Left axis)<br />
Nonfarm Business Output Per Hour y/y % Change 3-Year Centered Avg. (Right axis)<br />
Source: U.S. Bureau <strong>of</strong> Labor Statistics, U.S. Bureau <strong>of</strong> the Census<br />
<strong>The</strong> Outlook for Productivity Improvement Overseas That Affects U.S. Competitiveness<br />
On an international basis, the demographics <strong>of</strong> productivity have implications for inflation cycles, pr<strong>of</strong>its<br />
growth and thus, s<strong>to</strong>ck market performance. As we show in Exhibit 22, both Japan and the United<br />
States began <strong>to</strong> show strong economic gains and robust s<strong>to</strong>ck markets at precisely the same time that the ratio<br />
<strong>of</strong> 35–49 year olds <strong>to</strong> 20–34 year olds began <strong>to</strong> rise rapidly. Japan’s postwar baby boom crested 10 years be-
Industrial Portfolio Strategy<br />
<strong>The</strong> <strong>Inflation</strong> <strong>Cycle</strong> <strong>of</strong> <strong>2002</strong> <strong>to</strong> <strong>2015</strong> ⎯ April 19, <strong>2002</strong> -31- Legg Mason Wood Walker, Inc.<br />
fore that <strong>of</strong> the United States, and peaked around 1990, which was the same year that the Nikkei s<strong>to</strong>ck index<br />
peaked. Since that time, Japan’s economy has had the twin demographic burdens <strong>of</strong> a rising retiree population<br />
and the absorption <strong>of</strong> a second wave <strong>of</strong> younger workers in<strong>to</strong> the economy. Currently, we believe most<br />
inves<strong>to</strong>rs focus on Japan’s large retiree population. But on an optimistic note, we observe that the ratio <strong>of</strong><br />
older and presumably more productive workers <strong>to</strong> younger and presumably less productive workers in Japan<br />
is projected <strong>to</strong> bot<strong>to</strong>m in <strong>2002</strong> and rise through 2019, perhaps signaling that a demographic corners<strong>to</strong>ne is<br />
in place <strong>to</strong> help bring Japan back from the economic brink. In contrast, as Exhibit 22 shows, the U.S. demographic<br />
situation in the period <strong>to</strong> <strong>2015</strong> emerges as a headwind, by this measure. Although we expect the<br />
situation <strong>to</strong> be less severe than the Japanese experience <strong>of</strong> the 1990s, or the U.S. experience <strong>of</strong> the late<br />
1960s <strong>to</strong> early 1980s, the implication is clear <strong>to</strong> us: the need <strong>to</strong> absorb a wave <strong>of</strong> young workers in<strong>to</strong> the<br />
economy at the same time that the most experienced hands are preparing for retirement has his<strong>to</strong>rically not<br />
been a recipe for strong economic or s<strong>to</strong>ck price performance.<br />
Also on the subject <strong>of</strong> rising powers, we observe in Exhibit 22 that China already has entered a favorable,<br />
rising demographic tide <strong>of</strong> mature workers relative <strong>to</strong> younger workers. China’s great baby boom did<br />
not occur until 1963–1975, due <strong>to</strong> the postwar shocks <strong>of</strong> the 1949 revolution and the severe 1959–1962<br />
famine. <strong>The</strong> period from the beginning <strong>of</strong> famine recovery in 1963 <strong>to</strong> the widespread implementation <strong>of</strong><br />
family planning in the early 1970s created a baby boom in China, and by 2012 the U.S. Census Bureau proj-<br />
Exhibit 22 – Comparative Demographic Trends That We Believe Shape Productivity, the Ratio<br />
<strong>of</strong> 35-49 Year Olds <strong>to</strong> 20-34 Year Olds, China, Japan and the U.S., 1950 <strong>to</strong> 2050E<br />
Ratio 35-49 Year Olds <strong>to</strong> 20-34 Year Olds<br />
150%<br />
140%<br />
130%<br />
120%<br />
110%<br />
100%<br />
90%<br />
80%<br />
70%<br />
60%<br />
50%<br />
Nikkei 225 and<br />
Japan age wave<br />
peak (1990)<br />
DJIA and U.S. age<br />
wave bot<strong>to</strong>m (1982)<br />
DJIA and U.S.<br />
age wave peak<br />
(2000)<br />
Japan rebounds?<br />
U.S. Census Bureau Projections<br />
China markets<br />
strong through <strong>2015</strong>?<br />
1950<br />
1960<br />
1970<br />
1980<br />
1990<br />
2000<br />
2010<br />
2020<br />
2030<br />
2040<br />
2050<br />
Japan United States China<br />
Source: U.S. Bureau <strong>of</strong> the Census., Bureau <strong>of</strong> the Census International Database
Industrial Portfolio Strategy<br />
<strong>The</strong> <strong>Inflation</strong> <strong>Cycle</strong> <strong>of</strong> <strong>2002</strong> <strong>to</strong> <strong>2015</strong> ⎯ April 19, <strong>2002</strong> -32- Legg Mason Wood Walker, Inc.<br />
ects that China will have 349 million people aged 35 <strong>to</strong> 49. In addition <strong>to</strong> economic growth implications, we<br />
believe that China is a developing country with a greater propensity <strong>to</strong> consume raw materials and foreign<br />
capital. This situation may aggravate the U.S. current account deficit in the coming years by reducing the<br />
succor provided by the capital account surplus, and weakening the U.S. dollar, in our view.<br />
<strong>The</strong> Commodity <strong>Price</strong> Sensitivity <strong>of</strong> the U.S. Economy<br />
<strong>The</strong> commodity price sensitivity <strong>of</strong> the U.S. economy may be greater than most inves<strong>to</strong>rs expect, even<br />
though energy usage as a percentage <strong>of</strong> U.S. GDP declined from 14% in 1978 <strong>to</strong> only 6% in 1999, as shown<br />
in Exhibit 23. We discuss the energy price outlook later in this report, but our focus in this section is the inflation<br />
consequences <strong>of</strong> higher domestic energy costs. According <strong>to</strong> Energy Information Administration<br />
(EIA) data, energy consumption (measured in British <strong>The</strong>rmal Units) per dollar <strong>of</strong> real GDP (1996 dollars)<br />
fell from 18.1 Btu in 1974 <strong>to</strong> 13.0 Btu in 1987, a decline <strong>of</strong> 28% that was prompted by the oil price inflation<br />
<strong>of</strong> that era, with the cus<strong>to</strong>mary lag for conservation programs already in place. From 1987 <strong>to</strong> 2000, however,<br />
the decline was from 13.0 Btu <strong>to</strong> 10.6 Btu, or just 18%, with two-thirds <strong>of</strong> the drop occurring in the<br />
1996 <strong>to</strong> 2000 period, when GDP was stimulated by a consumer and capital markets bubble, in our view.<br />
This trend is evident in the <strong>to</strong>ols <strong>of</strong> day-<strong>to</strong>-day life. For example, by 1985, a new U.S. refrigera<strong>to</strong>r used only<br />
54% <strong>of</strong> the electricity <strong>of</strong> one in 1972, and the average new car in 1981 was 65% more fuel-efficient than<br />
one in 1970. Even as fuel prices began <strong>to</strong> fall after 1981, the continued penetration <strong>of</strong> long-lead-time technologies<br />
kept downward pressure on energy consumption, until prolonged, low energy prices removed a<br />
good portion <strong>of</strong> the economic motivation <strong>to</strong> conserve and locate new energy sources. We make the following<br />
four observations about energy intensity and the importance <strong>of</strong> low energy prices <strong>to</strong> U.S. GDP growth.<br />
• Although the amount <strong>of</strong> petroleum<br />
used in the U.S. economy has declined,<br />
the types <strong>of</strong> uses are a<br />
more important fac<strong>to</strong>r, in our<br />
view. For example, transportation<br />
consumed 53% <strong>of</strong> all petroleum<br />
supplied in the U.S. in 1978, but<br />
in 2000 that proportion was 67%.<br />
Oil demand in the U.S. may therefore<br />
be more inelastic now than it<br />
was in the late 1970s, which<br />
means that the price <strong>of</strong> energy has<br />
more impact than a simplistic “oil<br />
intensity <strong>of</strong> GDP” analysis would<br />
imply.<br />
Exhibit 23 – U.S. end-use energy as a percentage <strong>of</strong> GDP<br />
14%<br />
12%<br />
10%<br />
8%<br />
6%<br />
4%<br />
2%<br />
• Most readers are aware <strong>of</strong> the<br />
popularity <strong>of</strong> large sport utility<br />
vehicles and vans. In the earlier<br />
era, U.S. mo<strong>to</strong>r vehicle fuel efficiency<br />
bot<strong>to</strong>med in 1973 at 11.9 Source: EIA for energy expenditures, BEA for GDP figures<br />
0%<br />
1970<br />
1972<br />
1974<br />
1976<br />
1978<br />
1980<br />
1982<br />
1984<br />
1986<br />
1988<br />
1990<br />
1992<br />
1994<br />
1996<br />
Coal/Other Gas Electricity Oil<br />
1998
Industrial Portfolio Strategy<br />
<strong>The</strong> <strong>Inflation</strong> <strong>Cycle</strong> <strong>of</strong> <strong>2002</strong> <strong>to</strong> <strong>2015</strong> ⎯ April 19, <strong>2002</strong> -33- Legg Mason Wood Walker, Inc.<br />
miles per gallon, after a decline <strong>of</strong> over three decades, and the U.S. consumer was ill-prepared for the<br />
1973–1974 OPEC oil embargo. In the current period, despite a 1.2% annual rise in average U.S. vehicle<br />
fuel efficiency from 1981 <strong>to</strong> 2000, the mileage <strong>of</strong> new U.S. light vehicles hit a 20-year low in 2001 due<br />
mainly <strong>to</strong> the substitution <strong>of</strong> light trucks for cars. In our view, this is indicative <strong>of</strong> a U.S. consumer that<br />
is ill-prepared for higher fuel prices.<br />
• <strong>The</strong> energy intensity <strong>of</strong> GDP did not decline as much after energy prices went in<strong>to</strong> free fall in the<br />
1980s. We believe that the reason was a reduction <strong>of</strong> the market imperative for conservation, alternative<br />
energy development, or new oil and gas exploration and development. Our view is that it will take several<br />
years for the marketplace <strong>to</strong> react in a meaningful way <strong>to</strong> a sudden and steady rise in energy costs<br />
in the future, having experienced only deflation with occasional price spikes since 1981.<br />
• <strong>The</strong> U.S. merchandise trade deficit as a percentage <strong>of</strong> GDP has expanded from approximately neutral in<br />
3Q 1980 <strong>to</strong> minus 2.9% <strong>of</strong> GDP as <strong>of</strong> 3Q 2001. Since oil is priced in U.S. dollars, and imports <strong>of</strong> goods<br />
from developing countries <strong>of</strong>ten require more energy in their manufacture, we would expect a rise in<br />
energy costs <strong>to</strong> produce broad-based import price inflation.<br />
<strong>The</strong> effect <strong>of</strong> rising energy prices does not always show up in standard U.S. economic releases. In Exhibit<br />
24 we show that the average size <strong>of</strong> U.S. single-family homes has increased almost one-third since energy<br />
costs began <strong>to</strong> plummet in the early 1980s. U.S. demographics led <strong>to</strong> a need for larger homes, but we<br />
believe cheap energy made it possible <strong>to</strong> afford those residences, and with large homes <strong>to</strong> heat and cool, we<br />
reiterate that energy demand in the U.S. may be more inelastic now than it was in the late 1970s.<br />
Exhibit 24 – U.S. Home Size Versus Energy Costs<br />
105<br />
2,300<br />
Residential energy prices (1983=100)<br />
95<br />
85<br />
75<br />
65<br />
55<br />
Demographics made larger homes<br />
desirable, but cheap energy made<br />
larger homes possible, in our view.<br />
2,100<br />
1,900<br />
1,700<br />
45<br />
1970<br />
1972<br />
1974<br />
1976<br />
1978<br />
1980<br />
1982<br />
1984<br />
1986<br />
1988<br />
1990<br />
1992<br />
1994<br />
1996<br />
1998<br />
2000<br />
New U.S. Sing. Fam. Home Size (sq. ft.)<br />
1,500<br />
Residential natural gas price (1983=100, left axis)<br />
Average size <strong>of</strong> new U.S. single-family homes (right axis)<br />
Residential electricity price per kWh (1983=100, left axis)<br />
Source: EIA
Industrial Portfolio Strategy<br />
<strong>The</strong> <strong>Inflation</strong> <strong>Cycle</strong> <strong>of</strong> <strong>2002</strong> <strong>to</strong> <strong>2015</strong> ⎯ April 19, <strong>2002</strong> -34- Legg Mason Wood Walker, Inc.<br />
Given that Western energy demand is mature, we show in Exhibit 25 the way in which energy use<br />
and weather are linked in the long term. <strong>The</strong> <strong>to</strong>p half <strong>of</strong> the exhibit shows that Northern Hemisphere<br />
temperatures rose in the 1880 <strong>to</strong> 1940 timeframe, fell from 1940 <strong>to</strong> the late 1970s, and have increased<br />
sharply since that time. <strong>The</strong> relationship is not tight, but below the temperature chart we show that warming<br />
trends produced low energy inflation, and for cold trends the effect is the opposite. A reversal <strong>of</strong> the twodecade<br />
trend <strong>of</strong> higher temperatures could be a catalyst for higher energy prices.<br />
Exhibit 25 – Long-Term Temperature Trends And Energy <strong>Price</strong> <strong>Inflation</strong><br />
N. Hemisphere Surface Temperatures,<br />
Degrees Celsius deviation from normal, 5-<br />
yr moving average<br />
0.8<br />
0.6<br />
0.4<br />
0.2<br />
0<br />
-0.2<br />
-0.4<br />
-0.6<br />
-0.8<br />
1880<br />
(1) Rising<br />
temperatures...<br />
1890<br />
1900<br />
1910<br />
1920<br />
1930<br />
1940<br />
(3) Falling<br />
temperatures...<br />
1950<br />
1960<br />
1970<br />
(5) Rising<br />
temperatures...<br />
1980<br />
1990<br />
2000<br />
PPI Fuels and Electric Power Index (2000<br />
= 100)<br />
100<br />
10<br />
1<br />
1880<br />
1890<br />
(2) …equals<br />
modest prices.<br />
1900<br />
1910<br />
1920<br />
1930<br />
1940<br />
(4) …equals<br />
rising prices.<br />
1950<br />
1960<br />
(6) …equals flat prices.<br />
1970<br />
1980<br />
1990<br />
2000<br />
Temperature source: http://co2science.org data from Jones, P.D., Parker, D.E., Osborn, T.J. and Briffa, K.R. 1999. Global and hemispheric<br />
temperature anomalies -- land and marine instrument records. In Trends: A Compendium <strong>of</strong> Data on Global Change. Carbon<br />
Dioxide Information Analysis Center, Oak Ridge National Labora<strong>to</strong>ry, U.S. Department <strong>of</strong> Energy, Oak Ridge, TN, USA. Data presented<br />
are the 5-year average <strong>of</strong> temperature deviations from the 1961-1990 average for latitudes 10 through 60 <strong>of</strong> the Northern Hemisphere<br />
(where most <strong>of</strong> the world's population and the vast majority <strong>of</strong> fuel consumption for heating purposes are located). PPI Fuels and Electric<br />
Power 1880 <strong>to</strong> 1889 Warren & Pearson study, 1890 <strong>to</strong> 1969 PPI is the shipment-weighted annual averages <strong>of</strong> monthly prices prepared<br />
by the U.S. BLS, 1970 <strong>to</strong> Present is the PPI Fuels and Electric Power (NSA), from the U.S. BLS; PPI index has been placed in a<br />
continuous reweighted series so that the 12-month average <strong>of</strong> 2000 = 100.
Industrial Portfolio Strategy<br />
<strong>The</strong> <strong>Inflation</strong> <strong>Cycle</strong> <strong>of</strong> <strong>2002</strong> <strong>to</strong> <strong>2015</strong> ⎯ April 19, <strong>2002</strong> -35- Legg Mason Wood Walker, Inc.<br />
Since inflation is relative, it follows that deflation is as well, so perhaps the net effect <strong>of</strong> commodity<br />
inflation will be pr<strong>of</strong>it margin compression if excess capacity constrains pricing power for the commodity<br />
end users. <strong>The</strong>re is currently a low level <strong>of</strong> capacity utilization in U.S. industry, and there is excess<br />
capacity in the consumer and manufacturing sec<strong>to</strong>rs. As a result, it is possible that strength in commodity<br />
markets could lead <strong>to</strong> pr<strong>of</strong>it margin compression rather than consumer price inflation. <strong>The</strong> way we describe<br />
this phenomenon is <strong>to</strong> think <strong>of</strong> the Producer <strong>Price</strong> Index as a large part <strong>of</strong> “cost <strong>of</strong> goods sold” in nonservice<br />
industries. <strong>The</strong> price at which those items are sold may influence the Consumer <strong>Price</strong> Index, but if a<br />
company is forced <strong>to</strong> pay more for its cost <strong>of</strong> goods sold, but receives little pricing relief as a result <strong>of</strong> excess<br />
capacity, then pr<strong>of</strong>it margins will suffer. Since inflation <strong>of</strong> corporate pr<strong>of</strong>its and P/E multiples were<br />
leading contribu<strong>to</strong>rs <strong>to</strong> the bull market that began in its various phases after the 1981 <strong>to</strong> 1982 recession, it<br />
follows that deflation <strong>of</strong> pr<strong>of</strong>it margins and thus common s<strong>to</strong>cks may be a natural “mean reversion” result<br />
<strong>of</strong> pricing power shifting from the CPI <strong>to</strong> the PPI. Although there has been a shake-out <strong>of</strong> capacity in<br />
many <strong>of</strong> Caterpillar, Deere and Joy Global’s markets, some <strong>of</strong> which is an ongoing process, we believe<br />
it is necessary <strong>to</strong> moni<strong>to</strong>r the potential for margin pressure if the companies pay more for inputs<br />
than their pricing power can <strong>of</strong>fset in the <strong>2002</strong> <strong>to</strong> <strong>2015</strong> period.<br />
Continuation <strong>of</strong> the Bull Market and Strong “Tech” Spending (?)<br />
To estimate the relative performance<br />
prospects for CAT and DE s<strong>to</strong>cks, we<br />
must first estimate the return <strong>of</strong> the<br />
S&P 500 benchmark. Based partly on<br />
the matrix in Exhibit 26, we see a mere<br />
4.4% annual price return for the S&P<br />
500 through <strong>2015</strong>, equal <strong>to</strong> a cumulative<br />
gain <strong>of</strong> 83% from the 2001 average price<br />
<strong>of</strong> $1,186 <strong>to</strong> a <strong>2015</strong> forecast level <strong>of</strong><br />
$2,173. To that price return we add the<br />
S&P 500 current dividend yield <strong>of</strong> 1.4%,<br />
<strong>to</strong> derive an approximate annual <strong>to</strong>tal<br />
return estimate <strong>of</strong> 5.8% for the period.<br />
With P/E ratios restrained or compressed<br />
by inflation, one <strong>of</strong> the best ways <strong>to</strong> outperform<br />
the S&P 500 may be <strong>to</strong> locate<br />
s<strong>to</strong>cks with consistent dividend growth<br />
and superior dividend yields. To address<br />
questions <strong>of</strong> whether a 4.4% price return<br />
forecast is realistic, we consider the two<br />
elements <strong>of</strong> price movement, which are<br />
EPS and the P/E. Since 1962, S&P 500<br />
Exhibit 26 – S&P Composite P/E Ratios And <strong>Inflation</strong><br />
Based On the Experience <strong>of</strong> the Period 1927 <strong>to</strong> 2001<br />
Consumer<br />
S&P 500 <strong>Price</strong><br />
LTM Avg. <strong>Inflation</strong><br />
Annual P/E Yrly. Avg.<br />
Ratio Y/Y%<br />
During deflation: Midpoint 14.9x -3.2%<br />
During inflation, in the following ranges:<br />
<strong>Inflation</strong> <strong>Inflation</strong> <strong>The</strong> Avg. And <strong>Inflation</strong><br />
From To P/E Was Averaged<br />
0.0% 1.9% 1.0% 16.2x 1.2%<br />
2.0% 3.9% 3.0% 18.3x 3.0%<br />
4.0% 5.9% 5.0% 14.6x 4.9%<br />
6.0% 7.9% 7.0% 11.0x 7.1%<br />
During high inflation, the following occurred:<br />
<strong>Inflation</strong><br />
Produced a And <strong>Inflation</strong><br />
Over P/E <strong>of</strong> Averaged<br />
8.0% + 9.2x 11.5%<br />
Source: Standard & Poor’s Corp.<br />
EPS have grown at an average year-over-year rate <strong>of</strong> 7.4%, and CPI inflation has averaged 4.7% in the same<br />
period, so real S&P 500 EPS growth has been 2.7% (7.4% minus 4.7%). Our view is that the CPI index<br />
from <strong>2002</strong> <strong>to</strong> <strong>2015</strong> will compound at a rate <strong>of</strong> 5.4% per annum (back-end loaded), so by adding the his<strong>to</strong>rical<br />
real (after inflation) EPS growth <strong>of</strong> 2.7% <strong>to</strong> 5.4% inflation we derive an estimate <strong>of</strong> nominal S&P 500<br />
EPS growth <strong>of</strong> 8.1% for the <strong>2002</strong> <strong>to</strong> <strong>2015</strong> period. Because <strong>of</strong> favorable near-term productivity trends, we
Industrial Portfolio Strategy<br />
<strong>The</strong> <strong>Inflation</strong> <strong>Cycle</strong> <strong>of</strong> <strong>2002</strong> <strong>to</strong> <strong>2015</strong> ⎯ April 19, <strong>2002</strong> -36- Legg Mason Wood Walker, Inc.<br />
decided <strong>to</strong> increase the S&P 500 nominal EPS growth forecast <strong>to</strong> 9.0%. To calculate potential S&P 500<br />
EPS in <strong>2015</strong>, we begin with the First Call consensus for <strong>2002</strong> “operating” EPS <strong>of</strong> $50.25, and grow that figure<br />
by 9% per year for 13 years, producing estimated S&P 500 EPS <strong>of</strong> $154 per unit in <strong>2015</strong>.<br />
Although $154 <strong>of</strong> S&P 500 EPS in <strong>2015</strong> sounds impressive, higher inflation produces a lower P/E, and<br />
in Exhibit 27 we show that if we expect inflation <strong>to</strong> range from approximately 6.4% <strong>to</strong> 7.9% in the 2010 <strong>to</strong><br />
<strong>2015</strong> period, the P/E normally associated with that level <strong>of</strong> inflation is 9.3x <strong>to</strong> 12.1x. In Exhibit 27, we combine<br />
our forecast for inflation and the P/E ratios associated with each level <strong>of</strong> inflation, and derive a hypothetical<br />
1927 <strong>to</strong> <strong>2015</strong>E S&P 500 P/E chart. A glance at that chart causes us <strong>to</strong> believe that our 4.4% S&P<br />
500 projected price return may be on the high side. Given that the chart implies an inflation-penalized P/E<br />
<strong>of</strong> only 11.2x for the S&P 500 in <strong>2015</strong>, and we have estimated EPS <strong>of</strong> $154, the hypothetical S&P 500<br />
would be only $1,725 in <strong>2015</strong>, well below the $2,173 implied by our matrix.<br />
<strong>The</strong> “New Economy” or “New Paradigm” thinking <strong>of</strong> the second half <strong>of</strong> the 1990s that we believe<br />
underpinned much <strong>of</strong> the inves<strong>to</strong>r exuberance in that period was not unprecedented. Even the creation<br />
<strong>of</strong> the Federal Reserve System in 1913 was hailed in the 1920s bull market (before the 1930s Great<br />
Depression) as the beginning <strong>of</strong> “New Era” economics that would remove the “boom and bust” cycle <strong>of</strong> the<br />
U.S. economy. When we look back on the characteristics and drivers <strong>of</strong> the “tech” s<strong>to</strong>ry <strong>of</strong> the 1990s, we<br />
believe that many <strong>of</strong> the catalysts are no longer present, since they were based on the following chain: (1)<br />
rising inflation-adjusted labor costs and real sales led businesses <strong>to</strong> ask “Can I raise prices?” or “Do I<br />
Exhibit 27 – S&P S<strong>to</strong>ck Market Composite Average Annual P/E, 1927 <strong>to</strong> <strong>2015</strong>(E)<br />
S&P Composite Average Annual P/E<br />
35x<br />
30x<br />
25x<br />
20x<br />
15x<br />
10x<br />
5x<br />
0x<br />
(3)<br />
Much has changed <strong>to</strong> affect comparability, but restraining<br />
upside may be the fact that the S&P 500 year 2001 average P/E<br />
<strong>of</strong> 26.3x is almost 50% above the"normal" P/E <strong>of</strong> 17.7x that is<br />
associated with <strong>2002</strong> inflation <strong>of</strong> only 2.4%.<br />
(1)<br />
<strong>The</strong> 2001 P/E<br />
<strong>of</strong> 26.3x is the<br />
2001 average<br />
S&P 500 price<br />
<strong>of</strong> $1,186<br />
divided by 2001<br />
S&P 500<br />
Operating EPS<br />
<strong>of</strong> $45.16A.<br />
(2)<br />
<strong>The</strong> fair value P/E <strong>of</strong> 17.7x for the S&P 500 in <strong>2002</strong> is based on a CPI inflation estimate <strong>of</strong> 2.4%, and the "normal" P/E<br />
associated with that level <strong>of</strong> his<strong>to</strong>rical inflation. Rising inflation from <strong>2002</strong> <strong>to</strong> a crest in 2013 <strong>of</strong> 7.9% produces the lower<br />
P/E ratios. As inflation abates in 2014 <strong>to</strong> <strong>2015</strong>, the P/E rebounds somewhat, as it has in past cycles.<br />
1927<br />
1930<br />
1933<br />
1936<br />
1939<br />
1942<br />
1945<br />
1948<br />
1951<br />
1954<br />
1957<br />
1960<br />
1963<br />
1966<br />
1969<br />
1972<br />
1975<br />
1978<br />
1981<br />
1984<br />
1987<br />
1990<br />
1993<br />
1996<br />
1999<br />
<strong>2002</strong>E<br />
2005E<br />
2008E<br />
2011E<br />
2014E<br />
Composite Average Annual P/E (Left)<br />
Source: Standard & Poor’s Corp., Legg Mason estimates for <strong>2002</strong> <strong>to</strong> <strong>2015</strong>
Industrial Portfolio Strategy<br />
<strong>The</strong> <strong>Inflation</strong> <strong>Cycle</strong> <strong>of</strong> <strong>2002</strong> <strong>to</strong> <strong>2015</strong> ⎯ April 19, <strong>2002</strong> -37- Legg Mason Wood Walker, Inc.<br />
substitute capital for labor <strong>to</strong> improve productivity?”; (2) central bank inflation vigilance increased the<br />
value <strong>of</strong> financial assets (claims on cash flow streams) by lowering interest rates; (3) the resulting bull<br />
market in capital lowered the cost <strong>of</strong> capital spending relative <strong>to</strong> labor; (4) a decline in pricing power<br />
(inflation) made the price option untenable or undesirable, and industries (technology, etc.) actually causing<br />
deflation were at the <strong>to</strong>p <strong>of</strong> the economic food chain; (5) government budget surpluses (tight fiscal policy)<br />
and rising productivity made loose monetary policy possible; (6) U.S. hegemony in the world after the Gulf<br />
War and the collapse <strong>of</strong> the Soviet Union boosted the U.S. dollar and encouraged domestic consumption;<br />
(7) the returns <strong>to</strong> capital increased in the U.S., attracting foreign capital, as well as more U.S. capital; (8)<br />
capital was reallocated from public <strong>to</strong> private hands; (9) private hands chose <strong>to</strong> spend while letting foreign<br />
capital substitute for the lack <strong>of</strong> domestic savings, and businesses chose <strong>to</strong> invest in productivity-enhancing<br />
technology; (10) <strong>to</strong>o much capital began <strong>to</strong> chase productivity-enhancing companies, and inves<strong>to</strong>rs became<br />
skittish as returns were diluted; (11) the NASDAQ and other markets that were dominated by companies<br />
selling productivity-enhancing wares fell sharply; and (12) capital costs rose as s<strong>to</strong>ck markets declined and<br />
bond market spreads widened. <strong>The</strong> virtuous circle previously described then went in<strong>to</strong> reverse.<br />
In our view, one <strong>of</strong> the<br />
greatest obstacles <strong>to</strong> a resumption<br />
<strong>of</strong> the capital expenditure<br />
growth rate <strong>of</strong> the<br />
second half <strong>of</strong> the 1990s is<br />
the poor state <strong>of</strong> the U.S. financing<br />
gap, shown in Exhibit<br />
28 as a percentage <strong>of</strong><br />
GDP. <strong>The</strong> financing gap<br />
measures the degree <strong>to</strong> which<br />
corporate capital spending<br />
exceeds or lags the sum <strong>of</strong><br />
internally generated funds<br />
plus the change in the value<br />
<strong>of</strong> inven<strong>to</strong>ries. Internally generated<br />
funds are further defined<br />
as after-tax pr<strong>of</strong>its minus<br />
dividends plus capital<br />
consumption, or, essentially,<br />
free cash flow before growthoriented<br />
capital spending. <strong>The</strong><br />
U.S. financing gap as a percentage<br />
<strong>of</strong> GDP reached a 20-<br />
year high <strong>of</strong> 3.0% in the third<br />
quarter <strong>of</strong> 2000. That was<br />
Exhibit 28 – U.S. Financing Gap, 1952 <strong>to</strong> Present<br />
4.0%<br />
3.5%<br />
3.0%<br />
2.5%<br />
2.0%<br />
1.5%<br />
1.0%<br />
0.5%<br />
0.0%<br />
-0.5%<br />
-1.0%<br />
-1.5%<br />
Dec-52<br />
<strong>The</strong> financing gap<br />
measures the amount by<br />
which capital expenditures<br />
exceed internally generated<br />
funds + inven<strong>to</strong>ry valuation<br />
changes.<br />
Dec-55<br />
Dec-58<br />
Dec-61<br />
Dec-64<br />
Source: U.S. Bureau <strong>of</strong> Labor Statistics, U.S. Bureau <strong>of</strong> the Census<br />
also the peak <strong>of</strong> the S&P 500 index, which is not coincidental, in our opinion. We believe that a resumption<br />
<strong>of</strong> robust technology capital spending growth faces two head winds in the near term: (1) difficult capital<br />
markets conditions and strained corporate balance sheets, and (2) overcapacity after years <strong>of</strong> exceptionally<br />
strong capital spending, which is not solved by more investment.<br />
Dec-67<br />
Dec-70<br />
Dec-73<br />
Dec-76<br />
Dec-79<br />
Dec-82<br />
Dec-85<br />
Dec-88<br />
Financing Gap % <strong>of</strong> GDP, 4-Qtr. Avg.<br />
A financing gap must be funded by<br />
capital markets activities such as<br />
borrowing or equity <strong>of</strong>ferings.<br />
Dec-91<br />
Dec-94<br />
Dec-97<br />
Dec-00
Industrial Portfolio Strategy<br />
<strong>The</strong> <strong>Inflation</strong> <strong>Cycle</strong> <strong>of</strong> <strong>2002</strong> <strong>to</strong> <strong>2015</strong> ⎯ April 19, <strong>2002</strong> -38- Legg Mason Wood Walker, Inc.<br />
<strong>The</strong> End Of <strong>The</strong> Status Quo?<br />
<strong>The</strong>re are signs that the status quo, as we have described it, has deteriorated in the past two years <strong>to</strong><br />
such a degree that its continuation is highly unlikely, in our view. <strong>Price</strong> inflation is an insidious and efficient<br />
destroyer <strong>of</strong> capital, and the ratio <strong>of</strong> the U.S. s<strong>to</strong>ck market <strong>to</strong> nominal GDP, which may be one way <strong>to</strong><br />
measure the over- or undercapitalization <strong>of</strong> the U.S. economy, turned down from a record level two years<br />
ago. In contrast, the inflation cycle inversely follows the ratio <strong>of</strong> s<strong>to</strong>ck market capitalization <strong>to</strong> nominal<br />
GDP, and we expect the new inflation regime <strong>to</strong> gradually come in<strong>to</strong> focus, becoming the “new” status quo<br />
late in the <strong>2002</strong> <strong>to</strong> <strong>2015</strong> period. Inves<strong>to</strong>rs have grown accus<strong>to</strong>med <strong>to</strong> the current status quo, which we’ve<br />
summarized as deflation via productivity growth, the U.S. equity bull market, and strong “tech” capital<br />
spending. As we have stated, we estimate the <strong>2002</strong> <strong>to</strong> <strong>2015</strong> period will feature 6.1% compound annual commodity<br />
inflation (back-end loaded in the period), 5.4% consumer price inflation (also back-end loaded), and<br />
a 4.4% annual price return for the U.S. s<strong>to</strong>ck market (with great volatility). <strong>The</strong>se percentages are based on<br />
the subtle changes in his<strong>to</strong>rical cycles that “rhyme” with what we believe are coming events. We feel confident<br />
that the probability <strong>of</strong> maintaining the status quo in the <strong>2002</strong> <strong>to</strong> <strong>2015</strong> period is only about 15%, if not<br />
lower. <strong>The</strong> next section examines our second scenario <strong>of</strong> rapid developing country modernization and<br />
global economic growth leading <strong>to</strong> a sustained and inflationary boom in commodity demand. <strong>The</strong> third<br />
probability scenario, which is one or more major Persian Gulf intra-country (civil) or cross-border conflicts<br />
that may constrict commodity supply for more prolonged periods, is discussed later in this report. Throughout<br />
this report we highlight the potential positive and negative aspects <strong>of</strong> this environment for Caterpillar,<br />
Deere and Joy Global.
Industrial Portfolio Strategy<br />
<strong>The</strong> <strong>Inflation</strong> <strong>Cycle</strong> <strong>of</strong> <strong>2002</strong> <strong>to</strong> <strong>2015</strong> ⎯ April 19, <strong>2002</strong> -39- Legg Mason Wood Walker, Inc.<br />
Scenario (2) Rapid Developing Country Modernization And Global Economic<br />
Growth Leading <strong>to</strong> a Sustained and <strong>Inflation</strong>ary Boom in Commodity<br />
Demand: Probability: 60%<br />
Will Surging Demand Create Peacetime Commodity <strong>Inflation</strong>?<br />
In a peacetime scenario, we believe that the U.S.’s need for sustainable growth <strong>to</strong> service its debts will<br />
require the creation <strong>of</strong> new markets <strong>to</strong> sell its goods and services, primarily in the developing world.<br />
In an unusual twist versus the his<strong>to</strong>rical norm <strong>of</strong> trade-based deflation, we believe that there is a 60% probability<br />
that the post-Communist, World Trade Organization-inspired, fertile mix <strong>of</strong> cheap labor, freeflowing<br />
capital, and technology transfer will create extraordinarily rapid global economic growth that<br />
places stresses on key raw material markets. Many raw materials producers have scaled back their internal<br />
investment as they have incurred poor returns since the previous inflation cycle, which ended approximately<br />
20 years ago. <strong>The</strong> combination <strong>of</strong> sustained, strong demand plus relatively inelastic supply, along with a<br />
Fed that remains somewhat accommodative as a result <strong>of</strong> the financial and political stresses discussed earlier,<br />
could spur a demand-led price inflation cycle in the <strong>2002</strong> <strong>to</strong> <strong>2015</strong> period.<br />
Change is difficult, but pain is the ultimate catalyst. In addition <strong>to</strong> the well-known U.S. propensity <strong>to</strong><br />
consume in excess <strong>of</strong> domestic savings (the current account deficit), and U.S. reliance on declining input<br />
costs (via falling commodity prices) <strong>to</strong> boost producer pr<strong>of</strong>its, we highlight in Exhibit 29 what we believe <strong>to</strong><br />
be a much more insidious problem, which is that incremental U.S. debt is no longer having the desired ef-<br />
Exhibit 29 – <strong>The</strong> Declining Ability Of Debt <strong>to</strong><br />
Underpin U.S. GDP Growth<br />
U.S. Total Debt / Nominal GDP<br />
3.0x<br />
2.5x<br />
2.0x<br />
1.5x<br />
1.0x<br />
0.5x<br />
<strong>Inflation</strong><br />
Deflation<br />
New GDP<br />
from new<br />
debt is<br />
declining.<br />
1962<br />
1965<br />
1968<br />
1971<br />
1974<br />
1977<br />
1980<br />
1983<br />
1986<br />
1989<br />
1992<br />
1995<br />
1998<br />
2001<br />
17.0%<br />
15.0%<br />
13.0%<br />
11.0%<br />
9.0%<br />
7.0%<br />
5.0%<br />
3.0%<br />
1.0%<br />
U.S. Total Debt Divided By Nominal GDP (Left)<br />
Y/Y Change U.S. Nominal GDP (Right)<br />
Source: U.S. Federal Reserve, U.S. Census, U.S. Department <strong>of</strong><br />
Commerce, Legg Mason format<br />
U.S. Nominal GDP Yr./Yr. % Change<br />
Exhibit 30 – Raw Materials Intensity At Different<br />
Stages <strong>of</strong> Economic Development<br />
Growth in Materials Consumption<br />
Minus Real GDP growth, 10-Yr. Avg.<br />
7%<br />
6%<br />
5%<br />
4%<br />
3%<br />
2%<br />
1%<br />
0%<br />
-1%<br />
-2%<br />
-3%<br />
-4%<br />
Emerging Economy<br />
Maturing Economy<br />
1910<br />
1915<br />
1920<br />
1925<br />
1930<br />
1935<br />
1940<br />
1945<br />
1950<br />
1955<br />
1960<br />
1965<br />
1970<br />
1975<br />
1980<br />
1985<br />
1990<br />
1995<br />
U.S. Raw Materials * Consumption Growth Minus U.S. Real GDP<br />
Growth, 10-Yr. Moving Avg.<br />
* Average <strong>of</strong> fuel, metals, other minerals, organics, paper.<br />
Sources: EIA; Department <strong>of</strong> Commerce; for pre-1947 period, GNP is<br />
used as a substitute for GDP; U.S. Geological Survey data materials<br />
data updated through 1998
Industrial Portfolio Strategy<br />
<strong>The</strong> <strong>Inflation</strong> <strong>Cycle</strong> <strong>of</strong> <strong>2002</strong> <strong>to</strong> <strong>2015</strong> ⎯ April 19, <strong>2002</strong> -40- Legg Mason Wood Walker, Inc.<br />
fect <strong>of</strong> producing meaningful incremental U.S. growth. <strong>The</strong> ratio <strong>of</strong> U.S. <strong>to</strong>tal debt <strong>to</strong> nominal GDP is rising<br />
sharply, but nominal GDP is falling just as quickly, and the only solutions we envision are a combination <strong>of</strong><br />
(global) growth, (moderate) inflation, and (private) default. From 1980 <strong>to</strong> the present, the U.S. ratio <strong>of</strong> aggregate<br />
debt <strong>to</strong> GDP has risen from 1.56x <strong>to</strong> 2.74x, and the growth rate <strong>of</strong> nominal GDP has fallen from<br />
8.9% <strong>to</strong> 3.4% in the same period. In order <strong>to</strong> grow the economy out <strong>of</strong> this situation, we expect U.S. business<br />
and policymakers <strong>to</strong> increasingly emphasize exports and foreign market development, but a side-effect<br />
<strong>of</strong> fostering strong emerging market growth is that it hyperstimulates raw materials usage. As Exhibit 30<br />
shows, the early stage <strong>of</strong> economic ascendancy, such as the U.S. enjoyed in the first half <strong>of</strong> the 20th century,<br />
is highly natural resources-intensive. As the emerging market per capita GDP bell curve shifts from<br />
left <strong>to</strong> right with growing income, the percentage change along the horizontal axis with respect <strong>to</strong> income is<br />
dwarfed by the number <strong>of</strong> new, materials-intensive consumers it creates in the area under the curve.<br />
<strong>The</strong>re were signs <strong>of</strong> this commodity intensity phenomenon prior <strong>to</strong> the Asia-Pacific Crisis, when many<br />
commodity prices rose in unison, and the s<strong>to</strong>cks <strong>of</strong> commodity-producing and -serving companies reflected<br />
the pricing prosperity. But as emerging economies fell like dominos, and commodity markets and related<br />
equities capitulated, the U.S. Fed turned more accommodative and global savings fled <strong>to</strong> the U.S., acting as<br />
a catalyst for the U.S. equity price bubble <strong>of</strong> the late 1990s. <strong>The</strong> subsequent collapse <strong>of</strong> U.S. equity indices<br />
that began in 2000 (earlier, if deteriorating breadth is counted), and the relative outperformance <strong>of</strong> many<br />
commodities and commodity-serving companies such as Caterpillar versus the broad s<strong>to</strong>ck market since that<br />
time, may foreshadow an inflationary turn in the price cycle. As we noted earlier in this report, bursting equity<br />
bubbles have preceded every major inflation (and war) <strong>of</strong> the past century, just as bursting commodity<br />
bubbles have preceded every major s<strong>to</strong>ck price inflation (i.e., bull market) for a century.<br />
<strong>The</strong> Energy <strong>Price</strong> Drivers, 1870 <strong>to</strong> <strong>2015</strong>E<br />
<strong>The</strong>re have been seven price cycles for the U.S. PPI for Fuels and Electric Power since 1870, averaging<br />
approximately 18 years in length. Shown in Exhibit 31, the three energy inflation cycles produced average<br />
annual energy price growth <strong>of</strong> 8.0%, whereas the four deflationary periods produced an average annual<br />
decline <strong>of</strong> 2.1%. <strong>The</strong> energy inflation cycles largely coincided with inflation in the broad PPI All<br />
Commodities Index, although the timing was not always exact.<br />
We cite some <strong>of</strong> the supply and demand drivers in those cycles, highlighting the “rhymes” over time.<br />
• Deflation 1870 <strong>to</strong> 1898: Post-Civil War peace dividend, and enhanced coal mining and drilling technology.<br />
Coal replaced wood as the primary source <strong>of</strong> energy for homes and industrial uses.<br />
• <strong>Inflation</strong> 1898 <strong>to</strong> 1920: Demand-led; 10 million au<strong>to</strong>s were registered by 1920, contributing <strong>to</strong> oil<br />
price inflation <strong>of</strong> 6.3% annually. Later, World War I helped triple energy prices from the years 1915 <strong>to</strong><br />
1920.<br />
• Deflation 1920 <strong>to</strong> 1933: Post-war peace dividend, then the collapsing demand <strong>of</strong> the Great Depression,<br />
as per capita energy use fell 2.5%, on average.<br />
• <strong>Inflation</strong> 1933 <strong>to</strong> 1951: Demand-led; real power plant building rose 13% annually in the period. Later,<br />
World War II constricted supply, but vehicle ownership grew 4.3% per year over the entire period.
Industrial Portfolio Strategy<br />
<strong>The</strong> <strong>Inflation</strong> <strong>Cycle</strong> <strong>of</strong> <strong>2002</strong> <strong>to</strong> <strong>2015</strong> ⎯ April 19, <strong>2002</strong> -41- Legg Mason Wood Walker, Inc.<br />
Exhibit 31 – PPI Energy <strong>Price</strong> His<strong>to</strong>ry and Supply/Demand Drivers, 1870 <strong>to</strong> <strong>2015</strong>E<br />
1,000<br />
100<br />
10<br />
Coal replaces wood;<br />
oil drilling ramp.<br />
1870 <strong>to</strong> 1898 CAGR<br />
(2.5)%<br />
1898 <strong>to</strong><br />
1920<br />
CAGR<br />
7.3%<br />
World<br />
War I,<br />
U.S.<br />
GNP<br />
growth,<br />
au<strong>to</strong>s.<br />
1920 <strong>to</strong><br />
1933<br />
CAGR<br />
(6.7)%<br />
1933 <strong>to</strong><br />
1951<br />
CAGR<br />
3.6%<br />
Deflation,<br />
depression.<br />
Electric<br />
power<br />
growth,<br />
World War<br />
II.<br />
1951<br />
<strong>to</strong> 1965<br />
CAGR<br />
0.4%<br />
1965 <strong>to</strong><br />
1981<br />
CAGR<br />
13.2%<br />
Cheap oil<br />
imports, coal<br />
mechanization.<br />
OPEC embargo,<br />
U.S. well<br />
depletion, more<br />
coal, nuclear.<br />
2001 <strong>to</strong><br />
<strong>2015</strong>E<br />
CAGR<br />
6.1%<br />
1981 <strong>to</strong> Non-<br />
2001 OPEC<br />
CAGR production<br />
0.4% increase,<br />
fuel<br />
efficiency<br />
measures.<br />
FSU,<br />
China,<br />
shift.<br />
1<br />
1870<br />
1880<br />
1890<br />
1900<br />
1910<br />
1920<br />
1930<br />
1940<br />
1950<br />
1960<br />
1970<br />
1980<br />
1990<br />
2000<br />
2010E<br />
PPI Fuels and Electric Power<br />
SUPPLY-SIDE ISSUES<br />
DEMAND-SIDE ISSUES<br />
U.S. U.S. Power<br />
PPI- Fuels CAGR % U.S. U.S. Oil U.S. Light Plant Per<br />
and Electric <strong>of</strong> PPI Crude Crude Output Coal (2) U.S. U.S. Duty Construc. Capita<br />
Power Fuels and Oil Oil per Output World Real Mo<strong>to</strong>r Vehicles Expend- Energy<br />
<strong>Inflation</strong> or Electric Imports Cost/bbl Well (1) per Miner War? GDP (3) Vehicles MPG itures Cons.<br />
Deflation Power Growth Growth Growth Growth YES Growth Growth Growth Growth Growth<br />
Period Yrs. Index Rate Rate Rate Rate or NO Rate Rate (4) Rate (5) Rate (6) Rate (7)<br />
1870 <strong>to</strong> 1898 28 (2.5)% na (5.5)% na (1.5)% NO 5.0% na na na 4.4%<br />
1898 <strong>to</strong> 1920 22 7.3% na 6.3% na 1.4% YES 3.3% 42.3% na na 3.2%<br />
1920 <strong>to</strong> 1933 13 (6.7)% (8.9)% (11.1)% 1.3% (0.8)% NO 0.1% 7.7% na (4.4)% (2.5)%<br />
1933 <strong>to</strong> 1951 18 3.6% 10.1% 7.7% 3.0% 3.3% YES 5.6% 4.3% (0.5)% 13.1% 3.5%<br />
1951 <strong>to</strong> 1965 14 0.4% 6.8% 0.9% 0.2% 7.3% NO 3.7% 4.0% (0.2)% 3.2% 1.1%<br />
1965 <strong>to</strong> 1981 16 13.2% 8.2% 16.2% 0.9% (0.8)% NO 3.2% 3.6% 0.5% 5.6% 1.1%<br />
1981 <strong>to</strong> 2001 20 0.4% 3.7% (2.0)% (1.8)% 7.6% NO 3.1% 1.7% 1.2% (4.0)% 0.4%<br />
2001 <strong>to</strong> <strong>2015</strong>E 14E 6.1%E 3.2%E 7.4%E ne ne 25%E 3.0%E 1.0%E 0.2%E ne 0.7%E<br />
(1) Period 1920 <strong>to</strong> 1933 is restated as 1925 <strong>to</strong> 1933, and period 1981 <strong>to</strong> 2001 is restated as 1981 <strong>to</strong> 2000, due <strong>to</strong> data constraints.<br />
(2) Anthracite coal for 1870-1898 period; bituminous coal for other periods.<br />
(3) Real GNP prior <strong>to</strong> 1947.<br />
(4) Period 1898 <strong>to</strong> 1920 is restated as 1900 <strong>to</strong> 1920, and period 1981 <strong>to</strong> 2001 restated as 1981 <strong>to</strong> 1998, due <strong>to</strong> data constraints.<br />
(5) Period 1933 <strong>to</strong> 1951 is restated as 1936 <strong>to</strong> 1951, and period 1981 <strong>to</strong> 2001 restated as 1981 <strong>to</strong> 1999, due <strong>to</strong> data constraints.<br />
(6) Used three-year centered average. Period 1981 <strong>to</strong> 2001 is restated as 1981 <strong>to</strong> 1999, due <strong>to</strong> data constraints.<br />
(7) Period 1981 <strong>to</strong> 2001 is restated as 1981 <strong>to</strong> 2000, due <strong>to</strong> data constraints.<br />
Source: PPI - Fuels and Electric Power 1870 <strong>to</strong> 1889 Warren & Pearson study, 1890 <strong>to</strong> 1969 PPI is the shipment-weighted annual averages <strong>of</strong> monthly prices<br />
prepared by the U.S. BLS, 1970 <strong>to</strong> Present is the PPI Fuels and Electric Power (NSA), from the U.S. BLS, all Indices have been placed in a continuous re-weighted<br />
series so that the 12-month average <strong>of</strong> 2000 = 100; Crude oil imports 1920 <strong>to</strong> 1948: American Petroleum Institute (API); 1949 <strong>to</strong> 2001: EIA Annual Energy Review<br />
Tables; Crude Oil price: 1870-1905: U.S. Census, His<strong>to</strong>rical Statistics <strong>of</strong> the United States, Colonial Times <strong>to</strong> 1970; 1906-1948: API, average price <strong>of</strong> crude oil in the<br />
United States. 1949-2001: EIA, Annual Energy Review Tables, Domestic Crude First Purchase <strong>Price</strong>. U.S. oil and coal production: 1870 <strong>to</strong> 1948: U.S. Census,<br />
His<strong>to</strong>rical Statistics <strong>of</strong> the United States, Colonial Times <strong>to</strong> 1970; 1949-2001: 1949-2001: EIA, Annual Energy Review Tables. Oil Wells: 1925 <strong>to</strong> 1948: API, 1949 <strong>to</strong><br />
2000: EIA, Annual Energy Review Tables; Coal miners: 1870 <strong>to</strong> 1970: U.S. Census, His<strong>to</strong>rical Statistics <strong>of</strong> the United States, Colonial Times <strong>to</strong> 1970; 1971- present:<br />
Bureau <strong>of</strong> Labor Statistics; GNP (1870 <strong>to</strong> 1947) and GDP (1947 <strong>to</strong> 2001) per capita based upon NBER and U.S. Census data. Mo<strong>to</strong>r vehicle registrations: 1900 <strong>to</strong><br />
1970: U.S. Census, His<strong>to</strong>rical Statistics <strong>of</strong> the United States, Colonial Times <strong>to</strong> 1970; 1971 <strong>to</strong> 1998: Bureau <strong>of</strong> Transportation Statistics. Includes all highway<br />
vehicles except mo<strong>to</strong>rcycles. Vehicle Fuel Economy: 1936 <strong>to</strong> 1948: U.S. Census, His<strong>to</strong>rical Statistics <strong>of</strong> the United States, Colonial Times <strong>to</strong> 1970; 1949 <strong>to</strong> 1999:<br />
EIA, Annual Energy Review Tables; Utility Construction Expenditures: Census Bureau; Per capita energy consumption: 1870 <strong>to</strong> 1948: U.S. Census, His<strong>to</strong>rical<br />
Statistics <strong>of</strong> the United States, Colonial Times <strong>to</strong> 1970; 1949 <strong>to</strong> 2000: EIA, Annual Energy Review Tables. 2001 <strong>to</strong> <strong>2015</strong> estimates are Legg Mason estimates based<br />
on EIA, International Energy Outlook <strong>2002</strong>, and Annual Energy Outlook <strong>2002</strong>. World War risk is a Legg Mason estimate.
Industrial Portfolio Strategy<br />
<strong>The</strong> <strong>Inflation</strong> <strong>Cycle</strong> <strong>of</strong> <strong>2002</strong> <strong>to</strong> <strong>2015</strong> ⎯ April 19, <strong>2002</strong> -42- Legg Mason Wood Walker, Inc.<br />
• Deflation 1951 <strong>to</strong> 1965: Postwar peace dividend, with overseas oil production growth that caused<br />
U.S. oil imports <strong>to</strong> grow at a rate <strong>of</strong> 6.8% per year. Also, U.S. vehicle growth matured.<br />
• <strong>Inflation</strong> 1965 <strong>to</strong> 1981: OPEC supply embargoes, U.S. oil output peaked in 1970, U.S. oil imports<br />
grew 8.2% annually, there were cold winters. Energy prices rose 13.2% per annum from 1965 <strong>to</strong> 1981.<br />
• Deflation 1981 <strong>to</strong> 2001: Conservation, non-OPEC supply, a utility power glut, Gulf and Cold War<br />
peace dividends; $1 million <strong>of</strong> real GDP in 2000 used 765 barrels <strong>of</strong> oil, versus 1,537 barrels in 1972.<br />
We believe that the price mechanism still drives the energy market, and prices periodically inflate<br />
and deflate. For one <strong>to</strong> accept the argument that oil prices will perennially deflate (recall that disinflation is<br />
relative deflation) from the last cyclical peak in 1981 <strong>to</strong> infinity, then one must also believe that the price<br />
mechanism resulting from the push-pull relationship <strong>of</strong> supply and demand, and the effect it has on oil producer<br />
investment in new technologies,<br />
has been suspended.<br />
Our view is that crude oil is a<br />
form <strong>of</strong> wealth, and wealth<br />
flows <strong>to</strong> where it can obtain the<br />
highest return. If we consider<br />
gross domestic product <strong>to</strong> be the<br />
return that is gained from the<br />
“investment” <strong>of</strong> crude oil (among<br />
other inputs) in an economy, we<br />
would expect higher rates <strong>of</strong> oil<br />
consumption by economies that<br />
produce the most GDP output from<br />
each barrel <strong>of</strong> oil. This is shown in<br />
Exhibit 32, which contrasts per<br />
capita oil consumption rates on the<br />
vertical axis with the oil intensity<br />
<strong>of</strong> GDP on the horizontal axis, for<br />
62 countries for which oil consumption<br />
and GDP information<br />
were available for the year 2000.<br />
<strong>The</strong> upper-left quadrant <strong>of</strong> the chart<br />
contains most <strong>of</strong> the world’s advanced<br />
economies, which are the<br />
largest oil consumers, yet justify<br />
Exhibit 32 – Oil Consumption Per Capita Versus Oil<br />
Intensity <strong>of</strong> GDP, 62 Nations, As Of Year 2000<br />
Barrels <strong>of</strong> oil per capita, 2000<br />
100<br />
10<br />
1<br />
Lower oil intensity,<br />
higher oil<br />
consumption.<br />
Higher oil intensity<br />
<strong>of</strong> GDP, yet lower oil<br />
consumption rates.<br />
0<br />
100 1,000 10,000<br />
Barrels <strong>of</strong> oil per $1 million <strong>of</strong> GDP, 2000<br />
Source: Oil consumption: BP Statistical Review <strong>of</strong> World Energy June 2001; Population:<br />
this consumption through more energy-efficient GDP output. Poorer countries tend <strong>to</strong> occupy the lower<br />
right portion <strong>of</strong> the graph, where low levels <strong>of</strong> oil consumption are associated with the inefficient use <strong>of</strong> oil<br />
in producing GDP output. (Many <strong>of</strong> the outliers in the upper-right portion <strong>of</strong> the graph are oil-producing nations<br />
that consume a disproportionate amount <strong>of</strong> oil in relation <strong>to</strong> their size).<br />
Our view is that as the world economy becomes more integrated over time, then we would expect<br />
greater global energy efficiency, which would manifest itself in a clustering around the trend line in Exhibit<br />
32. <strong>The</strong> alternative <strong>to</strong> that clustering would be a migration <strong>to</strong> the upper-right quadrant <strong>of</strong> Exhibit 32, or<br />
U.S.A.<br />
China
Industrial Portfolio Strategy<br />
<strong>The</strong> <strong>Inflation</strong> <strong>Cycle</strong> <strong>of</strong> <strong>2002</strong> <strong>to</strong> <strong>2015</strong> ⎯ April 19, <strong>2002</strong> -43- Legg Mason Wood Walker, Inc.<br />
high energy consumption per capita with low efficiency in relation <strong>to</strong> GDP, which we view as unlikely unless<br />
there is a discovery <strong>of</strong> some civilization-changing new source <strong>of</strong> low-cost energy. Unless that occurs,<br />
our view is that normal supply and demand forces will result in a periodic inflation <strong>of</strong> oil prices, and<br />
we believe that the economic adjustment <strong>to</strong> the next energy inflation, in terms <strong>of</strong> substitutes and conservation,<br />
may be shorter than the 1970s <strong>to</strong> 1980s experience but longer than a few years.<br />
<strong>The</strong> Demand Side <strong>of</strong> the Oil Equation – <strong>The</strong> 2001 <strong>to</strong> <strong>2015</strong> Environment<br />
We view the change in the location <strong>of</strong> world GDP growth <strong>to</strong> be more critical than the makeup <strong>of</strong> GDP<br />
growth. From 1980 <strong>to</strong> 2000, North America, Western Europe, and Japan combined accounted for 73% <strong>of</strong><br />
the world’s incremental GDP growth, measured in constant U.S. dollars. We project that those highly<br />
developed economies will only account for 54% <strong>of</strong> incremental GDP growth from 2001 <strong>to</strong> <strong>2015</strong>, and we<br />
also estimate that China alone, which accounted for 8.8% <strong>of</strong> world GDP growth from 1980 <strong>to</strong> 2000, should<br />
contribute 14.4% <strong>of</strong> incremental world GDP growth in that period. In terms <strong>of</strong> raw materials intensity, as<br />
developing economies become a greater component <strong>of</strong> world GDP growth, we look for those consumers <strong>to</strong><br />
add “plumbing <strong>to</strong> the home” or even a “better home” long before “fiber <strong>to</strong> the home” becomes much <strong>of</strong> a<br />
desire.<br />
<strong>The</strong> experience <strong>of</strong> the U.S. in the 20th century is instrumental in gauging the future for developing<br />
world raw materials usage. According <strong>to</strong> the Second Law <strong>of</strong> <strong>The</strong>rmodynamics, the amount <strong>of</strong> disorder in<br />
the universe always increases. Since economic growth is the creation <strong>of</strong> order out <strong>of</strong> disorder, it follows that<br />
the consumption <strong>of</strong> energy (and materials) is required <strong>to</strong> <strong>of</strong>fset nature’s tendency <strong>to</strong>ward disorder. <strong>The</strong> experience<br />
<strong>of</strong> the U.S. in its early growth stages is instructive in that regard. In the period 1900 <strong>to</strong> 1950, U.S.<br />
real GNP grew at a rate <strong>of</strong> 3.1%, compared <strong>to</strong> 3.5% GDP growth in the 1950 <strong>to</strong> 2000 period. As we noted<br />
previously, however, per capita material consumption was far higher in the first half <strong>of</strong> the century than in<br />
the second half. U.S. per capita GDP growth from 1900 <strong>to</strong> 1950 grew by 128%, but per capita materials<br />
usage grew 2700% for petroleum, 890% for non-fuel organics, 400% for paper and board products, 310%<br />
for metals, and 220% for industrial minerals. Although U.S. real GDP per capita grew 183% from 1950 <strong>to</strong><br />
1998, a larger gain than in the first half <strong>of</strong> the century, per capita usage grew only 64% for petroleum, 143%<br />
for non-fuel organics, 93% for paper and board products, 13% for metals, and 37% for industrial minerals.<br />
Material consumption growth correlates closely with living standards improvements; desiring the<br />
latter, developing nations can be expected <strong>to</strong> ramp up demand for the former as a means <strong>to</strong> an end.<br />
Life expectancy at birth in the U.S. grew from 47 years in 1900 <strong>to</strong> 68 years in 1950, and then <strong>to</strong> 77 years in<br />
2000. <strong>The</strong> average U.S. work week fell from 59 hours in 1900 <strong>to</strong> 40.5 hours in 1950, and then <strong>to</strong> 34.5 hours<br />
in 1999. Since poor sanitation has been the leading cause <strong>of</strong> death in human his<strong>to</strong>ry, it is noteworthy that<br />
10% <strong>of</strong> U.S. households had flush <strong>to</strong>ilets in 1900, versus 76% in 1950 and 98% in 2000. For these and<br />
countless other reasons, we believe the first half <strong>of</strong> the 20th century in the United States represented the<br />
steep part <strong>of</strong> the curve for U.S. living standards. Our view is that much <strong>of</strong> the developing world and the<br />
former communist countries <strong>of</strong> the FSU and Eastern Europe are following – or soon will be<br />
following – a similar trajec<strong>to</strong>ry <strong>to</strong> the United States in the first half <strong>of</strong> the 20th century.<br />
<strong>The</strong> China Example – Pushing <strong>The</strong> Oil Demand Envelope - 2001 <strong>to</strong> <strong>2015</strong><br />
By several measures, Chinese economic development matches that <strong>of</strong> the U.S. in the late 19th and<br />
early 20th centuries. Both in terms <strong>of</strong> real per capita income and urbanization rate, China’s economic de-
Industrial Portfolio Strategy<br />
<strong>The</strong> <strong>Inflation</strong> <strong>Cycle</strong> <strong>of</strong> <strong>2002</strong> <strong>to</strong> <strong>2015</strong> ⎯ April 19, <strong>2002</strong> -44- Legg Mason Wood Walker, Inc.<br />
velopment compares <strong>to</strong> that <strong>of</strong> the U.S. in the last decade <strong>of</strong> the 19th century. <strong>The</strong> U.S. currently has four<br />
times more inland freight transport avenues (paved roads, railways, and navigable waterways) per square<br />
mile than China does. So, typical <strong>of</strong> a developing country, China’s freight capabilities are heavily skewed<br />
<strong>to</strong>ward inland waterways, which handle 51% <strong>of</strong> freight traffic versus only 14% in the U.S. As a result,<br />
China has embarked on a major road-building campaign, the scale <strong>of</strong> which has not been seen since the<br />
building <strong>of</strong> the Eisenhower U.S. Interstate network, and if the U.S. experience is a guide, China plans <strong>to</strong><br />
populate those highways with au<strong>to</strong>mobiles rapidly. China built 8,000 miles <strong>of</strong> expressway in the past three<br />
years, with plans <strong>to</strong> build seven additional east-west and five north-south expressways by 2008. Using those<br />
roads will be 72 million mo<strong>to</strong>r vehicles (excluding mo<strong>to</strong>rcycles) by 2010, according <strong>to</strong> a recent Chinese<br />
government study, up from only 20 million in 2001, for a growth rate <strong>of</strong> over 15% annually, similar <strong>to</strong> the<br />
U.S. experience <strong>of</strong> the first half <strong>of</strong> the 20th century. China imposes a tariff <strong>of</strong> 80% <strong>to</strong> 100% on imported<br />
au<strong>to</strong>s, but WTO entrance requires China <strong>to</strong> lower that rate <strong>to</strong> 25% by July 2006. Many <strong>of</strong> the world’s major<br />
au<strong>to</strong>makers are establishing manufacturing facilities in China, with the main purpose <strong>of</strong> selling cars <strong>to</strong> the<br />
domestic market rather than exporting them.<br />
Economic expansion can produce tremendous gains in oil consumption. Exhibit 33 shows the way in<br />
which Japan in the 1960s and South Korea in the 1990s made rapid gains in oil consumption around the<br />
same time that their economies became manufacturing powerhouses. In a recent interview, U.S. Treasury<br />
Secretary Paul O’Neill stated that South Korea transformed itself from a “13th century economy” <strong>to</strong><br />
“middle- class prosperity” in the space <strong>of</strong> 40 years, and wondered aloud why that model could not be replicated<br />
more frequently. Point “A” in Exhibit 33 represents Chinese oil demand at the Japanese/South Korean<br />
level, equivalent <strong>to</strong> 69 million barrels per day (18 barrels per capita annually). Since that level is equal <strong>to</strong><br />
88% <strong>of</strong> current global oil production, we believe it is beyond our forecast horizon. Point “B” is Chinese oil<br />
demand <strong>of</strong> 10 million barrels per day<br />
(2.6 barrels per capita per year) in<br />
<strong>2015</strong>, versus 4.9 million barrels per<br />
day in 2001, equal <strong>to</strong> EIA’s “high<br />
economic growth” case for China.<br />
EIA projects that China’s domestic<br />
oil production will decline slightly <strong>to</strong><br />
just over three million barrels per day<br />
through <strong>2015</strong>, so China must increase<br />
oil imports over current levels<br />
by 5.3 million barrels per day by<br />
<strong>2015</strong>, an amount greater than the<br />
<strong>to</strong>tal <strong>of</strong> Iraq’s + Kuwait’s + Qatar’s<br />
2001 exports, simply <strong>to</strong> bring<br />
China’s per capita oil consumption<br />
<strong>to</strong> one-tenth the current U.S. level.<br />
Again, the U.S. experience in the first<br />
half <strong>of</strong> the 20th century is instructive.<br />
In Exhibit 34, we compare U.S. oil<br />
consumption <strong>to</strong> real GDP on a per<br />
capita basis for the 1902 <strong>to</strong> 2001 period,<br />
and overlay data for China for<br />
the period 1975 <strong>to</strong> 2000, with our<br />
Exhibit 33 – Oil consumption per capita for Japan, South<br />
Korea, and China, 1950-2001<br />
Oil consumption per capita (barrels/yr.)<br />
25<br />
20<br />
15<br />
10<br />
5<br />
0<br />
1950<br />
1955<br />
1960<br />
1965<br />
1970<br />
Tremendous surges in oil<br />
consumption and quality <strong>of</strong> life<br />
Cost differential<br />
drives manufacturing<br />
<strong>to</strong> "Asia Tigers"<br />
1975<br />
1980<br />
Source: Oil consumption: 1950-1964: U.N Energy Statistics Database; 1965-2000: BP<br />
Statistical Review <strong>of</strong> World Energy. 2001: EIA<br />
1985<br />
1990<br />
1995<br />
2000<br />
Japan South Korea China<br />
Cost differential<br />
drives manufacturing<br />
<strong>to</strong> China<br />
2005<br />
2010<br />
A<br />
B<br />
<strong>2015</strong>
Industrial Portfolio Strategy<br />
<strong>The</strong> <strong>Inflation</strong> <strong>Cycle</strong> <strong>of</strong> <strong>2002</strong> <strong>to</strong> <strong>2015</strong> ⎯ April 19, <strong>2002</strong> -45- Legg Mason Wood Walker, Inc.<br />
forecast <strong>to</strong> <strong>2015</strong> for China (China<br />
amounts are purchasing power<br />
parity, in an effort <strong>to</strong> improve<br />
comparability.)<br />
Exhibit 34 – U.S. Oil Consumption vs. GDP, 1902 <strong>to</strong> 2001,<br />
And For China, 1975 <strong>to</strong> <strong>2015</strong>E<br />
100 bbl.<br />
<strong>The</strong> energy s<strong>to</strong>ry is much the<br />
same throughout Asia. In 2000,<br />
Asia (outside <strong>of</strong> the Middle East<br />
and the former Soviet Union) accounted<br />
for 28% <strong>of</strong> the world’s<br />
oil consumption, yet produced<br />
only 11% <strong>of</strong> the world’s oil supply<br />
and had only 4% <strong>of</strong> the<br />
world’s oil reserves. <strong>The</strong> region’s<br />
population <strong>of</strong> 3.5 billion, 56% <strong>of</strong><br />
the world <strong>to</strong>tal, presents a tremendous<br />
labor resource for the<br />
world’s manufacturers and potentially<br />
the world’s largest consumer<br />
market. Of course, the<br />
abundance <strong>of</strong> even less expensive<br />
labor in China is a concern<br />
among those who feel that China<br />
will come <strong>to</strong> dominate regional<br />
trade in much the way it already<br />
Oil Consumption Per Capita<br />
10 bbl.<br />
1 bbl.<br />
China in 1975<br />
0 bbl.<br />
China Forecast<br />
through <strong>2015</strong><br />
China in<br />
2000<br />
USA in 1902<br />
USA in 2001<br />
$100 $1,000 $10,000 $100,000<br />
U.S. oil consumption Real vs. GDP GDP Per per Capita Capita, (PPP 1902 for <strong>to</strong> 2001 China)<br />
China's oil consumption vs. Real (PPP) GDP, Per Capita, 1975 <strong>to</strong> <strong>2015</strong>E<br />
Source: U.S.: pre-1970: U.S. Census publication “His<strong>to</strong>rical Statistics <strong>of</strong> the United<br />
States, Colonial Times <strong>to</strong> 1970.” GNP used in place <strong>of</strong> GDP pre-1947. 1970-2001: GDP:<br />
BEA. Oil: EIA. China: Oil: 1965-2000: BP Statistical Review <strong>of</strong> World Energy. 2001: EIA;<br />
<strong>2002</strong>-<strong>2015</strong>: LM projection. GDP <strong>to</strong> 2000: World Bank; Projection uses GDP growth rate<br />
from EIA, International Energy Outlook <strong>2002</strong>, high growth case<br />
dominates foreign direct investment flows. But we are optimistic that the successful U.S. bilateral experience<br />
with Mexico in the post-NAFTA period is more applicable <strong>to</strong> the Asian situation than a “crowdingout”<br />
assumption, the latter <strong>of</strong> which does not adequately account for an expanding economic pie, in our<br />
view. We anticipate that rising Asian demand for energy will stretch the world’s ability <strong>to</strong> meet its vast<br />
needs, and demand-pull inflation for commodities could result.<br />
<strong>The</strong> Supply Side <strong>of</strong> the Oil Equation – <strong>The</strong> 2001 <strong>to</strong> <strong>2015</strong> Environment<br />
Our projection <strong>of</strong> near-zero growth in production in the world’s major industrial nations makes the<br />
supply situation in oil-exporting regions critical <strong>to</strong> continued world economic growth. Our oil supply<br />
and demand forecast, summarized in Exhibit 35, is largely EIA’s model, cus<strong>to</strong>mized <strong>to</strong> account for our<br />
higher demand estimates in certain oil-producing and Asia-Pacific markets. Our adjustments add 4.6 million<br />
barrels per day <strong>to</strong> demand in <strong>2015</strong>, a 4% increase over EIA’s reference case. On the supply side, we use<br />
EIA’s reference case forecast through <strong>2015</strong>, adjusted upward <strong>to</strong> account for the added demand. We believe<br />
several striking developments in this forecast, including the following.<br />
• Middle East sources account for 47% <strong>of</strong> the incremental growth in oil supply in the 2001 <strong>to</strong> <strong>2015</strong> period,<br />
an increase from the 37% Middle Eastern share <strong>of</strong> incremental supply in the 1981 <strong>to</strong> 2001 period.<br />
Our projection assumes that Saudi Arabian production capacity alone will rise from 9.4 million barrels<br />
per day in 2000 <strong>to</strong> 18.2 million barrels per day by <strong>2015</strong>, enriching the Kingdom and, potentially, enabling<br />
the al-Saud family <strong>to</strong> continue its his<strong>to</strong>rical practice <strong>of</strong> employing financial largesse <strong>to</strong> fund domestic<br />
development, and thus maintain power.
Industrial Portfolio Strategy<br />
<strong>The</strong> <strong>Inflation</strong> <strong>Cycle</strong> <strong>of</strong> <strong>2002</strong> <strong>to</strong> <strong>2015</strong> ⎯ April 19, <strong>2002</strong> -46- Legg Mason Wood Walker, Inc.<br />
• European share <strong>of</strong> new oil supply growth falls from 24% in 1981 <strong>to</strong> 2001 <strong>to</strong> 1% in the 2001 <strong>to</strong> <strong>2015</strong><br />
period. This is caused by maturing North Sea fields, which were major non-OPEC producers after 1981.<br />
• FSU and Eastern European demand collapsed after 1981, subtracting 41% from the change in world<br />
oil supply, but rebounding post-Communist demand in those countries adds 15% <strong>to</strong> 2001–15 estimated<br />
growth. Although we expect FSU oil production in <strong>2015</strong> <strong>of</strong> 14.4 million barrels per day <strong>to</strong> eclipse the<br />
prior production peak <strong>of</strong> 12.7 million barrels per day in 1987, the rebound in FSU demand <strong>to</strong> 8.3 million<br />
barrels per day we forecast in <strong>2015</strong> is still below the 9.1 million barrels per day consumed in the<br />
peak year <strong>of</strong> 1982, 33 years earlier, for perspective.<br />
• African oil production, 66% <strong>of</strong> which comes from three OPEC members, Nigeria, Algeria, and Libya,<br />
could be joined by newly discovered oilfields in <strong>of</strong>fshore Angola, which is not an OPEC member. Development<br />
<strong>of</strong> these fields should add about 2 million barrels per day by <strong>2015</strong>, representing about onethird<br />
<strong>of</strong> Africa’s incremental growth in production over that time per EIA estimates.<br />
Whereas OPEC’s ability <strong>to</strong> periodically constrict supply was the “oil weapon” <strong>of</strong> the 1970s, we believe<br />
that the key <strong>to</strong> OPEC’s strength in the coming years will be its rising market position filling incremental<br />
world demand for oil. In our view, this shift in market power from the western oil-consuming nations<br />
<strong>to</strong> the generally eastern and southern oil-producing ones will probably have widespread economic and<br />
political ramifications that lead <strong>to</strong> still more developing country modernization. In Exhibit 36, we show the<br />
percent <strong>of</strong> world oil production held by oil export-based countries recovering from 57% in 2001 <strong>to</strong> 66% in<br />
<strong>2015</strong>, and even though this is a sharp rebound, it is still below the 1976 peak <strong>of</strong> 70%. In Exhibit 37, we<br />
Exhibit 35 – World Oil Supply And Demand His<strong>to</strong>ry and Our Projection <strong>to</strong> <strong>2015</strong><br />
World<br />
2001 / 1981 <strong>2015</strong> / 2001 World<br />
2001 / 1981 <strong>2015</strong> / 2001<br />
Oil Demand Demand As Demand As Oil Supply Supply As Supply As<br />
(million bbl/day) % <strong>of</strong> Total % <strong>of</strong> Total (million bbl/day) % <strong>of</strong> Total % <strong>of</strong> Total<br />
Incremental Incremental Incremental Incremental<br />
1981 2001 <strong>2015</strong> Demand Demand 1981 2001 <strong>2015</strong> Production Production<br />
Net importers:<br />
USA/Canada 17.8 21.7 27.4 26% 16% 12.4 11.9 13.3 -3% 4%<br />
W. Europe 12.3 13.8 15.5 10% 5% 2.9 6.7 6.9 24% 1%<br />
E. Europe 2.3 1.4 2.0 -6% 2% 0.5 0.2 0.3 -1% 0%<br />
Japan 4.8 5.4 6.6 4% 3% 0.0 0.1 0.1 0% 0%<br />
China 1.8 4.9 10.0 21% 14% 2.0 3.3 3.1 8% -1%<br />
India 0.7 2.0 4.1 9% 6% 0.3 0.7 0.7 3% 0%<br />
Other East Asia 2.5 7.4 11.7 33% 12% 2.2 3.2 3.3 6% 0%<br />
Australasia 0.8 1.1 1.8 2% 2% 0.5 0.8 0.8 2% 0%<br />
Net exporters:<br />
Middle East 2.5 5.2 8.6 18% 9% 16.5 22.3 38.8 37% 47%<br />
Africa 1.6 2.4 4.5 6% 6% 4.9 8.2 14.4 21% 18%<br />
Latin America 4.9 6.8 11.3 13% 13% 6.4 10.3 15.6 24% 15%<br />
Former Soviet U. 8.9 3.7 8.3 -35% 13% 12.2 8.8 14.4 -21% 16%<br />
World<br />
60.9 75.8 111.8 100% 100% 60.7 76.6 111.7 100% 100%<br />
Source: 1981: BP Statistical Review <strong>of</strong> World Energy 2001; 2001: EIA Monthly Energy Review, March <strong>2002</strong>; <strong>2015</strong>: EIA’s International<br />
Energy Outlook <strong>2002</strong> reference case forecast, except high economic growth forecast was used <strong>to</strong> estimate demand in China, Japan,<br />
Middle East, FSU, and Australasia. EIA IEO <strong>2002</strong> reference case supply forecast was used. Because demand forecast exceed reference<br />
case supply forecast, incremental supply increases were added <strong>to</strong> each region, with the regional shares based on 2001-<strong>2015</strong><br />
reference case supply growth as a percentage <strong>of</strong> the world <strong>to</strong>tal.
Industrial Portfolio Strategy<br />
<strong>The</strong> <strong>Inflation</strong> <strong>Cycle</strong> <strong>of</strong> <strong>2002</strong> <strong>to</strong> <strong>2015</strong> ⎯ April 19, <strong>2002</strong> -47- Legg Mason Wood Walker, Inc.<br />
Exhibit 36 – Oil export-based economies as<br />
share <strong>of</strong> world oil production, 1965-<strong>2015</strong>E<br />
Exhibit 37 – Non-OPEC Reserve-To-<br />
Production Ratio, 1952 <strong>to</strong> <strong>2015</strong>E<br />
Percent <strong>of</strong> World Oil Production Held<br />
By Oil-Export-Based Countries<br />
70%<br />
65%<br />
60%<br />
55%<br />
LM<br />
Estimate<br />
Non-OPEC Reserve/Production<br />
24<br />
22<br />
20<br />
18<br />
16<br />
14<br />
12<br />
10<br />
Major new non-OPEC discoveries 1968-<br />
1975 in North Sea, Alaska, Siberia, but<br />
rate <strong>of</strong> new discoveries has declined.<br />
Forecast assumes<br />
non-OPEC reserve<br />
additions continue at<br />
1986-2001 rate.<br />
LM<br />
Estimate<br />
50%<br />
1965<br />
1969<br />
1973<br />
1977<br />
1981<br />
1985<br />
1989<br />
1993<br />
1997<br />
2001<br />
2005<br />
2009<br />
2013<br />
8<br />
1952<br />
1956<br />
1960<br />
1964<br />
1968<br />
1972<br />
1976<br />
1980<br />
1984<br />
1988<br />
1992<br />
1996<br />
2000<br />
2004<br />
2008<br />
2012<br />
Source: BP Statistical Review <strong>of</strong> World Energy June 2001, 1965-<br />
2000. 2001 data: EIA. <strong>2002</strong>-<strong>2015</strong>: Legg Mason projection based<br />
on EIA, international Energy Outlook <strong>2002</strong>, March <strong>2002</strong>. “Oil<br />
export-based economies” include OPEC, FSU, and non-OPEC<br />
Africa and Middle East.<br />
Source: Production: Source: UN 1952-1964; BP 1965-2000. EIA<br />
2001. Reserves: 1952-<strong>2002</strong>: OGJ Energy Statistics Sourcebook, Oil<br />
& Gas Journal. Legg Mason projection<br />
show the reserve-<strong>to</strong>-production ratio <strong>of</strong> non-OPEC producers falling from 13.3 in 2001 <strong>to</strong> 8.2 in <strong>2015</strong>, far<br />
below the 1975 peak <strong>of</strong> 22.3. Although higher oil prices, if they occur, would prompt increased exploration<br />
and reserve additions, the cost <strong>of</strong> those wells may rise as an <strong>of</strong>fsetting fac<strong>to</strong>r. For example, successful experiences<br />
in Brazil, Argentina, and Angola demonstrate that deepwater drilling at water depths that test the<br />
limits <strong>of</strong> available exploration technologies can result in new discoveries, but at great expense.<br />
To summarize, we believe that the world appears <strong>to</strong> be in a transition phase from generally slack <strong>to</strong><br />
generally tight oil supply, thanks <strong>to</strong> Asian oil demand and recovering FSU and satellite usage in excess<br />
<strong>of</strong> rising production, with no North Sea-sized non-OPEC price spoiling discoveries expected. Exhibit<br />
38 summarizes the global import/export balance <strong>of</strong> petroleum from 1965 through our <strong>2015</strong> estimate,<br />
with net oil exporters shown on the <strong>to</strong>p half <strong>of</strong> the graph and net importers shown on the bot<strong>to</strong>m half. From<br />
2001 <strong>to</strong> <strong>2015</strong>, we project that 62% <strong>of</strong> the incremental growth in net imports by region will be in Asia/<br />
Pacific ex-Japan. On the supply side, 69% <strong>of</strong> the growth in net exports is seen coming from the Middle<br />
East, followed by 21% from Africa and the rest from FSU and Latin America. <strong>The</strong> major s<strong>to</strong>ry is the increasing<br />
reliance <strong>of</strong> Asia on Middle East oil on a scale that reorients economic and security alliances.<br />
Exhibit 38 also contains our oil price forecast, in both real (2000$) and nominal terms. We project that<br />
U.S. crude oil prices, expressed in real 2000 dollars, will rise from $22.40 in 2001 <strong>to</strong> $26.11 in <strong>2015</strong> (with<br />
sharply higher inflation that accrues <strong>to</strong> oil producers), and that the U.S. average nominal crude price will<br />
rise from $23.01 in 2001 <strong>to</strong> $62.81 in <strong>2015</strong>, in line with our estimate <strong>of</strong> growth for the PPI for All Commodities<br />
index, shown in Exhibit 31.
Industrial Portfolio Strategy<br />
<strong>The</strong> <strong>Inflation</strong> <strong>Cycle</strong> <strong>of</strong> <strong>2002</strong> <strong>to</strong> <strong>2015</strong> ⎯ April 19, <strong>2002</strong> -48- Legg Mason Wood Walker, Inc.<br />
Exhibit 38 – Net Exports and Imports <strong>of</strong> Oil, 1965-<strong>2015</strong>E. Oil prices shown below.<br />
60<br />
Projection<br />
Net oil exports (imports), Million barrels per day<br />
40<br />
20<br />
0<br />
(20)<br />
(40)<br />
Latin America<br />
Fm r. Sovie t U.<br />
Africa<br />
Middle East<br />
US/Canada<br />
Europe<br />
Japan<br />
Asia/Pacific<br />
ex-Japan<br />
(60)<br />
1965<br />
1968<br />
1971<br />
1974<br />
1977<br />
1980<br />
1983<br />
1986<br />
Crude oil price per barrel<br />
1989<br />
1992<br />
1995<br />
1998<br />
2001<br />
2004<br />
2007<br />
2010<br />
2013<br />
$80<br />
$60<br />
$40<br />
$20<br />
$0<br />
Projection<br />
Nominal<br />
$/barrel<br />
Real<br />
2000$/barrel<br />
1965<br />
1968<br />
1971<br />
1974<br />
1977<br />
1980<br />
1983<br />
1986<br />
1989<br />
1992<br />
1995<br />
1998<br />
2001<br />
2004<br />
2007<br />
2010<br />
2013<br />
Source: 1965 <strong>to</strong> 2000 data: 2001 BP Statistical Review <strong>of</strong> World Energy. Projection: 2001 and <strong>2002</strong> net exports from International Energy Agency<br />
and EIA Monthly Energy Review, March <strong>2002</strong>. 2001 price: EIA, Monthly Energy Review March <strong>2002</strong>. <strong>2002</strong> and later net export projections from<br />
Legg Mason based on EIA International Energy Annual <strong>2002</strong>. Oil price projections for 2003 and later are Legg Mason projections.
Industrial Portfolio Strategy<br />
<strong>The</strong> <strong>Inflation</strong> <strong>Cycle</strong> <strong>of</strong> <strong>2002</strong> <strong>to</strong> <strong>2015</strong> ⎯ April 19, <strong>2002</strong> -49- Legg Mason Wood Walker, Inc.<br />
Substitute Fuels – Promising, But Enough <strong>to</strong> Make a Difference?<br />
We believe that the use <strong>of</strong> substitutes first requires an inflation in the “old” fuel <strong>to</strong> stimulate the<br />
switch. <strong>The</strong> world has migrated in patterns from solid fuels (wood, coal), <strong>to</strong> liquid fuels (kerosene, oil,<br />
gasoline) and then <strong>to</strong> gasses (natural gas, hydrogen fuel cells in the future). For now, however, crude oil is,<br />
in many ways, the ideal fuel, and the only catalyst we see for developing a new energy infrastructure and<br />
encouraging fuel switching is prolonged, high prices for crude oil, which fulfills our thesis, anyway. Crude<br />
oil has an energy density that is over 50% higher than high-grade coal and 1,000 times greater than natural<br />
gas at atmospheric pressure; it can be transported cheaply via tanker or pipeline; it can be refined in<strong>to</strong> a<br />
range <strong>of</strong> products from jet fuel <strong>to</strong> home heating oil <strong>to</strong> petrochemicals; when refined in<strong>to</strong> gasoline, it burns<br />
cleanly and just 90 pounds <strong>of</strong> gasoline can fuel a 3,000 pound vehicle for hundreds <strong>of</strong> miles; and most importantly,<br />
it is available in very large quantities. More than for other commodities such as food or metals,<br />
the demand for energy and petroleum by-products <strong>of</strong>ten expands <strong>to</strong> utilize available supply. As early as<br />
1901, the oil gusher at Spindle<strong>to</strong>p, Texas, instantly doubled world oil supplies, and within a decade, au<strong>to</strong>s<br />
and trucks in the U.S. had soared from 8,000 vehicles fueled by a variety <strong>of</strong> fuels <strong>to</strong> a mass-produced, gasoline-powered<br />
fleet <strong>of</strong> 640,000 vehicles growing at over 40% per year.<br />
On the demand side <strong>of</strong> consumption, fuel switching is likely <strong>to</strong> occur, moving oil users away from<br />
low-value applications and more <strong>to</strong>ward high-value transportation uses. Low-value applications include<br />
power plants, industrial use <strong>of</strong> distillate and residual fuel oils, and residential/commercial use <strong>of</strong> distillate<br />
fuel. <strong>The</strong> U.S. has already made major strides in reducing low-value uses, but some developing markets<br />
are lagging behind. For example, U.S. non-transportation oil consumption went from 48% <strong>of</strong> <strong>to</strong>tal U.S.<br />
oil consumption in 1965 <strong>to</strong> 41% in 1981 and then <strong>to</strong> only 33% in 2000. Low-value oil consumption in the<br />
U.S. went from 23% <strong>of</strong> U.S. oil demand in 1965 <strong>to</strong> 18% in 1981 and then <strong>to</strong> only 10% in 2000. <strong>The</strong> rest <strong>of</strong><br />
the world presents more opportunities for replacing oil with other fuels such as coal or natural gas in lowvalue<br />
applications. In 1999, global oil consumption in low-value applications was 25% <strong>of</strong> <strong>to</strong>tal petroleum<br />
demand, representing substantial “low-hanging fruit” if high oil prices force all nations <strong>to</strong> use oil more efficiently.<br />
And on the supply side, we do see the door opening for a host <strong>of</strong> energy supply alternatives,<br />
but they face a chicken and egg conundrum. <strong>The</strong> modern petroleum market has a highly efficient system<br />
<strong>of</strong> delivering around 76 million barrels <strong>of</strong> oil <strong>to</strong> consumers around the world every day, so even those crude<br />
oil substitutes that are able <strong>to</strong> prove some cost or performance advantage must reckon with the fact that a<br />
new retail distribution infrastructure will require many years <strong>to</strong> develop fully, and the development <strong>of</strong> that<br />
infrastructure will not come, in our view, unless crude oil prices are high for a similar period. Still, there are<br />
promising alternatives, such as liquefied natural gas (LNG) and the oil sands <strong>of</strong> Canada.<br />
<strong>The</strong> growing use <strong>of</strong> LNG solves two problems: what <strong>to</strong> do with excess natural gas in oil-producing regions<br />
with low domestic energy demand needs, and how <strong>to</strong> expand fuel consumption in areas with little native<br />
fossil fuel resources, such as Japan and China. LNG is natural gas that has been liquefied through pressurization<br />
and cooling <strong>to</strong> low temperatures in a liquefaction plant located close <strong>to</strong> a natural gas source. <strong>The</strong><br />
liquefied gas is loaded on<strong>to</strong> a special double-hulled refrigerated tanker, transported across the water <strong>to</strong> an<br />
unloading terminal, and converted back <strong>to</strong> gaseous form in a regasification plant. <strong>The</strong> process is energyintensive<br />
and capital-intensive, but LNG provides a supply option that bypasses the use <strong>of</strong> gas pipelines,<br />
which may be impractical (e.g., distance) or nearly impossible (e.g., distant islands). Depending on the gas<br />
production cost and the distance between source and destination, <strong>to</strong>tal costs <strong>of</strong> natural gas via LNG range<br />
from about $2.50 <strong>to</strong> $4.00 per million Btu (MMBtu), making it very competitive with natural gas supplied<br />
via pipelines. For comparison purposes, the average U.S. city gate natural gas price in 1999 was $3.01/
Industrial Portfolio Strategy<br />
<strong>The</strong> <strong>Inflation</strong> <strong>Cycle</strong> <strong>of</strong> <strong>2002</strong> <strong>to</strong> <strong>2015</strong> ⎯ April 19, <strong>2002</strong> -50- Legg Mason Wood Walker, Inc.<br />
MMBtu, and in 2000 the average was $4.49/MMBtu. <strong>The</strong> average for the first 11 months <strong>of</strong> 2001 was<br />
$5.91/MMBtu, but prices in recent months have dropped below $4.00/MMBtu as the natural gas shortages<br />
<strong>of</strong> early 2001 have eased in the record warm winter <strong>of</strong> 2001/02.<br />
Asia has made extensive use <strong>of</strong> LNG where pipelines are not as feasible, but the capital investments<br />
for LNG are large. LNG is competitive in the U.S., but its greatest potential is in serving areas such as<br />
East Asia with very limited gas supplies and almost no pipeline infrastructure. LNG currently accounts for<br />
6% <strong>of</strong> the world’s natural gas consumption and 26% <strong>of</strong> cross-border gas flows. <strong>The</strong> largest importers <strong>of</strong><br />
LNG are the island nation <strong>of</strong> Japan (53% <strong>of</strong> the world <strong>to</strong>tal), South Korea (14%), France (8%) and Spain<br />
(6%), and the largest LNG exporters are Indonesia (29%), Algeria (19%), Malaysia (15%), and Qatar<br />
(10%). Well over 90% <strong>of</strong> Japan’s and South Korea’s natural gas supply is provided by LNG, and China is<br />
preparing <strong>to</strong> follow suit by building its own LNG terminals, beginning with a $600 million, 3 million metric<br />
<strong>to</strong>n per year terminal in Shenzhen (Guangdong Province) scheduled <strong>to</strong> be completed in 2005. Three million<br />
metric <strong>to</strong>ns is the equivalent <strong>of</strong> 146 billion cubic feet, or about 17% <strong>of</strong> China’s natural gas consumption in<br />
2000. <strong>The</strong> capital cost differential between LNG projects such as this and a planned $18 billion PetroChina<br />
gas development and pipeline project <strong>to</strong> connect Shanghai with western China gas resources, providing only<br />
three <strong>to</strong> five times as much gas as the Shenzhen LNG terminal, illuminates LNG’s attractiveness. <strong>The</strong> presence<br />
<strong>of</strong> some <strong>of</strong> the world’s largest known gas deposits in Irkutsk, Siberia, less than 2,000 miles from Beijing,<br />
creates another option for China in lieu <strong>of</strong> LNG, but such a pipeline requires many years <strong>to</strong> build.<br />
Canadian oil sands are another intriguing alternative supply option, but high capital costs and long<br />
project lead times hinder the growth potential for the next decade. In a remote section <strong>of</strong> Alberta, Canada<br />
lies a viscous mixture <strong>of</strong> sand, bitumen, clay and water with the consistency <strong>of</strong> cold molasses known as<br />
“oil sands,” which contains at least 300 billion barrels <strong>of</strong> economic reserves <strong>of</strong> oil, and <strong>to</strong>tal deposits (most<br />
<strong>of</strong> which are beyond current economic limits) <strong>of</strong> 1.7 trillion barrels <strong>of</strong> oil. <strong>The</strong> presence <strong>of</strong> 300 billion barrels<br />
<strong>of</strong> recoverable oil reserves — greater than the 262 billion barrels <strong>of</strong> proved reserves in Saudi Arabia —<br />
in the oil sands <strong>of</strong> Alberta, Canada, is attracting substantial investment. Engineering News Record magazine<br />
estimates that there are now 34 oil sands projects either planned or under construction, with a <strong>to</strong>tal cost <strong>of</strong><br />
U.S. $28.9 billion and 2.9 million barrels per day <strong>of</strong> planned oil production. <strong>The</strong> new planned or in-process<br />
projects detailed by ENR average $10,000 <strong>of</strong> capital investment per barrel per day <strong>of</strong> oil production, compared<br />
with $5,500 for Persian Gulf OPEC nations, so we believe their construction is more likely <strong>to</strong> occur<br />
on schedule if oil prices inflate. Of the new capacity for which extraction methods are known, 80% use<br />
truck-and-shovel mining, which is a key potential market for Joy Global’s shovels and Caterpillar’s mining<br />
trucks, while 20% use in-situ (drilling) extraction. To put the oil sands in perspective, however, the incremental<br />
oil supply that would be provided by 2010 if all <strong>of</strong> the known projects are completed represents<br />
only 8% <strong>of</strong> our forecast <strong>of</strong> incremental growth in world oil demand over that period. Like LNG<br />
projects, investment in the oil sands requires very long lead times and high capital investments. Some<br />
planned projects will not begin oil production until 2010, so they will have little ability <strong>to</strong> influence oil<br />
prices over the next decade, in our view. However, the decline in production costs and the location in a secure<br />
non-OPEC location ensure that oil sands production will attract investment in the coming years if our<br />
thesis is correct.<br />
<strong>The</strong> security <strong>of</strong> OPEC oil supply, which has implications for supply, demand, and substitutes within the energy<br />
markets, is an issue we address later in this report. But next, we discuss the outlook for agricultural<br />
commodities, which are driven by many <strong>of</strong> the same global supply and demand fac<strong>to</strong>rs as oil, and consume<br />
substantial energy in their production.
Industrial Portfolio Strategy<br />
<strong>The</strong> <strong>Inflation</strong> <strong>Cycle</strong> <strong>of</strong> <strong>2002</strong> <strong>to</strong> <strong>2015</strong> ⎯ April 19, <strong>2002</strong> -51- Legg Mason Wood Walker, Inc.<br />
U.S. Farm Commodity Export and <strong>Inflation</strong> Prospects, <strong>2002</strong> <strong>to</strong> <strong>2015</strong>E<br />
U.S. Farm Commodity <strong>Price</strong> <strong>Cycle</strong>s<br />
In Exhibit 40, we show the seven inflationary or deflationary price cycles <strong>of</strong> the PPI for Farm Products<br />
(PPI-Farm) index from 1870 <strong>to</strong> present. <strong>The</strong> cycles have lasted an average <strong>of</strong> 19 years, with prices<br />
in the average inflation cycle rising 8.0% per year, in a range <strong>of</strong> 6.2% <strong>to</strong> 9.8% per year. <strong>Price</strong>s in the average<br />
deflation cycle declined 2.6% per year, in a range <strong>of</strong> minus 8.7% <strong>to</strong> positive 1.6%. We find it interesting<br />
that inflation cycles are more uniform and regular than cycles <strong>of</strong> deflation in the farm industry. As Exhibit<br />
40 shows, some <strong>of</strong> the determinants <strong>of</strong> those cycles have been rising or falling input costs, farm productivity,<br />
and acreage, but one <strong>of</strong> the most important determinants has been the growth <strong>of</strong> exports. For clues as <strong>to</strong><br />
the direction <strong>of</strong> U.S. agricultural export growth we turn <strong>to</strong> the U.S. dollar. <strong>The</strong> declines in the agricultural<br />
trade-weighted U.S. dollar from 1970 <strong>to</strong> 1978 and 1985 <strong>to</strong> 1993 were associated with a surge in the export<br />
<strong>of</strong> U.S. agricultural products, just as U.S. dollar strength in 1978 <strong>to</strong> 1985 and 1995 <strong>to</strong> <strong>2002</strong> pressured U.S.<br />
food exports. An important difference between agricultural exports and oil exports is that the latter is denominated<br />
in U.S. dollars worldwide, whereas the fluctuations in home currency have a disproportionate<br />
effect on farmers (and numerous other commodity producers, for that matter).<br />
We show in Exhibit 39 that the s<strong>to</strong>ck price <strong>of</strong> Deere & Company (DE) has a close, positive relationship<br />
with U.S. agricultural exports, and that is the primary focus <strong>of</strong> this section <strong>of</strong> our report. Noted agricultural<br />
analyst and his<strong>to</strong>rian Bill Hudson <strong>of</strong> the ProExporter Network in Olathe, Kansas, states that the U.<br />
S. has about 5% <strong>of</strong> the world's population, but about one-fifth <strong>of</strong> the world's farmland capacity, a fact that<br />
underscores exports as the key <strong>to</strong> farmer success. In Exhibit 41, we dismiss the current controversy surrounding<br />
U.S. Farm Bill delays, showing that from an inves<strong>to</strong>r's viewpoint, DE s<strong>to</strong>ck moves inversely <strong>to</strong><br />
government assistance. Since most<br />
farm aid flows <strong>to</strong> either very small<br />
or very large farms, our view has<br />
been that smaller farmers are not<br />
Deere's cus<strong>to</strong>mer base, and larger<br />
farms tend <strong>to</strong> maintain and turn<br />
over their fleets on a more regular<br />
schedule.<br />
We see another food price inflation<br />
on the horizon. If the world<br />
becomes a more dangerous place<br />
in the <strong>2002</strong> <strong>to</strong> <strong>2015</strong> period, we<br />
doubt food security will be subordinated<br />
<strong>to</strong> the WTO-inspired<br />
movement <strong>to</strong> lower state support<br />
and protectionism for agriculture.<br />
If, on the other hand, the world<br />
experiences an explosion <strong>of</strong><br />
growth, the combination <strong>of</strong> higher<br />
input costs and strong demand<br />
Exhibit 39 – Deere S<strong>to</strong>ck Is Driven By Food Exports<br />
Real U.S. Ag-Exports ($ Mil.)<br />
$110,000<br />
$100,000<br />
$90,000<br />
$80,000<br />
$70,000<br />
$60,000<br />
$50,000<br />
$40,000<br />
$30,000<br />
$20,000<br />
1962<br />
1967<br />
Deere Performance Tracks U.S. Food<br />
Exports<br />
1972<br />
1977<br />
Source: USDA, S&P Compustat, Legg Mason estimates <strong>2002</strong> <strong>to</strong> <strong>2015</strong><br />
1982<br />
Real Export CAGR<br />
1962 <strong>to</strong> 1996 =<br />
2.7%/year<br />
1987<br />
1992<br />
1997<br />
<strong>2002</strong>E<br />
LM<br />
Ests.<br />
Real U.S. Farm Product Exports, U.S. $ Bil. (Left)<br />
2007E<br />
Deere S<strong>to</strong>ck Relative <strong>to</strong> the S&P Composite (Right)<br />
Real<br />
CAGR 1996 <strong>to</strong><br />
<strong>2015</strong>E = 2.4/year<br />
2012E<br />
14.0%<br />
12.0%<br />
10.0%<br />
8.0%<br />
6.0%<br />
4.0%<br />
2.0%<br />
Deere Relative <strong>to</strong> the S&P 500
Industrial Portfolio Strategy<br />
<strong>The</strong> <strong>Inflation</strong> <strong>Cycle</strong> <strong>of</strong> <strong>2002</strong> <strong>to</strong> <strong>2015</strong> ⎯ April 19, <strong>2002</strong> -52- Legg Mason Wood Walker, Inc.<br />
Exhibit 40 – <strong>The</strong> PPI <strong>Price</strong> His<strong>to</strong>ry and Our Estimates For U.S. Agriculture, 1870 <strong>to</strong> <strong>2015</strong>E<br />
1,000<br />
100<br />
10<br />
1870 <strong>to</strong><br />
1896<br />
CAGR<br />
(2.6)%<br />
1896 <strong>to</strong><br />
1919<br />
CAGR<br />
6.2%<br />
Horses, land grants,<br />
larger farms.<br />
U.S. Agricultural <strong>Price</strong> <strong>Cycle</strong>s, 1870 <strong>to</strong> <strong>2015</strong>E<br />
U.S. urban<br />
migration,<br />
farm exports,<br />
W.W. I.<br />
1919 <strong>to</strong><br />
1932<br />
CAGR<br />
(8.7)%<br />
1932 <strong>to</strong><br />
1951<br />
CAGR<br />
7.9%<br />
Supply<br />
controls,<br />
machinery,<br />
W.W. II.<br />
Mechanization, postwar<br />
deflation, trade<br />
barriers.<br />
1951<br />
<strong>to</strong> 1969<br />
CAGR<br />
(1.1)%<br />
1969 <strong>to</strong><br />
1982<br />
CAGR<br />
9.8%<br />
Exports<br />
<strong>to</strong> EU<br />
and<br />
USSR,<br />
costly<br />
fertilizer<br />
and fuel.<br />
Post-war<br />
price<br />
support overproduction,<br />
more<br />
fertilizer.<br />
1982 <strong>to</strong><br />
2001<br />
CAGR<br />
1.6%<br />
2001 <strong>to</strong><br />
<strong>2015</strong>E<br />
CAGR<br />
6.1%<br />
Export<br />
decline,<br />
lower<br />
U.S.<br />
export<br />
market<br />
share,<br />
strong<br />
U.S. $.<br />
Exports,<br />
costly<br />
fuel and<br />
fertilizer,<br />
weak $.<br />
1<br />
1870<br />
1880<br />
1890<br />
1900<br />
1910<br />
1920<br />
1930<br />
1940<br />
1950<br />
1960<br />
1970<br />
1980<br />
1990<br />
2000<br />
2010E<br />
PPI Farm Products<br />
SUPPLY-SIDE ISSUES<br />
DEMAND-SIDE ISSUES<br />
U.S. Growth Comm'l. U.S. U.S. U.S. Nominal Real<br />
PPI- Farm CAGR % Farm U.S. Rate Fertilizer Corn Real Meat (3) Growth Growth<br />
Products <strong>of</strong> PPI Horses Farm <strong>of</strong> U.S. Used Yield World GDP (2) Con- Rate <strong>of</strong> Rate (4)<br />
<strong>Inflation</strong> and Farm and Trac<strong>to</strong>r Acreage Lbs/Acre Bu./acre War? Per sumption U.S. <strong>of</strong> Farm<br />
Deflation Products Mules Unit All Major Growth Growth (1) YES Capita Growth Food & Food<br />
Period Yrs. Index Growth Growth Crops Rate Rate or NO Growth Rate Exports Exports<br />
1870 <strong>to</strong> 1896 26 (2.6)% 3.3% na 3.2% 3.7% 0.2% NO 2.7% na 1.7% 4.3%<br />
1896 <strong>to</strong> 1919 23 6.2% 1.1% na 1.7% 3.9% (0.1)% YES 2.1% na 5.2% (1.0)%<br />
1919 <strong>to</strong> 1932 13 (8.7)% (3.0)% 15.4% 0.2% (3.6)% (0.7)% NO (1.4)% 0.9% (11.3)% (2.6)%<br />
1932 <strong>to</strong> 1951 19 7.9% (4.4)% 7.0% (0.4)% 9.1% 2.5% YES 4.0% 1.9% 9.3% 1.4%<br />
1951 <strong>to</strong> 1969 18 (0.7)% nmf 1.5% (1.0)% 4.5% 4.0% NO 2.3% 3.6% 2.2% 3.0%<br />
1969 <strong>to</strong> 1982 13 9.8% nmf -0.5% 1.7% 0.02% 1.9% YES (5) 1.4% 1.0% 14.9% 5.1%<br />
1982 <strong>to</strong> 2001 19 1.6% nmf na (0.6)% 1.2% 1.6% NO 2.5% 1.6% 1.9% 0.4%<br />
2001 <strong>to</strong> <strong>2015</strong>E 14E 6.1% nmf ne ne 0.0%E 1.0%E 25%E ne ne 11.2%E 5.0%E<br />
(1) To reduce the effect <strong>of</strong> weather, we compare three-year centered averages for each period, with a <strong>2002</strong> corn yield estimate from PRX ProExporter.<br />
(2) Real GNP prior <strong>to</strong> 1947.<br />
(3) Red meat, pork and poulty; per-capita values multiplied by U.S. resident population annually; CAGR between periods.<br />
(4) Growth rate <strong>of</strong> real U.S. food exports is nominal exports minus the PPI for agricultural products; trade-weighted defla<strong>to</strong>r data were not available.<br />
(5) <strong>The</strong> Great Society “war” on poverty, Vietnam, and the Oil Embargoes <strong>of</strong> the 1970s, the latter being more global in their effect.<br />
Source: PPI - Farm Products 1870 <strong>to</strong> 1889 Warren & Pearson study, 1890 <strong>to</strong> 1969 PPI is the shipment-w eighted annual averages <strong>of</strong> monthly prices prepared by<br />
the U.S. BLS, 1970 <strong>to</strong> Present is the PPI Farm Products (NSA), from the U.S. BLS, all Indices have been placed in a continuous rew eighted series so that the 12-<br />
month average <strong>of</strong> 2000 = 100; horses, mules and trac<strong>to</strong>rs from USDA and U.S. Census; acreage is from the USDA and data include corn , w heat, oats, barley,<br />
flaxseed, soybeans, sorghum, rye, pota<strong>to</strong>es, sw eet pota<strong>to</strong>es, rice, sugarcane, sugarbeets, peanuts, hay, cot<strong>to</strong>n, and <strong>to</strong>bacco; fertilizer usage, corn yield; meat<br />
consumption and food exports are from USDA, NASS and predecessor bureaus; food exports 1901 <strong>to</strong> 1933 is from the FATUS section <strong>of</strong> the USDA and the U.S.<br />
Census, agricultural exports from 1934 <strong>to</strong> 2000 data are from the USDA, older food exports data for the years 1870 <strong>to</strong> 1900 are the dollar value <strong>of</strong> U.S. exports<br />
<strong>of</strong> cot<strong>to</strong>n, <strong>to</strong>bacco, w heat, flour, animal fats and oils, fruits, nuts, and 1870 <strong>to</strong> 1880 are cot<strong>to</strong>n, <strong>to</strong>bacco and w heat only; GNP (1870 <strong>to</strong> 1947) and GDP (1947 <strong>to</strong><br />
2001) per capita based upon NBER and U.S. Census data
Industrial Portfolio Strategy<br />
<strong>The</strong> <strong>Inflation</strong> <strong>Cycle</strong> <strong>of</strong> <strong>2002</strong> <strong>to</strong> <strong>2015</strong> ⎯ April 19, <strong>2002</strong> -53- Legg Mason Wood Walker, Inc.<br />
may strain supply long enough<br />
<strong>to</strong> create a somewhat typical<br />
PPI-Farm inflation cycle. Lost in<br />
20 years <strong>of</strong> energy deflation<br />
thinking, in our view, is the fact<br />
that higher energy costs have a<br />
significant bearing on farm<br />
prices. According <strong>to</strong> the USDA,<br />
fertilizer, fuel and electricity account<br />
for 40% <strong>to</strong> 45% <strong>of</strong> the <strong>to</strong>tal<br />
variable costs in the production<br />
<strong>of</strong> corn, and about 20% <strong>of</strong><br />
the variable cost <strong>of</strong> soybean production.<br />
Corn is an especially<br />
heavy user <strong>of</strong> anhydrous ammonia<br />
(natural gas derived) fertilizer,<br />
but soybeans receive most<br />
<strong>of</strong> their nitrogen needs from the<br />
atmosphere.<br />
Exhibit 41 – Deere S<strong>to</strong>ck Is Not Driven By Farm Aid<br />
Real U.S. Farm Aid ($Bil.) (INVERSE)<br />
$0<br />
$5<br />
$10<br />
$15<br />
$20<br />
$25<br />
1962<br />
1967<br />
Source: USDA, S&P Compustat, Legg Mason estimates <strong>2002</strong>.<br />
Another fuel-price spillover<br />
effect could be in the ethanol markets. Each billon gallons <strong>of</strong> ethanol fuel oxygenate requires approximately<br />
365 million bushels <strong>of</strong> corn, and from a level <strong>of</strong> just 300 million bushels in the 1980s, corn used <strong>to</strong><br />
produce ethanol rose <strong>to</strong> 565 million bushels in 1999 <strong>to</strong> 2000 (6% <strong>of</strong> production). If all <strong>of</strong> California's fuel<br />
oxygenation needs were eventually <strong>to</strong> be met by ethanol, 350 million additional bushels <strong>of</strong> corn would be<br />
needed. Furthermore, if New York and Connecticut eventually turn <strong>to</strong> 100% ethanol, then 250 million bushels<br />
<strong>of</strong> corn would be needed.<br />
Our forecast <strong>of</strong> food price inflation is not without controversy. In fact, his<strong>to</strong>ry <strong>of</strong>ten suggests that increased<br />
grain trade leads <strong>to</strong> lower prices. Agricultural analyst Bill Hudson reminds us that when the U.K.<br />
repealed the Corn Laws in 1846, British imports <strong>of</strong> grain grew 4% per year for the next 68 years, but the<br />
price <strong>of</strong> grain actually declined as new acreage expanded in the U.S., which was then a developing country.<br />
Robert Malthus (b. 1766, d.1834), in his Principle <strong>of</strong> Population series, failed <strong>to</strong> recognize the ability <strong>of</strong><br />
technology <strong>to</strong> address the supply side constraints on agricultural production, and analysts have fallen in<strong>to</strong><br />
the Malthusian trap ever since. Mr. Hudson also states that a reduction <strong>of</strong> world subsidies could be deflationary,<br />
since world economies spend about $350 billion per year on farm support, causing expenditures <strong>to</strong><br />
be 47% above the true world price <strong>of</strong> food. Our view is that hydrocarbon inflation plus a positive demand<br />
shock could be catalysts for a food price inflation.<br />
<strong>The</strong> U.S. Farm Export Outlook<br />
<strong>The</strong> modern grain trade s<strong>to</strong>ry is one <strong>of</strong> shifting grain demand “hubs,” shown in Exhibit 42. We note<br />
that combined world imports <strong>of</strong> corn, wheat and soybeans grew at an annual rate <strong>of</strong> 8.6% from 1970 <strong>to</strong><br />
1980, but stagnated at a rate <strong>of</strong> minus 0.1% from 1980 <strong>to</strong> 1995 as the decline <strong>of</strong> EU and FSU imports overshadowed<br />
growth in the rest <strong>of</strong> the world. But from 1995 <strong>to</strong> 2000, after the roles <strong>of</strong> the EU and FSU were<br />
minimized in terms <strong>of</strong> their effect on the world grain import markets, world grain trade increased 3.7% per<br />
1972<br />
1977<br />
1982<br />
1987<br />
Deere Performs Inversely <strong>to</strong><br />
Farm Aid Payments<br />
Real U.S. Gov. Pmnt. <strong>to</strong> Farms, INVERTED AXIS, U.S. $96 Bil. (Left)<br />
Deere S<strong>to</strong>ck Relative <strong>to</strong> the S&P Composite (Right)<br />
1992<br />
1997<br />
<strong>2002</strong>E<br />
14.0%<br />
12.0%<br />
10.0%<br />
8.0%<br />
6.0%<br />
4.0%<br />
2.0%<br />
0.0%<br />
Deere Relative <strong>to</strong> the S&P
Industrial Portfolio Strategy<br />
<strong>The</strong> <strong>Inflation</strong> <strong>Cycle</strong> <strong>of</strong> <strong>2002</strong> <strong>to</strong> <strong>2015</strong> ⎯ April 19, <strong>2002</strong> -54- Legg Mason Wood Walker, Inc.<br />
year despite rolling recessions.<br />
We look for a continuation <strong>of</strong><br />
trend growth at a 3.2% rate from<br />
<strong>2002</strong> <strong>to</strong> <strong>2015</strong>, shown in Exhibit<br />
43. We believe the key is growth<br />
in markets outside the EU and<br />
FSU, <strong>to</strong> include Central and<br />
South America, Africa, the Middle<br />
East and, <strong>of</strong> course, Asia-<br />
Pacific. For example, higher petroleum<br />
prices would stimulate<br />
food demand in the predominantly<br />
Islamic countries, which<br />
account for about 27% <strong>of</strong> the<br />
world corn trade. As we have<br />
stated, we believe that U.S. farmers<br />
have been priced out <strong>of</strong> many<br />
markets by the strong U.S. dollar,<br />
but the fac<strong>to</strong>rs we outline in this<br />
report may change that situation.<br />
<strong>The</strong> U.S. grain export share<br />
also has been affected by competition.<br />
Total U.S. corn, wheat<br />
and soybean exports from 1970<br />
<strong>to</strong> 1979 were 805 million metric<br />
<strong>to</strong>nes (MMT), and the s<strong>to</strong>cks-<strong>to</strong>use<br />
averaged 18%. U.S. grain<br />
exports <strong>to</strong> the EU and FSU were<br />
particularly strong in the 1970s,<br />
as well as part <strong>of</strong> the 1980s in the<br />
case <strong>of</strong> the FSU. From 1980 <strong>to</strong><br />
1989, grain import demand from<br />
the EU collapsed, and though <strong>to</strong>tal<br />
U.S. exports for that period<br />
were 1.05 billion metric <strong>to</strong>nnes,<br />
the average s<strong>to</strong>cks-<strong>to</strong>-use was<br />
about 37%. In the 1990s, <strong>to</strong>tal<br />
U.S. corn, wheat and soybean<br />
exports were 982 MMT, continuing<br />
a period <strong>of</strong> stagnation as<br />
Exhibit 42 – Grain Import Hubs Shift Over Time<br />
Bushels Per Capita Imported<br />
Source: PRX ProExporter data and format, Legg Mason estimates <strong>2002</strong> <strong>to</strong> <strong>2015</strong><br />
Exhibit 43 – <strong>The</strong> Transition from Old <strong>to</strong> New Grain Markets<br />
Millions <strong>of</strong> Metric Tonnes Per Year<br />
12.00<br />
10.00<br />
8.00<br />
6.00<br />
4.00<br />
2.00<br />
0.00<br />
(2.00)<br />
(4.00)<br />
350<br />
300<br />
250<br />
200<br />
150<br />
100<br />
50<br />
0<br />
Grain Import Hubs Through His<strong>to</strong>ry Drive Exports; Is Non-EU/FSU Next?<br />
1970<br />
1850<br />
1860<br />
1870<br />
Source: USDA, PRX ProExporter format, Legg Mason estimates <strong>2002</strong> <strong>to</strong> <strong>2015</strong><br />
the grain imports <strong>of</strong> the FSU collapsed, and Brazil became a major competi<strong>to</strong>r <strong>to</strong> the U.S. in soybeans.<br />
European imports had previously collapsed in the 1980s as Common Agricultural Policy turned the EU<br />
from a net importer <strong>to</strong> an exporter <strong>of</strong> heavily subsidized grain, although the trend for EU soybean imports<br />
has since been higher. <strong>The</strong> effect on U.S. grain export share is shown in Exhibit 44. Although we look for<br />
continued pressure on U.S. soybean export market share, we believe that U.S. farmers are well positioned <strong>to</strong><br />
1880<br />
1890<br />
1900<br />
1910<br />
1920<br />
1930<br />
1940<br />
1950<br />
1960<br />
Grain Imports Bu./Capita Western Europe<br />
Grain Imports Bu./Capita FSU<br />
1970<br />
1980<br />
1990<br />
World Excluding the EU and FSU Grain + Meat Equivalent<br />
Grain Impurts Bu./Capita United Kingdom<br />
World Imports <strong>of</strong> Corn, Wheat & Soybeans<br />
<strong>The</strong> effect <strong>of</strong> the EU and FSU import decline<br />
is over, and the other world trade continues<br />
unabated.<br />
1970 <strong>to</strong><br />
1980 =<br />
8.6%<br />
CAGR<br />
1975<br />
EU-15<br />
1980<br />
FSU<br />
1985<br />
1980 <strong>to</strong><br />
1995 =<br />
(0.1)%<br />
CAGR<br />
1990<br />
1995<br />
1995 <strong>to</strong><br />
2000 =<br />
3.7%<br />
CAGR<br />
2000<br />
Asia Rest <strong>of</strong> World EU-15 FSU<br />
2005E<br />
2000<br />
2000 <strong>to</strong> <strong>2015</strong><br />
= 3.2%E<br />
CAGR<br />
Asia<br />
LM<br />
Ests.<br />
2010<br />
Rest <strong>of</strong> World<br />
2010E<br />
2020<br />
LM<br />
Ests.<br />
<strong>2015</strong>E
Industrial Portfolio Strategy<br />
<strong>The</strong> <strong>Inflation</strong> <strong>Cycle</strong> <strong>of</strong> <strong>2002</strong> <strong>to</strong> <strong>2015</strong> ⎯ April 19, <strong>2002</strong> -55- Legg Mason Wood Walker, Inc.<br />
hold on<strong>to</strong> and improve corn<br />
share, and wheat share should<br />
stabilize, in our view.<br />
Exhibit 44 – <strong>The</strong> U.S. Grain Trade Market Share<br />
100%<br />
90%<br />
80%<br />
70%<br />
60%<br />
50%<br />
40%<br />
30%<br />
20%<br />
U.S. Grain Export Market Share: Major competi<strong>to</strong>rs include<br />
Argentina & Brazil (Soybeans, Corn) and Europe & Canada<br />
(Wheat)<br />
1970<br />
1972<br />
1974<br />
1976<br />
1978<br />
1980<br />
1982<br />
1984<br />
1986<br />
1988<br />
1990<br />
1992<br />
1994<br />
1996<br />
1998<br />
2000<br />
<strong>2002</strong>E<br />
2004E<br />
2006E<br />
2008E<br />
2010E<br />
2012E<br />
2014E<br />
U.S. Export Share <strong>of</strong> Corn+Wheat+Soybeans By Weight<br />
U.S. Corn Share By Weight<br />
U.S. Soybean Share By Weight<br />
U.S. Wheat Share By Weight<br />
Source: USDA, Legg Mason estimates <strong>2002</strong> <strong>to</strong> <strong>2015</strong><br />
LM Ests.<br />
China holds long-term promise<br />
as an importer <strong>of</strong> U.S.<br />
foodstuffs, in our view.<br />
China's GDP grew by an amazing<br />
340% in the 1990s. According<br />
<strong>to</strong> the Scowcr<strong>of</strong>t Group, 490<br />
million Chinese are poised <strong>to</strong><br />
achieve true "middle class"<br />
status or better by 2010, implying<br />
dietary enrichment and urban<br />
migration. We are careful,<br />
however, not <strong>to</strong> set great expectations<br />
for U.S. agricultural exports<br />
<strong>to</strong> the Chinese market,<br />
largely because China has<br />
shown such great ingenuity in<br />
supplying its own food needs<br />
internally. But our view is that<br />
three facts will weigh on<br />
China’s food self-sufficiency in<br />
the long term: (1) China's ratio<br />
<strong>of</strong> arable acreage <strong>to</strong> population<br />
is one <strong>of</strong> the lowest among fastgrowing<br />
countries in the developing world, (2) China’s per capita GDP growth is among the highest in the developing<br />
world, and (3) China is not endowed with the hydrocarbon resources that will enable low-cost production<br />
<strong>of</strong> food if we are correct about the upward trend in fuel and fertilizer input costs. Water scarcity may<br />
also be a fac<strong>to</strong>r affecting grain production in the Asia Pacific region, as rapid urbanization and related demands<br />
for water compete with agriculture. Contradicting reports that exaggerate the problem in Asia, however,<br />
USDA states that farming accounts for 64% <strong>of</strong> Asia Pacific water use versus 79% globally.<br />
In the near term, we believe that China has no intention <strong>of</strong> disclosing its food import needs, or destabilizing<br />
its agricultural sec<strong>to</strong>r. Not unlike most countries with a long his<strong>to</strong>ry and a record <strong>of</strong> success, we see<br />
China as forthright when it is in a position <strong>of</strong> strength, passive when it is weakened, and cunning as it begins<br />
ascendancy, and we believe China is currently in a period <strong>of</strong> ascendancy. We further believe China’s task <strong>to</strong>day<br />
is <strong>to</strong> encourage reform and commercialization, while s<strong>of</strong>tening the blow <strong>of</strong> competition for the agricultural<br />
and state-owned enterprise (SOE) sec<strong>to</strong>rs. For example, according <strong>to</strong> China's agriculture ministry, the<br />
country's 800 million agricultural residents earned an average 2,300 yuan ($278) per capita last year, and a<br />
majority had never even heard <strong>of</strong> the WTO. In addition, about 78 million rural workers, mostly from agricultural<br />
backgrounds, migrated <strong>to</strong> the cities <strong>to</strong> find work last year. Chinese Minister <strong>of</strong> Agriculture Du Quinglin<br />
has stated that China will "try every means WTO allows" <strong>to</strong> protect the post-WTO Chinese agricultural sec<strong>to</strong>r<br />
from upheaval. Nevertheless, the new tariff-rate quota system resulting from WTO accession slowly scales<br />
back the power <strong>of</strong> the State Trading Enterprises, leading <strong>to</strong> more private import company control over im-
Industrial Portfolio Strategy<br />
<strong>The</strong> <strong>Inflation</strong> <strong>Cycle</strong> <strong>of</strong> <strong>2002</strong> <strong>to</strong> <strong>2015</strong> ⎯ April 19, <strong>2002</strong> -56- Legg Mason Wood Walker, Inc.<br />
ports, where demand is believed <strong>to</strong> be<br />
greater and less subject <strong>to</strong> political<br />
considerations.<br />
Despite the competitive pressure,<br />
we believe Chinese agriculture<br />
should not be underestimated. Chinese<br />
production <strong>of</strong> corn, wheat and<br />
rice grew from about 100 MMT in the<br />
early 1960s, just before a disastrous<br />
famine, <strong>to</strong> 200 MMT in the late 1970s,<br />
as labor and land were applied <strong>to</strong> the<br />
shortage problem. Since China introduced<br />
certain agricultural market reforms<br />
in 1978, followed by an additional<br />
round in the mid-1990s termed<br />
the "Governor's Grain Bag" policy,<br />
<strong>to</strong>tal agricultural staples production<br />
rose <strong>to</strong> about 390 MMT in the late<br />
1990s, an increase <strong>of</strong> 90% in two decades.<br />
China set its tariff rate quotas<br />
(TRQs) high enough for corn and<br />
wheat that they are unlikely <strong>to</strong> be a<br />
problem for exporters <strong>to</strong> China in<br />
FY02, and notably absent is a TRQ<br />
for soybeans, <strong>of</strong> which China has<br />
been a prodigious importer. In fact,<br />
Chinese imports <strong>of</strong> soybeans represent<br />
about 20% <strong>of</strong> the global oilseed<br />
trade, and China imported approximately<br />
14 MMT <strong>of</strong> soybeans last<br />
year. China has maintained a liberal<br />
import policy with respect <strong>to</strong> soybean<br />
imports <strong>to</strong> feed its growing domestic<br />
needs, so we are not alarmed by the<br />
genetically modified organism (GMO)<br />
talk, which may simply be posturing<br />
<strong>to</strong> protect other segments <strong>of</strong> the Chinese<br />
farming sec<strong>to</strong>r.<br />
Exhibit 45 – Key Drivers In Meat Product Trade<br />
U.S. Meat Consumed Per Capita<br />
25,000<br />
20,000<br />
15,000<br />
10,000<br />
200 lbs.<br />
180 lbs.<br />
160 lbs.<br />
140 lbs.<br />
120 lbs.<br />
100 lbs.<br />
Meat Consumption Is Income-Dependent<br />
1935<br />
80 lbs.<br />
$5,000 $10,000 $15,000 $20,000 $25,000 $30,000 $35,000<br />
Real GDP Per Capita ($96, Uses GNP pre-1947)<br />
Meat remains one <strong>of</strong> the most exciting<br />
s<strong>to</strong>ries in agricultural trade. In 0<br />
Exhibit 45 we show that meat consumption<br />
is income-driven, the world<br />
U.S. Meat Exports, 000s Tons (Left)<br />
meat market is growing, and we believe<br />
U.S. market share should benefit Source: USDA, Legg Mason estimates <strong>2002</strong> <strong>to</strong> <strong>2015</strong><br />
5,000<br />
0<br />
12,000<br />
10,000<br />
8,000<br />
6,000<br />
4,000<br />
2,000<br />
1980<br />
1980<br />
1982<br />
1984<br />
1986<br />
1988<br />
1990<br />
1971<br />
1992<br />
2001<br />
As previous commodity charts have shown, the peak<br />
rate <strong>of</strong> consumption growth in the U.S. occurred at<br />
roughly the same time, from the mid-1930s <strong>to</strong> the early<br />
1970s, or from about $7,500 <strong>of</strong> per capita real GDP <strong>to</strong><br />
about $17,500 per capita. This may have implications<br />
overseas, in our view.<br />
<strong>The</strong> World Meat Trade (000s <strong>of</strong> Tonnes) Is Strong<br />
LM Estimates<br />
Dietary enrichment has boosted the<br />
2001 <strong>to</strong><br />
migration from grain <strong>to</strong> poultry. Typically, the<br />
<strong>2015</strong> =<br />
next step is <strong>to</strong> pork, then beef.<br />
5.3%<br />
CAGR<br />
1983<br />
1980 <strong>to</strong><br />
2001 =<br />
5.8%<br />
CAGR<br />
U.S. Meat<br />
Exports<br />
1980-01<br />
= 10.3%/yr.<br />
1986<br />
1994<br />
1996<br />
1998<br />
2000<br />
<strong>2002</strong>E<br />
Beef Pork Poultry<br />
2004E<br />
We See U.S. Meat Exports Rising<br />
1989<br />
1992<br />
1995<br />
1998<br />
2001<br />
2004E<br />
2006E<br />
2008E<br />
LM<br />
Estimates<br />
2007E<br />
2010E<br />
Poultry<br />
2010E<br />
Beef<br />
2013E<br />
Pork<br />
2012E<br />
U.S. Meat Exports 2001<br />
<strong>to</strong> <strong>2015</strong>E<br />
= 5.9%/yr.<br />
U.S. Meat Market Share % (Right)<br />
2014E<br />
60%<br />
50%<br />
40%<br />
30%<br />
20%<br />
10%<br />
0%
Industrial Portfolio Strategy<br />
<strong>The</strong> <strong>Inflation</strong> <strong>Cycle</strong> <strong>of</strong> <strong>2002</strong> <strong>to</strong> <strong>2015</strong> ⎯ April 19, <strong>2002</strong> -57- Legg Mason Wood Walker, Inc.<br />
now that competi<strong>to</strong>rs’ currency-related advantages in market share have begun <strong>to</strong> run their course. Agricultural<br />
analyst Bill Hudson has stated that in 1900 only 5% <strong>of</strong> the world could afford fresh meat every day, by<br />
1950 the number was 20%, and <strong>to</strong>day it is about 35%. We believe that the worldwide meat intensity <strong>of</strong> use<br />
penetration rate should rise <strong>to</strong> approximately 60% <strong>to</strong> 70% by 2050, almost doubling from the current level,<br />
with global population growth added <strong>to</strong> that figure. High-value products, which include meats, are approximately<br />
two-thirds <strong>of</strong> <strong>to</strong>tal U.S. agricultural exports, and have been the lifting force for U.S. farm exports for<br />
the last two years. High-value products added $2.1 billion more than the prior year <strong>to</strong> U.S. agricultural exports<br />
<strong>of</strong> $53 billion this year, versus a $77 million decline in bulk grain exports. Currently, exports account<br />
for 10% <strong>of</strong> U.S. beef production, 7% <strong>of</strong> pork and 17% <strong>of</strong> poultry. In the 1990s alone, the grain and oilseed<br />
equivalent <strong>of</strong> U.S. meat and poultry exports has increased by about 400 million bushels, since one unit <strong>of</strong><br />
additional meat trade is equal <strong>to</strong> approximately 3.6 units <strong>of</strong> grain as feed (although poultry is less grainintensive<br />
than beef or pork).<br />
Meat stimulates feed grain consumption, but at a decreasing rate. Greater meat production efficiencies<br />
and the popularity <strong>of</strong> the less grain-intensive poultry industry have had a moderating effect on feed-grain<br />
demand, and from 1964 <strong>to</strong> 1999, the global production <strong>of</strong> meat and poultry rose by 450%, with only a 110%<br />
feed grain consumption increase. Of course, the increased share <strong>of</strong> poultry in the meat diet was a fac<strong>to</strong>r. In<br />
fact, poultry has been the star attraction <strong>of</strong> U.S. agricultural exports, with U.S. poultry export growth <strong>of</strong><br />
10.6% from 1980 <strong>to</strong> 2001, and 2001 exports <strong>of</strong> 6.2 billion pounds, or about 20% <strong>of</strong> U.S. production, with<br />
over one-half <strong>of</strong> that volume going <strong>to</strong> China and the FSU. We look for U.S. poultry exports <strong>to</strong> grow at a rate<br />
<strong>of</strong> 6.8% per year from 2001 <strong>to</strong> <strong>2015</strong>, perhaps assisted by a weaker U.S. dollar that allows for greater export<br />
cost advantage. In recent years, U.S. <strong>to</strong>tal meat exports have been hurt by animal disease concerns the world<br />
over, and economic recessions, and the USDA expects <strong>to</strong>tal U.S. meat exports <strong>to</strong> increase only 0.5% in the<br />
current fiscal year. <strong>The</strong>re are short-term impediments on the supply side. For example, if the liquidation<br />
phase <strong>of</strong> the cattle cycle were <strong>to</strong> come <strong>to</strong> a close this year, it is possible that animals bred in 2003 would not<br />
be ready for beef production until 2005, possibly restraining beef exports in the intervening period, and<br />
leading <strong>to</strong> substitution.<br />
Still, the long-term export picture is exciting if developing countries continue <strong>to</strong> embrace meat in<br />
their diets. From 1997 <strong>to</strong> 2001, Chinese beef imports rose 50% <strong>to</strong> 90,000 metric <strong>to</strong>nnes, pork imports rose<br />
206% <strong>to</strong> 450,000 metric <strong>to</strong>nnes, and poultry imports rose 31% <strong>to</strong> 1.9 MMT. Using 1995 data, if we index<br />
the U.S. <strong>to</strong> equal 1.00 and examine <strong>to</strong>tal annual meat plus fish consumption in various countries, the Japanese<br />
consume 0.81x the U.S. level, South Korea 0.74x, and China only 0.23x. Fish is less <strong>of</strong> a fac<strong>to</strong>r in the<br />
U.S. and, <strong>to</strong> the surprise <strong>of</strong> many, China. China's increasing preference for meat shows up in the substitution<br />
numbers as well. From 1990 <strong>to</strong> 2000, Chinese consumption <strong>of</strong> food grains (rice and wheat) declined<br />
13%, while China's population expanded 11%. A lack <strong>of</strong> cold s<strong>to</strong>rage and transportation infrastructure in<br />
China may restrain growth in the import <strong>of</strong> meats, but given that China has abundant labor and restrictive<br />
land and water resources, we are optimistic that China's competitive advantage will gravitate <strong>to</strong>ward laborintensive<br />
crops such as fruits, vegetables, and specialty crops rather than field crops and certain meats.<br />
U.S. Agricultural Exports and Deere S<strong>to</strong>ck<br />
<strong>The</strong> implications <strong>of</strong> greater farm industry prosperity are favorable for machinery sales, and thus<br />
Deere & Company. North American industry farm machinery inven<strong>to</strong>ries as a percentage <strong>of</strong> forward-12-<br />
month sales for 100+ horsepower, two-wheel drive (row crop) trac<strong>to</strong>rs are currently 29%, which is well be-
Industrial Portfolio Strategy<br />
<strong>The</strong> <strong>Inflation</strong> <strong>Cycle</strong> <strong>of</strong> <strong>2002</strong> <strong>to</strong> <strong>2015</strong> ⎯ April 19, <strong>2002</strong> -58- Legg Mason Wood Walker, Inc.<br />
low the 10-year average <strong>of</strong> 48%,<br />
and combine harvester inven<strong>to</strong>ries<br />
are 17% versus a 38% 10-<br />
year average. In Exhibit 46, we<br />
show the sharp recoveries in row<br />
crop trac<strong>to</strong>r sales in the 1987 <strong>to</strong><br />
1988 and 1992 <strong>to</strong> 1994 periods<br />
coincided with sharp periods <strong>of</strong><br />
outperformance for DE s<strong>to</strong>ck<br />
versus the S&P 500. <strong>The</strong> row<br />
crop trac<strong>to</strong>r sales recovery in<br />
this cycle has been more mild<br />
than in those prior cycles, we<br />
believe, because <strong>of</strong> the reduced<br />
incidences <strong>of</strong> steep discounting<br />
and lower dealer inven<strong>to</strong>ries,<br />
which have reduced the "fire<br />
sale" mentality. A recovery in<br />
the fortunes <strong>of</strong> farmers would be<br />
a bullish event for Deere s<strong>to</strong>ck,<br />
in our view. We believe that the<br />
key <strong>to</strong> more trac<strong>to</strong>r sales over<br />
the long term may be acreage,<br />
and in Exhibit 47 we show that<br />
acreage and farm commodity<br />
prices are related.<br />
<strong>The</strong> Global Competitiveness<br />
<strong>of</strong> the U.S. Farm Economy<br />
Exhibit 46 – Deere S<strong>to</strong>ck Follows Trac<strong>to</strong>r Sales Trends<br />
35,000<br />
30,000<br />
25,000<br />
20,000<br />
15,000<br />
10,000<br />
5,000<br />
Jan-85<br />
Deere S<strong>to</strong>ck Relative <strong>to</strong> the S&P 500 Tracks Trac<strong>to</strong>r Sales<br />
Jan-86<br />
Jan-87<br />
Jan-88<br />
Jan-89<br />
Jan-90<br />
Source: Equipment Manufacturers Institute<br />
Exhibit 47 – U.S. Farm Acres and Farm Commodity Pricing<br />
It has been two decades since<br />
all was rosy on the U.S. farm,<br />
so the sec<strong>to</strong>r can be forgiven a<br />
pessimistic mindset. As we<br />
have stated, in the <strong>2002</strong> <strong>to</strong> <strong>2015</strong><br />
period, we foresee higher exports<br />
<strong>of</strong> U.S. agricultural product,<br />
265,000<br />
245,000<br />
225,000<br />
-5%<br />
-10%<br />
-15%<br />
a weaker U.S. dollar versus<br />
the primary competi<strong>to</strong>r nations<br />
U.S. Acreage Harvested, Thousands <strong>of</strong> Acres, (Left)<br />
PPI Agri-Products, Y/Y % Chng., 5-Yr. Moving Avg., (Right)<br />
in the world food trade, and<br />
Source: Equipment Manufacturers Institute, S&P CompuStat<br />
higher hydrocarbon prices that<br />
raise agricultural inputs (<strong>of</strong>ten globally) and lead <strong>to</strong> food commodity inflation. In Exhibit 48, we show that<br />
real food exports help drive prices, and in Exhibit 49, we show that currency facilitates food exports. Hardship<br />
related <strong>to</strong> both supply and demand fac<strong>to</strong>rs caused U.S. government direct payments <strong>to</strong> farmers <strong>to</strong> average<br />
$21.5 billion per year each <strong>of</strong> the past three years, resulting in stable net cash income averaging $58 billion<br />
in the same period. In addition <strong>to</strong> income statement stability, we believe that the U.S. farm balance<br />
Jan-91<br />
Jan-92<br />
Jan-93<br />
Jan-94<br />
Jan-95<br />
12-mo. trailing sum, N.A. 100+ hp. trac<strong>to</strong>r sales (Left)<br />
365,000<br />
345,000<br />
325,000<br />
305,000<br />
285,000<br />
1945<br />
1950<br />
Machinery<br />
discounting<br />
boosted<br />
demand in the<br />
past.<br />
1955<br />
1960<br />
Discounting<br />
is more mild<br />
with reduced<br />
capacity.<br />
Jan-96<br />
Jan-97<br />
Jan-98<br />
Pricing Helps Drive Acreage<br />
1965<br />
1970<br />
1975<br />
1980<br />
1985<br />
1990<br />
Jan-99<br />
Jan-00<br />
Jan-01<br />
Jan-02<br />
L<br />
M<br />
e<br />
s<br />
t<br />
s.<br />
8.00%<br />
7.00%<br />
6.00%<br />
5.00%<br />
4.00%<br />
3.00%<br />
2.00%<br />
1.00%<br />
Deere s<strong>to</strong>ck rel. <strong>to</strong> S&P 500 (Right)<br />
1995<br />
2000<br />
2005E<br />
LM<br />
Ests.<br />
2010E<br />
<strong>2015</strong>E<br />
15%<br />
10%<br />
5%<br />
0%
Industrial Portfolio Strategy<br />
<strong>The</strong> <strong>Inflation</strong> <strong>Cycle</strong> <strong>of</strong> <strong>2002</strong> <strong>to</strong> <strong>2015</strong> ⎯ April 19, <strong>2002</strong> -59- Legg Mason Wood Walker, Inc.<br />
sheet is well positioned for a resumption<br />
<strong>of</strong> growth and machinery<br />
purchases. Again, it was not<br />
always so. Leverage has <strong>of</strong>ten<br />
proved <strong>to</strong> be the enemy <strong>of</strong> farming,<br />
and we note that the farm<br />
debt-<strong>to</strong>-asset ratio peaked in<br />
1985 at 23%, but it is only<br />
15.6% currently. In the 1970s,<br />
farmland asset values inflated,<br />
and borrowing was based more<br />
on asset collateral than on sustainable<br />
cash flow. <strong>The</strong> natural<br />
result was the agricultural bust<br />
<strong>of</strong> the 1980s, and the sec<strong>to</strong>r has<br />
been careful not <strong>to</strong> repeat past<br />
mistakes.<br />
Exhibit 48 – Food Exports Help Drive Food <strong>Price</strong>s<br />
$1,000,000<br />
$100,000<br />
$10,000<br />
$1,000<br />
1895<br />
1905<br />
1915<br />
1925<br />
1935<br />
1945<br />
1955<br />
1965<br />
1975<br />
1985<br />
1995<br />
LM<br />
Ests.<br />
2005E<br />
U.S. Agri-Exports in Real (Yr. 2000) U.S.$ Mil., (Left, Log)<br />
PPI Agricultural Products (Year 2000 = 100), (Right, Log)<br />
<strong>2015</strong>E<br />
1,000<br />
100<br />
10<br />
1<br />
Land is the farmer's largest<br />
asset, and it has steadily appreciated<br />
during this agricultural<br />
recession, which should<br />
benefit the sentiment that supports<br />
the purchase <strong>of</strong> farm<br />
machinery <strong>of</strong> the sort manufactured<br />
by Deere. Real estate accounts<br />
for 79% <strong>of</strong> farm assets<br />
but only 53% <strong>of</strong> farm debt, and<br />
farmland values rose about 61%<br />
in Iowa in the past decade, with<br />
about 3% increases for farms<br />
nationwide in each <strong>of</strong> the past<br />
three years. Reasons for the<br />
strength in farmland values are<br />
many, but we note that 62% <strong>of</strong><br />
program cropland in the U.S. is<br />
owned by non-operating landlords,<br />
and those owners have had<br />
<strong>to</strong> bid in the thin market for<br />
Source: USDA, Legg Mason estimates <strong>2002</strong> <strong>to</strong> <strong>2015</strong><br />
Exhibit 49 – Currency Moves Inversely <strong>to</strong> Food Exports<br />
130<br />
125<br />
120<br />
115<br />
110<br />
105<br />
100<br />
95<br />
90<br />
85<br />
80<br />
1970<br />
Source: USDA<br />
1975<br />
farmland <strong>to</strong> settle like-kind exchanges and postpone capital gains taxation. <strong>The</strong>se exchanges occur when<br />
farmland is sold <strong>to</strong> other farmers seeking economies <strong>of</strong> scale, or <strong>to</strong> developers who convert the farmland <strong>to</strong><br />
alternative uses, or even <strong>to</strong> nature conservancy funds that leave the land fallow.<br />
Oversupply caused largely by ideal growing weather has overshadowed improving demand trends.<br />
Corn yields in the U.S., measured in bushels per acre, have been at or above trend for six consecutive years,<br />
1996 <strong>to</strong> 2001. In fact, those six years were the first time since the years 1902 <strong>to</strong> 1908 that corn yields have<br />
1980<br />
1985<br />
1990<br />
1995<br />
2000<br />
$75,000<br />
$70,000<br />
$65,000<br />
$60,000<br />
$55,000<br />
$50,000<br />
$45,000<br />
$40,000<br />
$35,000<br />
$30,000<br />
$25,000<br />
Real U.S. Agricultural Trade-Weighted Dollar, 1995 = 100, (Left)<br />
Real U.S. Agricultural Exports, $U.S. Million, (Right)
Industrial Portfolio Strategy<br />
<strong>The</strong> <strong>Inflation</strong> <strong>Cycle</strong> <strong>of</strong> <strong>2002</strong> <strong>to</strong> <strong>2015</strong> ⎯ April 19, <strong>2002</strong> -60- Legg Mason Wood Walker, Inc.<br />
been at or above trend six consecutive<br />
years. In Exhibit 50, we<br />
show that it is highly unusual for<br />
U.S. corn yields not <strong>to</strong> be adversely<br />
weather-affected. If <strong>2002</strong><br />
corn yields fell 10% from the<br />
trend (i.e., <strong>to</strong> 124.2 bu./acre), we<br />
estimate about 62% <strong>of</strong> U.S. corn<br />
s<strong>to</strong>cks (inven<strong>to</strong>ry in s<strong>to</strong>rage)<br />
would be eliminated <strong>to</strong> make up<br />
the shortfall, and, <strong>of</strong> course, corn<br />
prices would likely rise in that<br />
environment. Despite the nearterm<br />
worries about oversupply,<br />
however, the USDA states that in<br />
the 2001 <strong>to</strong> <strong>2002</strong> crop year, the<br />
s<strong>to</strong>cks-<strong>to</strong>-use (inven<strong>to</strong>ry-<strong>to</strong>-sales)<br />
ratio for corn is 15.7%, below<br />
the five-year average s<strong>to</strong>cks-<strong>to</strong>use<br />
<strong>of</strong> 17.5%. For the <strong>2002</strong> <strong>to</strong><br />
2003 crop year, ProExporter estimates<br />
the corn, wheat and soybean<br />
combined s<strong>to</strong>cks-<strong>to</strong>-use <strong>to</strong><br />
be down further, <strong>to</strong> 16.9%. On<br />
the world stage, U.S. yields relative<br />
<strong>to</strong> those <strong>of</strong> export competi<strong>to</strong>rs<br />
are increasing strongly for<br />
feedgrains and modestly for oilseeds,<br />
but wheat yields in the U.<br />
S. are in a relative downtrend.<br />
Also on the subject <strong>of</strong> yields, if<br />
we are correct and hydrocarbon<br />
prices rise in the coming years,<br />
the reduced application <strong>of</strong> nitrogen<br />
fertilizer would probably<br />
reduce yield growth, as shown in<br />
Exhibit 51.<br />
Exhibit 50 – U.S. Corn Yields, +/(-) 10% From Trend<br />
Bushels Per Acre<br />
Source: USDA<br />
Exhibit 51 – U.S. Corn Yields and Fertilizer Usage<br />
1000<br />
Fertilizer Use Affects Yields<br />
100<br />
10<br />
165<br />
155<br />
145<br />
135<br />
125<br />
115<br />
105<br />
95<br />
85<br />
75<br />
65<br />
55<br />
1900<br />
Higher natural gas prices from<br />
<strong>2002</strong> <strong>to</strong> <strong>2015</strong> may impact grain<br />
yields by inhibiting fertilizer use.<br />
1910<br />
U.S. Average Corn Yield in Bushels Per Acre<br />
Volatile, weather-driven corn yields are the norm. <strong>The</strong> recent string<br />
<strong>of</strong> excellent yields is highly unusual. A 10% yield decline in <strong>2002</strong> (<strong>to</strong><br />
124.2 bu./acre) would reduce U.S. corn inven<strong>to</strong>ry by 62% <strong>to</strong> 600 mil.<br />
bu., all else being equal.<br />
1962<br />
1964<br />
1966<br />
1968<br />
1970<br />
1972<br />
1974<br />
1976<br />
1978<br />
1980<br />
1982<br />
1984<br />
1986<br />
1988<br />
1990<br />
1992<br />
1994<br />
1996<br />
1998<br />
2000<br />
Corn Yield bu./acre Corn Trend Plus 10%<br />
Corn Yield Minus 10%<br />
Corn Yield 10-yr. Centered Average<br />
1920<br />
By far, we believe that the<br />
Source: USDA<br />
greatest competitive threats <strong>to</strong><br />
the U.S. farmer are in South America, although we note that Deere and other farm equipment makers<br />
have incorporated that region in<strong>to</strong> their acquisition and marketing strategy for many years. Brazil's strength<br />
is soybeans, and the country exported almost 75% <strong>of</strong> its year 2000 soybean production in raw beans or finished<br />
products, equivalent <strong>to</strong> about 1 billion bushels. We doubt that Brazil will emerge as a major corn exporter<br />
because <strong>of</strong> the absence <strong>of</strong> suitable tropical corn varieties, and the rapid growth <strong>of</strong> Brazil's poultry industry<br />
which consumes domestic feed corn. Despite Argentina's complementary strengths in soybeans, soy-<br />
1930<br />
1940<br />
1950<br />
1960<br />
1970<br />
U.S. Fertilizer Applied, Lbs./Acre, (Left, Log)<br />
1980<br />
U.S. Corn Yields, Bushels/Acre, (Right, Log)<br />
1990<br />
2000<br />
1000<br />
100<br />
10
Industrial Portfolio Strategy<br />
<strong>The</strong> <strong>Inflation</strong> <strong>Cycle</strong> <strong>of</strong> <strong>2002</strong> <strong>to</strong> <strong>2015</strong> ⎯ April 19, <strong>2002</strong> -61- Legg Mason Wood Walker, Inc.<br />
bean meal and soybean oil, and though Argentina also has emerged as export competi<strong>to</strong>r in corn, we believe<br />
that Argentina's economic difficulties will give a moderate lift <strong>to</strong> U.S. corn export market share in the coming<br />
years. Total shipments <strong>of</strong> soybeans and soybean products from Brazil and Argentina eclipsed the U.S.<br />
around 1996, and the gap has continued <strong>to</strong> widen. In addition <strong>to</strong> soybean products, Brazil has about 107 million<br />
acres under cultivation, versus 226 million in the U.S. But by adding the vast "Cerrados" region's potential<br />
acreage, Brazil eventually could reach 353 million planted acres. Brazil's corn yields in 2000 were<br />
about one-third those <strong>of</strong> the U.S., and soybean yields are comparable <strong>to</strong> those in the U.S. heartland.<br />
Our view is that South America has used the devaluation bullet, and now it must stand on its own. It<br />
was an unfortunate act <strong>of</strong> timing (for them) that Argentina tied the peso, and Brazil tied the real, <strong>to</strong> the U.S.<br />
dollar in the mid-1990s, since both suffered through a multiyear bull market for the U.S. currency. Now that<br />
both Brazil (1999) and Argentina (2001) have removed their dollar pegs, their farm product exports have<br />
become more competitive, although the financial and infrastructure inefficiencies in both countries still<br />
exist, in our view. To be sure, however, Brazil has made great strides in stabilizing its economy, improving<br />
farmer access <strong>to</strong> credit, enhancing the country's grain logistics network, globalizing its farm input sources<br />
and technology, and streamlining its taxation and export policies. But Argentina is mired in debt, and<br />
paying devalued pesos for dollar-denominated imports <strong>of</strong> farm inputs is not a recipe for agricultural<br />
success, in our view. As an <strong>of</strong>fset, Argentina's farmers have increasingly turned <strong>to</strong> barter systems <strong>to</strong><br />
purchase needed inputs such as seed, fertilizer and chemicals.<br />
South America is not immune from a reversal <strong>of</strong> agricultural fortunes, in our view. <strong>The</strong> Cerrados land<br />
in Brazil requires heavy doses <strong>of</strong> lime and phosphorus <strong>to</strong> reduce aluminum <strong>to</strong>xicity and acidity, so our view<br />
is that the Cerrados’ lands will be brought in<strong>to</strong> production slowly, and only in response <strong>to</strong> strong world demand<br />
for soybeans. In addition, some <strong>of</strong> the Cerrados’ soil is fragile, being subject <strong>to</strong> significant erosion in<br />
the frequent, tropical rains. Although Brazil does not suffer a major weed problem, the country's farmers<br />
have largely made the switch <strong>to</strong> no-till (i.e., avoids the use <strong>of</strong> plows <strong>to</strong> till the land after harvest) <strong>to</strong> avoid<br />
erosion, and weeds <strong>of</strong>ten follow no-till with a lag. In fact, our view is that this eventually may lead Brazil <strong>to</strong><br />
abandon its "GMO-free" policy, which is <strong>of</strong>ficial in name only, in our view, since there are widespread reports<br />
<strong>of</strong> Brazilian farmers already using “Roundup Ready ® ” soybeans. Combined with the pressing need <strong>to</strong><br />
continue increasing crop yields, we see Brazil's GMO-free soybean export price premium eroding over time.<br />
Currency is only part <strong>of</strong> the issue, as cost differentials <strong>of</strong>ten go much deeper in world food production<br />
and competition. Equalizing North and South America for differences in land cost, an Agroconsult<br />
study provides data that Midwestern U.S. farmers’ variable costs per bushel <strong>of</strong> soybeans produced are about<br />
15% below those in Brazil and Argentina, and for corn the U.S. advantage is about 45% <strong>to</strong> 50% below Brazil<br />
and Argentina. Where the South Americans have an advantage is <strong>to</strong>tal capitalized costs including land,<br />
as that causes U.S. <strong>to</strong>tal costs <strong>to</strong> be 63% higher for soybeans and 5% higher for corn. A recent Iowa State<br />
University study put Brazil's all-in soybean production costs at port <strong>of</strong> exit at $4.60 per bushel, and for the<br />
U.S. the figure is $6.38 per bushel. What is interesting is that if we exclude the capitalized cost <strong>of</strong> land, then<br />
the U.S. cost is only $3.58 per bushel and for Brazilian it is $4.09. Since U.S. farmland <strong>of</strong>ten has no other<br />
use but farming, we believe its value is <strong>of</strong>ten situation-dependent on farming. As a result, we view non-land<br />
costs as a better measure <strong>of</strong> relative costs. Also on the subject <strong>of</strong> other costs, the Agroconsult study shows<br />
that Brazil's grain production has risen at a compound rate <strong>of</strong> 5.5% per year in the past decade, but its fertilizer<br />
consumption has risen at an annual rate <strong>of</strong> 6%, and usage <strong>of</strong> ag-chemicals has risen at 8% per year. If<br />
input costs rise, we would expect Brazil’s all-in cost advantage <strong>to</strong> shrink, all else being equal.
Industrial Portfolio Strategy<br />
<strong>The</strong> <strong>Inflation</strong> <strong>Cycle</strong> <strong>of</strong> <strong>2002</strong> <strong>to</strong> <strong>2015</strong> ⎯ April 19, <strong>2002</strong> -62- Legg Mason Wood Walker, Inc.<br />
We see the EU slowly fading as an export competi<strong>to</strong>r, but not overnight or without a fight. <strong>The</strong> devaluation<br />
<strong>of</strong> the European euro and the EU export <strong>of</strong> subsidized agricultural overproduction have been competitive<br />
issues for U.S. farmers in the past. Also, the EU has quietly built a network <strong>of</strong> preferential trade<br />
agreements with all but 10 countries in the world, and many <strong>of</strong> these agreements have bilateral trade terms<br />
that lock in food markets. Unfortunately for Deere and its cus<strong>to</strong>mers, the U.S. has typically had a less organized<br />
public/private cooperative effort <strong>to</strong> facilitate exports. <strong>The</strong> EU is not without export competition<br />
worries, however, because it faces its own "Brazil-like" competi<strong>to</strong>rs for regional export market share in the<br />
form <strong>of</strong> the rapidly recovering FSU grain sec<strong>to</strong>r, and the enlargement <strong>of</strong> the EU Common Agricultural Policy<br />
(CAP) <strong>to</strong> include central and eastern European candidates. <strong>The</strong> EU proposes a phased-in subsidy for its<br />
Eastern European neighbors, whereby the new members <strong>of</strong> the CAP would receive only 25% <strong>of</strong> the Western<br />
subsidy level in 2004, rising <strong>to</strong> 100% by 2013. From 2004 <strong>to</strong> 2006, the subsidies would cost the CAP $36<br />
billion in <strong>to</strong>tal, a heady sum for the EU budget. <strong>The</strong> combination <strong>of</strong> low-cost competi<strong>to</strong>rs in the back yard<br />
<strong>of</strong> a higher-cost producer, and the liability <strong>of</strong> bringing some emerging market competi<strong>to</strong>rs with large farm<br />
populations in<strong>to</strong> a generous subsidy scheme, is not favorable for Western EU agricultural production in the<br />
long term, in our opinion.<br />
Though we like DE s<strong>to</strong>ck for<br />
macro-reasons, the valuation<br />
should give pause. Currently,<br />
DE s<strong>to</strong>ck trades at a P/E <strong>of</strong> 19.7x<br />
the First Call consensus for<br />
FY03, and earnings “power”<br />
given the mix <strong>of</strong> businesses is<br />
less than clear, in our view. In<br />
addition, using a less orthodox<br />
scale that we sometimes use, DE<br />
s<strong>to</strong>ck appears <strong>to</strong> be ahead <strong>of</strong> itself<br />
relative <strong>to</strong> corn prices,<br />
shown in Exhibit 52. As a result,<br />
we are keeping some powder<br />
dry, deferring a Strong Buy rating<br />
until we see some sign that<br />
the DE s<strong>to</strong>ck price and the company’s<br />
EPS potential have<br />
moved closer <strong>to</strong>gether, or that<br />
industry conditions (including<br />
the outlook for corn prices) are<br />
markedly higher in the near<br />
term, all else being equal.<br />
Exhibit 52 – Deere S<strong>to</strong>ck and Corn <strong>Price</strong>s<br />
$50.000<br />
$48.000<br />
$46.000<br />
$44.000<br />
$42.000<br />
$40.000<br />
$38.000<br />
$36.000<br />
$34.000<br />
$32.000<br />
$30.000<br />
3/1/00<br />
Deere S<strong>to</strong>ck Vs. Corn <strong>Price</strong>s March 2000 <strong>to</strong> March <strong>2002</strong><br />
6/1/00<br />
Source: S&P Compustat<br />
9/1/00<br />
12/1/00<br />
Deere S<strong>to</strong>ck <strong>Price</strong> (Left)<br />
<strong>The</strong>re is a relationship between<br />
Deere s<strong>to</strong>ck and corn prices,<br />
although a divergence has developed<br />
in <strong>2002</strong>.<br />
3/1/01<br />
6/1/01<br />
9/1/01<br />
12/1/01<br />
Corn Near Futures <strong>Price</strong> Per Bushel (Right)<br />
3/1/02<br />
$2.50<br />
$2.40<br />
$2.30<br />
$2.20<br />
$2.10<br />
$2.00<br />
$1.90<br />
$1.80<br />
$1.70
Industrial Portfolio Strategy<br />
<strong>The</strong> <strong>Inflation</strong> <strong>Cycle</strong> <strong>of</strong> <strong>2002</strong> <strong>to</strong> <strong>2015</strong> ⎯ April 19, <strong>2002</strong> -63- Legg Mason Wood Walker, Inc.<br />
Scenario (3) Middle East War(s) in the Period <strong>2002</strong> <strong>to</strong> <strong>2015</strong> That<br />
Result in Extended Oil Supply Disruptions: Probability: 25%<br />
Analyzing the potential for major war is key <strong>to</strong> determining the outlook for inflation, as well as the<br />
allocation <strong>of</strong> public versus private resources, both <strong>of</strong> which affect s<strong>to</strong>ck market returns. Earlier in this<br />
report we showed that 26% <strong>of</strong> the 20th century featured major (lengthy and global) periods <strong>of</strong> hot or economic<br />
warfare that involved the U.S. Those periods produced mean annual inflation <strong>of</strong> 10.7% for commodities,<br />
9.0% for consumer prices, and 2.6% annual (minus 6.4% real) U.S. s<strong>to</strong>ck market price returns. We believe<br />
that the “peace dividend” <strong>of</strong> the 1990s was the end <strong>of</strong> the Soviet Union that reduced U.S. defense<br />
spending as a percentage <strong>of</strong> GDP, combined with the post-Gulf War implicit agreement with Saudi Arabia<br />
that America would provide a defense umbrella in exchange for Saudi Arabia, as OPEC “swing producer,”<br />
enforcing reasonable world oil prices. Both peace dividends appear <strong>to</strong> be spent, in our view, and since we<br />
believe the Middle East is the most unstable region in the world <strong>to</strong>day, this section describes the Persian<br />
Gulf war risk under various scenarios. Our opinion is that as inves<strong>to</strong>rs we must be keen, disciplined and impartial<br />
observers, and our investment view is that the “New World Order” created after the Gulf War and<br />
the fall <strong>of</strong> the Soviet Union is crumbling. If the transition <strong>to</strong> the next world order goes badly, then we<br />
note that major wars in U.S. his<strong>to</strong>ry have, without exception, been inflationary.<br />
A key risk we see is that the economic pressure on the oil producers resulting from renewed oil price<br />
deflation could light the powder keg in the Middle East and lead <strong>to</strong> inflation via major war. Earlier in<br />
this report we described our view that the voracious appetite we expect for oil from Asia/Pacific net oil importers<br />
can only be met by expanded production from the Persian Gulf. Competing with Asia, however, are<br />
the U.S. and other developed and developing countries. Even without disruption in Middle East oil flow,<br />
our view is also that U.S. oil import demands are likely <strong>to</strong> collide with sharply rising Asia/Pacific demands<br />
in the coming decade, leading <strong>to</strong> higher prices for all, and outstripping the capability <strong>of</strong> alternative fuels and<br />
oil sources <strong>to</strong> overtake demand for several years. In Exhibit 53, we show Persian Gulf oil as a percentage <strong>of</strong><br />
U.S. oil consumption, and observe that the Persian Gulf’s share <strong>of</strong> U.S. oil consumption was 13.9% in<br />
2001, above the prior peak <strong>of</strong> 13.5% in 1977. More importantly, U.S. oil imports as a percentage <strong>of</strong> U.S.<br />
consumption were 46.5% in 2001, hovering at a post-World War II high. In our opinion, analysts who cite<br />
decreased U.S. reliance on Persian Gulf oil as a percentage <strong>of</strong> <strong>to</strong>tal oil imports conveniently overlook the<br />
fact that <strong>to</strong>tal U.S. oil imports as a percentage <strong>of</strong> consumption are sharply higher than two decades ago. Our<br />
view is that oil is like a game <strong>of</strong> musical chairs among the importers: if several chairs (producers) are removed,<br />
and given that all oil importing nations must sit down (consume oil), then the price <strong>of</strong> the remaining<br />
chairs rises substantially once the music (steady oil flow) s<strong>to</strong>ps. Past oil shocks include the 1973 <strong>to</strong> 1974<br />
Oil Embargo, the Iranian Revolution <strong>of</strong> 1979, and the period after the start <strong>of</strong> the Iran/Iraq War <strong>of</strong> 1980 <strong>to</strong><br />
1988. In Exhibit 54, we show the <strong>to</strong>tal Persian Gulf oil exports in real U.S. dollars for the period 1970 <strong>to</strong><br />
<strong>2015</strong>E. <strong>The</strong> bubble <strong>of</strong> the 1970s is evident, but the prolonged bust that followed may resume an upward direction<br />
<strong>to</strong> <strong>2015</strong>, if our estimates are correct.<br />
<strong>The</strong> Persian Gulf war risks we see, in descending order <strong>of</strong> likelihood, are as follows.<br />
(1) U.S. military action <strong>to</strong> change the Iraqi regime which may lead <strong>to</strong> a destabilized region.<br />
(2) <strong>The</strong> risk that Iraq currently has or will soon succeed in the development <strong>of</strong> nuclear weapons.<br />
(3) <strong>The</strong> risk <strong>of</strong> civil war that targets Saudi Arabia's ruling al-Saud monarchy.<br />
(4) <strong>The</strong> risk <strong>of</strong> conventional (non-nuclear) warfare within the Persian Gulf region.<br />
(5) <strong>The</strong> risk <strong>of</strong> terrorists obtaining nuclear weapons developed in the former Soviet Union.
Industrial Portfolio Strategy<br />
<strong>The</strong> <strong>Inflation</strong> <strong>Cycle</strong> <strong>of</strong> <strong>2002</strong> <strong>to</strong> <strong>2015</strong> ⎯ April 19, <strong>2002</strong> -64- Legg Mason Wood Walker, Inc.<br />
Exhibit 53 - Persian Gulf Oil as a Percentage <strong>of</strong> U.S. Consumption, 1970 <strong>to</strong> 2001<br />
Persian Gulf and Total Imports as a % <strong>of</strong> U.S. Oil Consumption<br />
50.0%<br />
45.0%<br />
All-time high dependence on the world oil "bucket"<br />
40.0%<br />
35.0%<br />
30.0%<br />
25.0%<br />
20.0%<br />
15.0%<br />
Back up <strong>to</strong> mid-1970s level.<br />
10.0%<br />
5.0%<br />
0.0%<br />
1950<br />
1952<br />
1954<br />
1956<br />
1958<br />
1960<br />
1962<br />
1964<br />
1966<br />
1968<br />
1970<br />
1972<br />
1974<br />
1976<br />
1978<br />
1980<br />
1982<br />
1984<br />
1986<br />
1988<br />
1990<br />
1992<br />
1994<br />
1996<br />
1998<br />
2000<br />
Persian Gulf imports % <strong>of</strong> U.S. Consumption<br />
All Imports % <strong>of</strong> U.S. Consumption<br />
Source: U.S. EIA<br />
Exhibit 54 - Persian Gulf Oil Exports in Real (Year 2000) U.S. Dollars, 1970 <strong>to</strong> <strong>2015</strong>E<br />
$450<br />
$400<br />
Projection<br />
Persian Gulf Oil Exports, Real $ (2000) Bil<br />
$350<br />
$300<br />
$250<br />
$200<br />
$150<br />
$100<br />
$50<br />
$0<br />
1970<br />
1971<br />
1972<br />
1973<br />
1974<br />
1975<br />
1976<br />
1977<br />
1978<br />
1979<br />
1980<br />
1981<br />
1982<br />
1983<br />
1984<br />
1985<br />
1986<br />
1987<br />
1988<br />
1989<br />
1990<br />
1991<br />
1992<br />
1993<br />
1994<br />
1995<br />
1996<br />
1997<br />
1998<br />
1999<br />
2000<br />
2001<br />
<strong>2002</strong><br />
2003<br />
2004<br />
2005<br />
2006<br />
2007<br />
2008<br />
2009<br />
2010<br />
2011<br />
2012<br />
2013<br />
2014<br />
<strong>2015</strong><br />
Saudi Arabia Iran Iraq Other Gulf<br />
Source: U.S. EIA. Legg Mason projection based on EIA’s International Energy Outlook <strong>2002</strong>
Industrial Portfolio Strategy<br />
<strong>The</strong> <strong>Inflation</strong> <strong>Cycle</strong> <strong>of</strong> <strong>2002</strong> <strong>to</strong> <strong>2015</strong> ⎯ April 19, <strong>2002</strong> -65- Legg Mason Wood Walker, Inc.<br />
Our approach is <strong>to</strong> watch actions rather than statements, and we believe the Bush Administration<br />
has adopted a far more pervasive wartime footing than is currently recognized by the markets. <strong>The</strong><br />
distinct shift in budget priorities and deficit spending <strong>to</strong>lerance, as well as the risk <strong>to</strong> energy commodity<br />
trade, have significant implications for inves<strong>to</strong>rs. For example, the movement <strong>of</strong> the U.S. <strong>to</strong> a “shadow government”<br />
is an unusual step. <strong>The</strong> shadow government concept originated in the Cold War, and requires a<br />
group <strong>of</strong> senior federal government <strong>of</strong>ficials <strong>to</strong> rotate in a secure, <strong>of</strong>f-site location <strong>to</strong> ensure government,<br />
and particularly executive branch, continuity in case <strong>of</strong> an attack on Washing<strong>to</strong>n, D.C. In addition, on December<br />
13, 2001, the U.S. pulled out <strong>of</strong> the Anti-Ballistic Missile treaty, and on January 8, <strong>2002</strong>, the U.S.<br />
modified its nuclear strategy, called the Single Integrated Operational Plan (SIOP), by lowering the bar for<br />
first-use <strong>of</strong> nuclear weapons and shifting the focus from Cold War thinking <strong>to</strong> an increased awareness <strong>of</strong><br />
China, Iran, Iraq, Libya, North Korea, Syria and Russia. <strong>The</strong> revised plan appears <strong>to</strong> loosen the traditional<br />
restraints the U.S. had in place with regard <strong>to</strong> its use <strong>of</strong> nuclear arms. We believe that this was not a budget<br />
ploy, or a belated update <strong>of</strong> outdated Cold War strategy, but rather a deliberate decision by the Administration<br />
that the 1970 Nuclear Nonproliferation Treaty (NNPT) has failed. We believe that the Bush Administration<br />
weighed the risk <strong>of</strong> existing and emerging nuclear threats (including the proliferation risk presented<br />
by Iraq, a NNPT signa<strong>to</strong>ry) against the risk <strong>of</strong> sending a signal <strong>to</strong> non-nuclear countries (in contravention <strong>to</strong><br />
the NNPT implicit guarantee) that simply because they are non-nuclear they are no longer protected from a<br />
nuclear response <strong>to</strong> their hostile actions. After considering all <strong>of</strong> the ramifications, we believe the Administration<br />
decided that the increased wartime footing <strong>of</strong> the U.S. justified the shift, and we interpret the shift<br />
as added risk that is underappreciated by inves<strong>to</strong>rs for the potential impact it may have.<br />
Nuclear weapons are a complex subject, but they present a risk with potential repercussions for inves<strong>to</strong>rs<br />
that must be analyzed. In the box on page 66 we provide a primer on nuclear weapons, with an<br />
emphasis on the sort that we believe the Bush Administration fears may be now or in the near future in<br />
Iraq’s possession. We believe inves<strong>to</strong>rs <strong>of</strong>ten receive incorrect information regarding the highly complex<br />
world nuclear threat, and since misinformation is the enemy <strong>of</strong> markets, we believe that it obscures the appropriate<br />
equity risk premium as well as commodity price reactions. For example, media reports have occasionally<br />
failed <strong>to</strong> differentiate between weapons-grade highly enriched uranium-235 (HEU, having >80%<br />
U-235 content) and ordinary low-enriched uranium (LEU, having 3% <strong>to</strong> 5% U-235 content) nuclear reac<strong>to</strong>r<br />
fuel. Later in this report we express our doubts about the widely reported “suitcase nuke” threat, for example,<br />
in terms <strong>of</strong> the devices’ reputed destructive capabilities, and the likelihood that terror groups could obtain<br />
or use them even if they ever existed in the Former Soviet Union or were ever misplaced.<br />
<strong>The</strong> Risk <strong>of</strong> U.S. Military Action <strong>to</strong> Change the Iraqi Regime Which May Lead<br />
<strong>to</strong> a Destabilized Region<br />
An emerging war scenario that we believe is underestimated by inves<strong>to</strong>rs involves U.S.-led efforts <strong>to</strong><br />
oust Saddam Hussein <strong>of</strong> Iraq, possibly with conventional military force. Since the expulsion <strong>of</strong> United<br />
Nations (UNSCOM) weapons inspec<strong>to</strong>rs in late 1998, the only checks on Iraq’s WMD nuclear program<br />
have come from International A<strong>to</strong>mic Energy Administration (IAEA) visits <strong>to</strong> Iraq, but we feel those inspections<br />
are <strong>to</strong>o limited <strong>to</strong> be <strong>of</strong> value, and note that other countries have developed nuclear weapons despite<br />
being subject <strong>to</strong> IAEA inspections. Former Iraqi nuclear scientists and UNSCOM inspec<strong>to</strong>rs have provided<br />
statements and evidence <strong>of</strong> a long-standing WMD nuclear program, possibly one that was revitalized<br />
after the expulsion <strong>of</strong> the inspection regimen. In addition, former UNSCOM inspec<strong>to</strong>rs have uncovered evidence<br />
that Iraq employed an elaborate scheme for hiding its WMD programs from inspec<strong>to</strong>rs. Although we
Industrial Portfolio Strategy<br />
<strong>The</strong> <strong>Inflation</strong> <strong>Cycle</strong> <strong>of</strong> <strong>2002</strong> <strong>to</strong> <strong>2015</strong> ⎯ April 19, <strong>2002</strong> -66- Legg Mason Wood Walker, Inc.<br />
do not believe any <strong>of</strong> the major<br />
Persian Gulf leaders would regret<br />
the removal <strong>of</strong> Saddam Hussein,<br />
the reality <strong>of</strong> the current political<br />
situation in the Persian Gulf as it<br />
differs from the Gulf War period a<br />
decade earlier is that such a move<br />
could easily play in<strong>to</strong> the hands <strong>of</strong><br />
the radical factions that threaten<br />
moderate regimes, including Saudi<br />
Arabia. In our view, the Gulf War<br />
<strong>of</strong> 1991 was successful precisely<br />
because <strong>of</strong> the scope and size <strong>of</strong><br />
the coalition forces build-up and<br />
bombing campaign before the<br />
ground war began. <strong>The</strong> difficulty<br />
in assembling a coalition <strong>to</strong> conducting<br />
a similar size operation<br />
<strong>to</strong>day, and the risk that Iraq may<br />
have improved its nuclear counterattack<br />
capabilities, are other risks<br />
<strong>to</strong> consider. In this period <strong>of</strong> uncertainty,<br />
we hope <strong>to</strong> leave inves<strong>to</strong>rs<br />
more prepared for whatever<br />
may occur. Rather than speculate<br />
on operational details, we focus on<br />
the motivation for such a U.S.-led<br />
operation in the following section.<br />
<strong>The</strong> Risk that Iraq Has or<br />
Will Soon Succeed in the<br />
Development <strong>of</strong> Nuclear<br />
Weapons<br />
We believe that Iraq’s nuclear<br />
weapons program is the primary<br />
Middle East concern <strong>of</strong> the Bush<br />
Administration. Our research<br />
concludes that a combination <strong>of</strong><br />
four principal items have kept Iraq<br />
from successfully developing a nuclear<br />
weapon (or limited the number<br />
<strong>of</strong> such weapons if one or<br />
more exist) despite billions <strong>of</strong> dollars<br />
<strong>of</strong> expenditures and over a<br />
Iraq’s Potential Approach <strong>to</strong> Nuclear Weapons<br />
We believe that the U.S. fears development in Iraq <strong>of</strong> nuclear fissiontype<br />
weapons, which use the energy released from splitting a<strong>to</strong>ms. Fission<br />
occurs when fissile nuclear material is forcibly combined in a critical mass<br />
capable <strong>of</strong> sustaining the free release <strong>of</strong> a<strong>to</strong>mic particles called neutrons,<br />
which leads <strong>to</strong> the splitting <strong>of</strong> still more a<strong>to</strong>mic nuclei, releasing energy in a<br />
chain reaction. We believe that if Iraq is close <strong>to</strong> developing nuclear weapons,<br />
or has a few <strong>of</strong> them, they are probably larger in physical size (thus difficult<br />
<strong>to</strong> deliver), and lower-yielding (in a explosive equivalent sense, expressed<br />
as 1 kilo<strong>to</strong>n = 1,000 <strong>to</strong>ns <strong>of</strong> high explosive TNT-equivalent) fissiononly<br />
devices, possibly using a simple “gun” assembly approach that fires <strong>to</strong>gether<br />
two subcritical masses <strong>of</strong> highly enriched Uranium-235 (HEU, generally<br />
containing >80% U-235) <strong>to</strong> create a super-critical mass and a fission<br />
chain reaction. <strong>The</strong> weapon we have described is similar <strong>to</strong> “Little Boy,”<br />
which was one <strong>of</strong> two nuclear device designs developed by the U.S. in the<br />
Manhattan Project <strong>of</strong> World War II, albeit smaller in dimensions than Little<br />
Boy as a result <strong>of</strong> technological progress <strong>to</strong>-date. <strong>The</strong> other Manhattan Project<br />
nuclear weapon was called “Fat Man,” which used Plu<strong>to</strong>nium-239 (Pu-<br />
239) as a more efficient-by-weight fissile material, and a design that imploded<br />
a core <strong>of</strong> Pu-239 <strong>to</strong> produce a chain reaction (although either U-235<br />
or Pu-239 can be used in a implosion design). Having found PU-239 reprocessing<br />
more difficult than U-235 enrichment, we believe Iraq may have chosen<br />
– and may be well on the way <strong>to</strong> producing – a Manhattan Projecttype,<br />
U-235-based, Fat Man or Little Boy weapon. Though we do not<br />
minimize it, Little Boy, for example, was “only” about 1/100th as powerful<br />
as many <strong>of</strong> the modern thermonuclear devices currently in western and Russian<br />
arsenals, it weighed 8,900 pounds (far heavier than any Iraqi ballistic<br />
missile payload capability), and it was 120 inches in length (far <strong>to</strong>o long for<br />
any Iraqi combat aircraft <strong>to</strong> carry). To maximize its effect by minimizing<br />
blast deflection resulting from ground clutter, Little Boy was de<strong>to</strong>nated at<br />
1,800 feet above Hiroshima, Japan. But given the advanced state <strong>of</strong> modern<br />
air defenses, such an air-burst would be a difficult feat for Iraq, in our view,<br />
given the difficulty Iraq has faced in continuing its ballistic missile or tactical<br />
aircraft training programs since the Gulf War. Although ground delivery<br />
would greatly reduce the weapon’s lethal range, more radioactive fallout<br />
would be created, a problem for surrounding countries. We have no doubt<br />
that Iraq’s potential device(s) would differ sharply from the much more<br />
powerful and sophisticated arsenals <strong>of</strong> the long-standing nuclear powers,<br />
the latter <strong>of</strong> which employ a three-stage fission, fusion, and then secondary<br />
fission thermonuclear process <strong>of</strong> much greater – <strong>of</strong>ten 100x and in a few<br />
cases over 1,000x greater – explosive equivalent yield, with superior missile,<br />
aircraft or submarine delivery systems. Basically, these fusion-based weapons<br />
use the energy released in fission as only a first-stage “trigger” <strong>to</strong> fuse <strong>to</strong>gether<br />
(as opposed <strong>to</strong> fission, which is <strong>to</strong> split) a<strong>to</strong>mic nuclei, releasing far<br />
greater energy in the process, which then can be used <strong>to</strong> create a large secondary<br />
fission reaction <strong>of</strong> the casing <strong>of</strong> the device itself. Such yields can be arbitrarily<br />
high; for example, the Soviet Union de<strong>to</strong>nated a 58 mega<strong>to</strong>n (58 million<br />
<strong>to</strong>ns <strong>of</strong> TNT) fusion weapon in 1961.
Industrial Portfolio Strategy<br />
<strong>The</strong> <strong>Inflation</strong> <strong>Cycle</strong> <strong>of</strong> <strong>2002</strong> <strong>to</strong> <strong>2015</strong> ⎯ April 19, <strong>2002</strong> -67- Legg Mason Wood Walker, Inc.<br />
quarter century <strong>of</strong> effort. Those reasons are: (1) the effectiveness <strong>of</strong> previous UNSCOM inspections and U.<br />
S. bombing in the Gulf War, (2) a lack <strong>of</strong> focus by Iraqi nuclear scientists with regard <strong>to</strong> first taking the<br />
easiest path <strong>to</strong> build a basic fission bomb before embarking on more sophisticated devices, (3) Saddam<br />
Hussein’s own handling <strong>of</strong> his nuclear scientists which may have contributed <strong>to</strong> problem (#2), and finally<br />
(4) Israeli military and security force preventive actions since the mid-1970s <strong>to</strong> sabotage Iraq’s nuclear program.<br />
We believe that if Iraq is close <strong>to</strong> developing nuclear weapons, or has a small number <strong>of</strong> them, they<br />
are probably <strong>of</strong> the type described in the box on the preceding page, which is similar in design <strong>to</strong> one <strong>of</strong> the<br />
two nuclear weapons the U.S. developed in the Manhattan Project <strong>of</strong> World War II.<br />
We have no doubt that Iraq’s potential or prospective device would differ sharply from the much<br />
larger and more powerful arsenals <strong>of</strong> the long-standing nuclear powers. To date, we believe that the<br />
Iraqi nuclear program has probably obtained or produced many <strong>of</strong> the components for a fission-only nuclear<br />
device using HEU, but may lack some <strong>of</strong> the components as well as a critical mass <strong>of</strong> the much more difficult<br />
<strong>to</strong> obtain HEU fissile material. <strong>The</strong> distinction in terms <strong>of</strong> Iraq’s nuclear ambitions and capabilities by<br />
weapon type is important, because it has implications for delivery method, use, damage and threat level. Although<br />
a Plu<strong>to</strong>nium-239 (Pu-239) fission device is smaller, for example, and thus more easily delivered <strong>to</strong> a<br />
target, we doubt that Iraq has a Pu-239 device because those tend <strong>to</strong> be a more sophisticated second-step<br />
weapon for proliferants. In fact, it may have been a quest for Pu-239 from Iraq’s Tammuz-1/Osirak nuclear<br />
reac<strong>to</strong>r fiasco <strong>of</strong> 20 years ago that contributed <strong>to</strong> delays in Iraqi nuclear success <strong>to</strong> date. For a sense <strong>of</strong> his<strong>to</strong>ry,<br />
beginning in 1974, Iraq pursued the purchase from France <strong>of</strong> a nuclear research reac<strong>to</strong>r (a materials<br />
test reac<strong>to</strong>r) that was fueled by weapon’s grade HEU rather than LEU. Such a reac<strong>to</strong>r could quickly produce<br />
weapon’s grade Pu-239 (U-238 “targets” would become Pu-239 by capturing an additional neutron), and<br />
since a critical mass <strong>of</strong> Pu-239 weighs only 11 kilograms, as opposed <strong>to</strong> a critical mass <strong>of</strong> U-235 weighing<br />
56 kilograms (less if using a component known as a neutron reflec<strong>to</strong>r in either case; Iraq reportedly has experimented<br />
with reflec<strong>to</strong>rs), a Pu-239 fission bomb using explosives <strong>to</strong> implode the Pu-239 core in<strong>to</strong> a fissile<br />
mass would be easier <strong>to</strong> conceal and deliver via a small missile. But Iraq’s compact Pu-239-based bomb<br />
plans, which may have been sought, in our view, <strong>to</strong> accommodate Iraq’s limited missile delivery technology,<br />
proved <strong>to</strong>o l<strong>of</strong>ty a goal, since such a large research reac<strong>to</strong>r provided an easy target. In less than two<br />
minutes, on June 7, 1981, Israeli F-16 jets destroyed the Tammuz-1/Osirak reac<strong>to</strong>r before it was fueled for<br />
operation. Questions <strong>of</strong> whether Israel had inside help with the French team on-site have been raised but<br />
never publicly acknowledged. Since Iraq was already embroiled in a war with Iran that begun in September<br />
1980, the Iraqi nuclear program may have been set back several years.<br />
After the Tammuz-1/Osirak setback, we believe that Iraq switched <strong>to</strong> a simpler U-235 based nuclear<br />
weapon design, and began <strong>to</strong> employ large but relatively simple electromagnetic separation devices called<br />
calutrons <strong>to</strong> slowly refine the non-weapons-grade uranium compound feed down <strong>to</strong> weapons grade U-235.<br />
Analysts and Iraqi defec<strong>to</strong>rs report that centrifuges and other methods also have been used in the Iraqi U-<br />
235 refinement effort, but we are most aware <strong>of</strong> the fact that it was the calutron approach that the UN-<br />
SCOM inspec<strong>to</strong>rs documented in Iraq in the period immediately after the Gulf War. This slow but simple<br />
calutron process had been employed by the U.S. during the World War II Manhattan Project <strong>to</strong> create the<br />
“Little Boy” 15-kilo<strong>to</strong>n gun-assembly type a<strong>to</strong>m bomb that was dropped on Hiroshima, Japan.<br />
We view Israel’s suspected (but never formally acknowledged) nuclear deterrent as a defensive regional<br />
peace-keeper, but its existence probably has prompted Iraq <strong>to</strong> pursue a nuclear strategy. Israel<br />
is the only generally accepted, indigenous nuclear power in the Middle East, with weapons that were probably<br />
developed in close cooperation between French and Israeli nuclear researchers beginning in the 1950s,
Industrial Portfolio Strategy<br />
<strong>The</strong> <strong>Inflation</strong> <strong>Cycle</strong> <strong>of</strong> <strong>2002</strong> <strong>to</strong> <strong>2015</strong> ⎯ April 19, <strong>2002</strong> -68- Legg Mason Wood Walker, Inc.<br />
after the construction <strong>of</strong> the Pu-239-producing underground nuclear research reac<strong>to</strong>r facility at Dimona in<br />
the Negev Desert. Israel is suspected <strong>of</strong> possessing about 200 nuclear weapons, mostly <strong>of</strong> a tactical<br />
(battlefield applicability, as opposed <strong>to</strong> strategic, or intercontinental) size. Some <strong>of</strong> the weapons are believed<br />
<strong>to</strong> be “neutron bombs,” capable <strong>of</strong> large and fatal bursts <strong>of</strong> short-lived radiation without quite as<br />
much <strong>of</strong> a blast effect or any meaningful radioactive fallout. Though little is publicly known <strong>of</strong> Israeli defensive<br />
nuclear alerts, two are believed <strong>to</strong> have occurred in the past three decades. <strong>The</strong> first probably happened<br />
during the Oc<strong>to</strong>ber 1973 Egyptian and Syrian attacks on Israel. <strong>The</strong> second alert is believed <strong>to</strong> have<br />
occurred during the Gulf War, when Iraq fired "Scud" missiles on Tel Aviv and Haifa. This raised the threat<br />
<strong>of</strong> chemical and biological attacks on Israel that may have led <strong>to</strong> an Israeli nuclear response had U.S. antimissile<br />
(Patriot and other) units and aircraft sorties not been diverted <strong>to</strong> protect Israel by locating and destroying<br />
Scud launchers. Israel's longest-known range ballistic missile is the 1,500 kilometer (932 mile),<br />
1,000 kilogram payload, Jericho-2 (J-2), but since Iran’s capital city <strong>of</strong> Tehran is 1,600 kilometers and<br />
Saudi Arabia’s Riyadh is 1,400 kilometers from Israel, we believe that Israel’s nuclear forces are defensive<br />
in nature. <strong>The</strong>re are reports that Israel is developing a J-2B successor missile with a 2,500 kilometer (1,553<br />
mile) range, but we do not believe that this move alters Israel’s defensive posture. In all, the nuclear deterrent<br />
and the potential for a disproportionate response probably have kept the peace for Israel since the 1973<br />
War, and may have helped keep the Gulf War from expanding, in our opinion.<br />
We believe the Bush Administration has adopted the goal <strong>of</strong> a regime change in Iraq because it fears<br />
the Iraq <strong>of</strong> the future much more than the Iraq <strong>of</strong> the present. <strong>The</strong> his<strong>to</strong>ry <strong>of</strong> nuclear proliferation has<br />
been that just because a country obtains the nuclear card, it does not necessarily follow that the card will be<br />
played. So, instead <strong>of</strong> a short-run view, we believe the Bush Administration fears that if Iraq holds the reins<br />
<strong>of</strong> nuclear power it may later pursue more advanced ICBM-based fusion weapons and expansionary avenues<br />
it otherwise would not have chosen. <strong>The</strong> continuation <strong>of</strong> the rebound in Iraqi oil exports from very low<br />
levels in the 1990s <strong>to</strong> our estimate <strong>of</strong> 3.5 million barrels per day by <strong>2015</strong>, combined with the higher oil<br />
prices we expect, could provide Iraq with a windfall in the coming years. Our best estimate is that from<br />
<strong>2002</strong> <strong>to</strong> <strong>2015</strong>, Iraq may receive approximately $373 billion <strong>of</strong> cumulative oil revenues in real (year<br />
2000) U.S. dollars, versus about $121 billion received in the 1988 <strong>to</strong> 2001 period. Whether those funds<br />
are used <strong>to</strong> enrich the Iraqi people and diversify the economy, or <strong>to</strong> fund Saddam Hussein’s war machine, is<br />
a question we believe the world will have <strong>to</strong> face.<br />
If Iraq becomes a nuclear threat, the risks compound, in our view. Generally speaking, we believe the<br />
risk <strong>of</strong> a nuclear exchange between two equally armed parties is guided and deterred by the principle <strong>of</strong> Mutually<br />
Assured Destruction (MAD). Given that a MAD balance is not the case in the Middle East, the attention<br />
next shifts <strong>to</strong> Israel’s intentions. Since Israel has shown its posture with respect <strong>to</strong> its (suspected and<br />
implied) superior nuclear weapons <strong>to</strong> be defensive in nature on several occasions, we do not believe the<br />
country plans a preemptive nuclear strike. When nuclear forces are uneven, we believe that the risk <strong>of</strong> a preemptive<br />
strike by a country that has recently acquired nuclear weapons is an unpredictable mixture <strong>of</strong> proximity,<br />
psychology and response. In terms <strong>of</strong> proximity, Israel’s location and small land area (222 miles from<br />
Elat <strong>to</strong> Haifa, for example) are legitimate concerns. In terms <strong>of</strong> psychology, and also on the subject <strong>of</strong> Iraq,<br />
that country’s rout in a conventional-only foray in<strong>to</strong> Kuwait in the Gulf War, as well as Iraq’s inability <strong>to</strong><br />
modernize its military in the subsequent decade, probably reduces Iraq’s appetite for conventional invasion.<br />
On the subject <strong>of</strong> response, we also doubt that a new nuclear power such as, hypothetically, Iraq, would see<br />
a great deal <strong>to</strong> gain in a preemptive strike (or even a retalia<strong>to</strong>ry strike <strong>to</strong> a conventional invasion) with crude<br />
fission devices having limited destruction capability when the subsequent retaliation would likely be an
Industrial Portfolio Strategy<br />
<strong>The</strong> <strong>Inflation</strong> <strong>Cycle</strong> <strong>of</strong> <strong>2002</strong> <strong>to</strong> <strong>2015</strong> ⎯ April 19, <strong>2002</strong> -69- Legg Mason Wood Walker, Inc.<br />
overwhelming thermonuclear (fusion device) response by one or more countries with more sophisticated<br />
weapons. Even if Iraq were <strong>to</strong> become a neo-nuclear state, given the lopsided nuclear capabilities we<br />
see in the foreseeable future, and after successive Arab defeats in wars with Israel in 1948 <strong>to</strong> 1949,<br />
1967, and 1973 (plus the U.S. in the 1991), we doubt potential Arab (or Persian) state combatants are<br />
anxious <strong>to</strong> repeat past mistakes.<br />
Adding fuel, and perhaps an element <strong>of</strong> irrationality, <strong>to</strong> the Middle East soup, is the Palestinian issue.<br />
His<strong>to</strong>ry has shown that the human suffering on both sides <strong>of</strong> the region can be used <strong>to</strong> mold public support<br />
for actions that have largely economic or political roots. <strong>The</strong> failure <strong>of</strong> U.S. peace efforts may lead <strong>to</strong> an uncharacteristically<br />
unified Islamic country position against U.S. and Israeli interests, though the current<br />
Saudi regime does not appear <strong>to</strong> place great trust in Iraq’s Saddam Hussein in any case. As a result, we shift<br />
our focus <strong>to</strong> what we believe <strong>to</strong> be an underrated risk <strong>to</strong> regional stability in the Persian Gulf, which is the<br />
risk <strong>of</strong> internal rebellion if moderate regimes are perceived <strong>to</strong> be ineffective, and unfavorable demographics<br />
plus oil price deflation aggravates the economic situation.<br />
<strong>The</strong> Risk <strong>of</strong> Civil War That Targets Saudi Arabia's Ruling al-Saud Monarchy<br />
We believe that a key internal risk <strong>to</strong> Persian Gulf peace is Saudi Arabian political continuity, though<br />
we remind ourselves that it is all <strong>to</strong>o easy <strong>to</strong> underestimate the resilience and adaptability <strong>of</strong> Saudi Arabia's<br />
ruling al-Saud family, who have been an important part <strong>of</strong> Arabian life for over two centuries, and especially<br />
since the early 20th century. It is easy <strong>to</strong> overestimate Saudi Arabia's potential internal and external<br />
foes, most <strong>of</strong> which are poorly armed or trained in relation <strong>to</strong> the security and military forces <strong>of</strong> the Kingdom<br />
<strong>of</strong> Saudi Arabia. Nevertheless, extremist elements in Saudi Arabia are preying upon social and economic<br />
pressures <strong>to</strong> further their goals, one <strong>of</strong> which is replacing or bending the Saudi monarchy <strong>to</strong>ward the<br />
Sunni version <strong>of</strong> the Shiite government that <strong>to</strong>ppled the Shah <strong>of</strong> Iran in 1979. We believe that the Israeli/<br />
Palestinian question has migrated from a regional problem <strong>to</strong> a more volatile “East versus West” issue, and<br />
strengthened the hand <strong>of</strong> the radical factions in Saudi Arabia. In our view, Saudi Crown Prince Abdullah’s<br />
peace plan overtures are a sign that he is aware <strong>of</strong> the gravity <strong>of</strong> the situation on a personal and regional basis.<br />
Our view is that even if the al-Saud family were <strong>to</strong> be replaced, the realization <strong>of</strong> the radical’s nostalgic<br />
and <strong>to</strong> some degree mythical goal for Muslim unification is by no means certain, since a coup or a disorderly<br />
royal succession could devolve in<strong>to</strong> a fractious Yugoslavia-type quagmire on a much larger scale,<br />
given the large land area, oil resources, and diverse tribal and religious interests <strong>of</strong> Saudi Arabia.<br />
Radical factions in Saudi Arabia have been especially critical <strong>of</strong> the Monarchy’s decision <strong>to</strong> allow the<br />
presence <strong>of</strong> the U.S. military in Saudi Arabia, the home <strong>of</strong> Islam’s holy sites in Mecca and Medina.<br />
Our analysis concludes that some <strong>of</strong> the criticism <strong>of</strong> this continuing U.S. presence on religious pretexts is a<br />
ruse by insurgent parties <strong>to</strong> rally popular support and encourage the exit <strong>of</strong> the one force capable <strong>of</strong> maintaining<br />
the equipment already sold <strong>to</strong> Saudi Arabia, and capable <strong>of</strong> coordinating military stability in the region.<br />
In addition, we believe King Fahd’s implicit understanding with the U.S. after the Gulf War, which<br />
entailed Saudi cooperation in the prevention <strong>of</strong> oil price inflation in exchange for a U.S. defense umbrella,<br />
may be wearing thin. Given the poor state <strong>of</strong> Persian Gulf joint military cooperation and, <strong>to</strong> a degree, readiness,<br />
then unless U.S. forces are unexpectedly ousted by the government in the interim, our view is that a U.<br />
S. military exit from Saudi Arabia may be many years away.<br />
Civil unrest in Saudi Arabia has been an major issue since rapid “westernization” in the 1970s led <strong>to</strong><br />
an extremist uprising at Mecca in 1979, but we believe that unrest has been revived in recent years by
Industrial Portfolio Strategy<br />
<strong>The</strong> <strong>Inflation</strong> <strong>Cycle</strong> <strong>of</strong> <strong>2002</strong> <strong>to</strong> <strong>2015</strong> ⎯ April 19, <strong>2002</strong> -70- Legg Mason Wood Walker, Inc.<br />
the cumulative economic pressure <strong>of</strong> low oil prices since the early 1980s. Exhibit 55 is our graphic depiction<br />
<strong>of</strong> the pressure brought <strong>to</strong> bear on the Persian Gulf region by low oil prices. <strong>The</strong> chart shows the cumulative<br />
transfer <strong>of</strong> wealth from the Western nations <strong>to</strong> the Persian Gulf from 1970 <strong>to</strong> 1981, followed by<br />
the transfer <strong>of</strong> wealth from the Persian Gulf back <strong>to</strong> the West in the period 1982 <strong>to</strong> 2001. We show the<br />
West-<strong>to</strong>-East transfer by measuring the cumulative dollar value <strong>of</strong> the annual barrels <strong>of</strong> oil exported by the<br />
Persian Gulf nations multiplied by the annual average real (inflation-adjusted) price for that oil above the<br />
1970 base level <strong>of</strong> $6.01 per barrel (in real, year 2000 dollars). <strong>The</strong>n, <strong>to</strong> demonstrate the East-<strong>to</strong>-West<br />
wealth reversal, we show the cumulative value <strong>of</strong> the annual barrels <strong>of</strong> oil exported by the Persian Gulf nations<br />
multiplied by the annual average real price for that oil below the 1981 base level <strong>of</strong> $65.37 per barrel<br />
(also in real, year 2000 dollars). Because <strong>of</strong> the differing importance <strong>of</strong> oil in relation <strong>to</strong> GDP, this zero-sum<br />
game has been more difficult for the Persian Gulf since 1981 than it was for the West in the 1970s when the<br />
tables were turned. It may be mere coincidence, but in 1995 the cumulative inflation-adjusted transfer <strong>of</strong><br />
wealth out <strong>of</strong> the Persian Gulf exceeded $1.8 trillion, finally matching the cumulative inflow <strong>of</strong> $1.8 trillion<br />
from 1970 <strong>to</strong> 1981. In the very next year, Osama bin Laden’s al-Qaeda network unified a variety <strong>of</strong> disaffected<br />
groups, and thereafter commenced a bombing campaign. While the West has achieved considerable<br />
success dismantling and destroying al-Qaeda, we believe it is difficult <strong>to</strong> kill the Hydra without stanching<br />
the blood flow that sustains it. In the case <strong>of</strong> Saudi Arabia, radicals increasingly are exporting their beliefs<br />
<strong>to</strong> other countries, and their recruitment is sustained by the economic difficulties resulting from oil price<br />
deflation, in our view. This terrorist export is, <strong>of</strong> course, unwelcome in the West, and the risk it poses <strong>to</strong><br />
Exhibit 55 – Cumulative Effect <strong>of</strong> Oil <strong>Price</strong> Swings on Wealth Transfer, 1970 <strong>to</strong> 2001E<br />
$2,000B<br />
Cumulative effect <strong>of</strong> oil price swings on wealth transfer in<strong>to</strong> and out <strong>of</strong> Persian Gulf<br />
Cumulative real $ billion (index year = 2000)<br />
$1,000B<br />
$0B<br />
-$1,000B<br />
-$2,000B<br />
-$3,000B<br />
1970<br />
1971<br />
1972<br />
1973<br />
1974<br />
1975<br />
1976<br />
1977<br />
1978<br />
1979<br />
1980<br />
1981<br />
1982<br />
1983<br />
1984<br />
1985<br />
1986<br />
1987<br />
1988<br />
1989<br />
1990<br />
1991<br />
1992<br />
1993<br />
1994<br />
1995<br />
1996<br />
1997<br />
1998<br />
1999<br />
2000<br />
Cumulative wealth transfer <strong>to</strong><br />
Persian Gulf nations resulting<br />
from crude oil price increase<br />
over the 1970 real price level <strong>of</strong><br />
$6.01/bbl (priced in year 2000<br />
dollars).<br />
Cumulative wealth transfer away from Persian<br />
Gulf nations due <strong>to</strong> crude oil price decrease<br />
from the 1981 real price level <strong>of</strong> $65.37/bbl<br />
(priced in year 2000 dollars).<br />
2001E<br />
-$4,000B<br />
Source: Legg Mason format and concept, Persian Gulf states included in this analysis are Saudi Arabia, Iran, Iraq, U.A.E., Kuwait and<br />
Qatar. Data from the Energy Information Administration, United Nations Energy Statistics Database, OPEC Annual Statistical Bulletin,<br />
U.S. Bureau <strong>of</strong> Labor Statistics
Industrial Portfolio Strategy<br />
<strong>The</strong> <strong>Inflation</strong> <strong>Cycle</strong> <strong>of</strong> <strong>2002</strong> <strong>to</strong> <strong>2015</strong> ⎯ April 19, <strong>2002</strong> -71- Legg Mason Wood Walker, Inc.<br />
Saudi Arabia’s standing in the<br />
international community raises<br />
the diplomatic ante, and destabilizes<br />
the oil price outlook, in<br />
our view.<br />
To better understand Saudi<br />
political succession risk,<br />
which could have implications<br />
for oil prices, we provide<br />
a box his<strong>to</strong>ry <strong>of</strong> Saudi<br />
Arabia and its monarchy.<br />
King Fahd is the eldest brother<br />
in a group <strong>of</strong> seven males who<br />
have held key positions in the<br />
Kingdom, known as the Sudairi<br />
Seven, all sons <strong>of</strong> Ibn<br />
Saud, but who also share a<br />
common mother (Hassa bint<br />
Ahmad al-Sudairi). Ibn Saud<br />
had 22 wives, many for political<br />
alliance purposes, and<br />
found a way around the Muslim<br />
limitation <strong>of</strong> four wives<br />
reportedly by utilizing divorce.<br />
Aside from Fahd, another<br />
member <strong>of</strong> the Sudairi Seven<br />
whom we discuss in this report<br />
is Prince Sultan (b. 1928), the<br />
Minister <strong>of</strong> Defense and Aviation<br />
and Second Deputy Prime<br />
Minister. Sultan’s son, Bandar<br />
(b. 1949), is also widely recognized<br />
in America as the longtime<br />
Saudi Ambassador <strong>to</strong> the<br />
United States. Crown Prince<br />
Abdullah, Fahd’s half-brother,<br />
is Saudi Arabia’s de fac<strong>to</strong><br />
ruler since Fahd was incapacitated<br />
by stroke in the late<br />
1990s. Prince Abdullah has no<br />
brothers with whom <strong>to</strong> form a<br />
familial power base, and has<br />
led the more pluralistic and<br />
Bedouin (but highly skilled)<br />
A Brief His<strong>to</strong>ry <strong>of</strong> Saudi Arabia and the al-Saud Royal Family<br />
Saudi Arabia leapt from a nomadic and agrarian society <strong>to</strong> an urban, oilbased<br />
one in the space <strong>of</strong> a few decades, and we do not believe it has the his<strong>to</strong>rical<br />
gravitas <strong>of</strong> other states in the region that are now majority Muslim, such as<br />
the Ot<strong>to</strong>mans (Turkey), the Sumerian then Babylonians (Iraq) or the Persians<br />
(Iran). What Saudi Arabia does have is sudden wealth via the region’s most vast<br />
oil reserves, and that quantum leap in<strong>to</strong> modernity goes a long way <strong>to</strong>ward explaining<br />
its internal struggles. Before oil was an issue, the ances<strong>to</strong>rs <strong>of</strong> the al-<br />
Saud family first gained prominence in the year 1744 when a local leader<br />
named Muhammad Ibn Saud (b. 1710, d. 1765) struck an alliance with Islamic<br />
religious leader Muhammad Ibn Abd al Wahhab, namesake <strong>of</strong> the purist Wahhabi<br />
form <strong>of</strong> Islam, and the two began a volatile but successful alliance that continues<br />
<strong>to</strong>day. Muhammad Ibn Saud's son, Abdul Aziz, conquered most <strong>of</strong> the Arabian<br />
Peninsula by 1806, but was captured and executed by the Ot<strong>to</strong>mans in the early<br />
19th century, and what is now Saudi Arabia changed hands several times over the<br />
next century. <strong>The</strong> foundations <strong>of</strong> the modern Saudi Arabia began when King Abdul<br />
Aziz (b. 1879, d.1953, now known as Ibn Saud), the great-great grandson <strong>of</strong><br />
Muhammad Ibn Saud, re<strong>to</strong>ok Riyadh in 1902. Ibn Saud wore down the Ot<strong>to</strong>mans,<br />
who left in 1912, raising Ibn Saud’s stature and laying the groundwork for his<br />
conquest and unification <strong>of</strong> the peninsula from 1920 <strong>to</strong> 1932 with the help <strong>of</strong><br />
Wahhabi soldiers, known as Ikhwan (brethren). In 1929, Ibn Saud had <strong>to</strong> put<br />
down the rebellious and warlike Ikhwan at the Battle <strong>of</strong> Sibilla, a poignant example<br />
<strong>of</strong> the internal struggle between the al-Saud and Wahhabi. <strong>The</strong> modern economic<br />
base in Saudi Arabia began in 1933, when Ibn Saud signed a royalty<br />
oil concession with America's Standard Oil Company. Ibn Saud died in 1953,<br />
and was succeeded by his eldest son Saud, who ruled for 11 years, engaging in<br />
pr<strong>of</strong>ligate spending and defending Saudi Arabia from the “Pan-Arab” ambitions<br />
<strong>of</strong> Egypt’s Gamal Adbel Nasser (b. 1918, d. 1970). Saud eventually ceded power<br />
<strong>to</strong> his half-brother Faisal, who was Crown Prince and Prime Minister. Faisal continued<br />
the internal and external struggle against Nasser, <strong>to</strong> include a defense<br />
build-up after 1966, but perhaps Faisal’s legacy, in our view, is his recognition <strong>of</strong><br />
the intrinsic value <strong>of</strong> the country's vast oil reserves, which led <strong>to</strong> the Oil Embargo<br />
<strong>of</strong> 1974. Faisal was assassinated in 1975 by a deranged nephew who acted alone,<br />
and Faisal’s half-brother and successor, King Khalid, presided over five-year<br />
plans that modernized the country in a period <strong>of</strong> great wealth. As with Saud,<br />
Khalid’s rule featured a strong role by his Crown Prince Fahd (b. 1923). Saud<br />
and Khalid faced their own insurgency, similar <strong>to</strong> the Battle <strong>of</strong> Sibilla, when in<br />
1979 they had <strong>to</strong> put down an extremist uprising and occupation in Mecca. When<br />
Khalid died in 1982, he was succeeded by Fahd, who has ruled in some <strong>of</strong> Saudi<br />
Arabia’s most challenging years, including the oil price deflation <strong>of</strong> the 1980s,<br />
the Gulf War, and the doubling <strong>of</strong> Saudi Arabia’s population <strong>to</strong> over 20 million<br />
during his reign. Fahd suffered a stroke in 1995, and since 1997 Crown<br />
Prince and half-brother Abdullah (b. 1924), who is the First Deputy Prime<br />
Minister, has assumed the day-<strong>to</strong>-day responsibilities <strong>of</strong> the crown. In early<br />
<strong>2002</strong>, Abdullah reproposed a land (pre-1967 borders, a Palestinian State) for<br />
peace (full diplomatic recognition <strong>of</strong> Israel) plan with Israel.
Industrial Portfolio Strategy<br />
<strong>The</strong> <strong>Inflation</strong> <strong>Cycle</strong> <strong>of</strong> <strong>2002</strong> <strong>to</strong> <strong>2015</strong> ⎯ April 19, <strong>2002</strong> -72- Legg Mason Wood Walker, Inc.<br />
Saudi National Guard since 1963. Prince Abdullah is generally regarded as having a more fundamentalist<br />
approach <strong>to</strong> Islam than Fahd, and is reputed <strong>to</strong> be a strong-willed reformer and a pragmatist.<br />
Royal succession could cause political turmoil in Saudi Arabia. Though Prince Abdullah is reportedly<br />
healthy, at age 78, royal succession is still an open question vis-à-vis other members <strong>of</strong> the Sudairi Seven,<br />
their descendants, or other members <strong>of</strong> the royal family. We note that there is a strong relationship between<br />
Abdullah and Saudi Minister <strong>of</strong> Foreign Affairs Saud al-Faisal, the latter being the son <strong>of</strong> former Saudi<br />
King Faisal, and it is possible that Saud al-Faisal could emerge as the next Saudi Crown prince upon King<br />
Fahd’s passing, in our view. <strong>The</strong> lack <strong>of</strong> clarity with regard <strong>to</strong> succession is not a major deviation from the<br />
political his<strong>to</strong>ry <strong>of</strong> Saudi Arabia. Although Saudi Arabia has established a number <strong>of</strong> consultative or democratic<br />
institutions, <strong>to</strong> include the Majlis al Shuria (Consultative Council) that was revived by King Fahd after<br />
the Gulf War, our view is that for the success <strong>of</strong> the al-Saud monarchy, the next Saudi King must<br />
be a reformer and have more national prosperity via higher oil prices.<br />
In our view, the power structure that has evolved in Saudi Arabia is a triumvirate, and its continued<br />
stability is <strong>of</strong> global interest <strong>to</strong> avoid major war and commodity and consumer inflation. In one corner <strong>of</strong> the<br />
Saudi triumvirate, there is the secular political authority <strong>of</strong> the al-Saud monarchy. <strong>The</strong> Saud family derives<br />
inspiration and occasional force from the Islamic religious authorities, who occupy the opposite corner,<br />
some <strong>of</strong> whom are the descendants <strong>of</strong> Abdul Wahhab, and are known as the al-Sheiks. Both parties derive<br />
earthly sustenance from the region’s economic interests - mainly related <strong>to</strong> oil in the modern era – which<br />
occupies the third corner. We believe that oil price deflation since the early 1980s has destabilized the economic<br />
interests <strong>of</strong> the region, since the his<strong>to</strong>ry <strong>of</strong> the Saudi monarchy has been <strong>to</strong> use financial largesse <strong>to</strong><br />
“buy <strong>of</strong>f” discontent. We believe that this economic pressure has created a situation in which some <strong>of</strong> the<br />
long-simmering religious authorities have used the economic malaise <strong>to</strong> blame the political authorities for<br />
economic failure and its consequences, potentially in a bid for power and increased religious governance.<br />
<strong>The</strong> rapid urbanization and collapse <strong>of</strong> per capita GNP in Saudi Arabia, shown in Exhibit 56, has left<br />
the country with a rising cadre <strong>of</strong> disaffected young men, in our view. <strong>The</strong> situation is aggravated by a<br />
birth rate that is among the highest in the world, and a surge from 2000 <strong>to</strong> <strong>2015</strong> <strong>of</strong> potentially disenfranchised<br />
young Saudis relative <strong>to</strong> older, more established, and presumably less fiery Saudis, depicted in Exhibit<br />
57. Unless the oil-based economy <strong>of</strong> Saudi Arabia receives a boost, and parlays that wealth in<strong>to</strong> a successful<br />
diversification effort, we believe this youth explosion will collide with a dearth <strong>of</strong> private industry<br />
job opportunities, pushing the existing unemployment rate <strong>of</strong> approximately 25% even higher. In fact, youth<br />
explosion is a pan-Gulf problem. Among the Gulf states, ex-Iran and Iraq, non-citizens make up 37% <strong>of</strong> the<br />
population <strong>of</strong> 32.4 million, and residents under age 15 make up 40% <strong>of</strong> the population. In Saudi Arabia in<br />
particular, where the economy has failed <strong>to</strong> diversify beyond oil, in our view, this raises the prospect that<br />
more people will fall under the spell <strong>of</strong> the radical elements.<br />
With approximately 5,000 Saudi princes, the odds <strong>of</strong> at least several hundred “black sheep” are quite<br />
high, in our view. Those “bad apples” fuel resentment and may give the approximately 100 ruling princes a<br />
bad name, so we believe that current discussions regarding a culling <strong>of</strong> the royal roster may gain momentum,<br />
especially since high birth rates make royal expansion an increasingly serious problem.<br />
As a result, Saudi capital flight and corruption are serious issues, the result <strong>of</strong> some members <strong>of</strong> the<br />
royal family and high-level technocrats protecting their self-interest in a period <strong>of</strong> economic pressure. <strong>The</strong>re
Industrial Portfolio Strategy<br />
<strong>The</strong> <strong>Inflation</strong> <strong>Cycle</strong> <strong>of</strong> <strong>2002</strong> <strong>to</strong> <strong>2015</strong> ⎯ April 19, <strong>2002</strong> -73- Legg Mason Wood Walker, Inc.<br />
is approximately $700 billion<br />
<strong>of</strong> private Saudi wealth<br />
abroad, as well as $266 billion<br />
from the United Arab<br />
Emirates, $163 billion from<br />
Kuwait, and $65 billion<br />
from the other members <strong>of</strong><br />
the Gulf Cooperation Council.<br />
This wealth is in the<br />
hands <strong>of</strong> an estimated<br />
200,000 individuals, equal<br />
<strong>to</strong> about $6 million per capita<br />
among the holders. It is<br />
noteworthy that an estimated<br />
$400 billion <strong>of</strong> this<br />
capital has been invested in<br />
Western s<strong>to</strong>ck markets, and<br />
has thus benefited from the<br />
very same disinflationdriven<br />
equity bull market <strong>of</strong><br />
the 1982 <strong>to</strong> 2001 period<br />
that was the antithesis <strong>of</strong><br />
the poor economic opportunity<br />
afforded the oil-based<br />
economies. Domestic uses<br />
for the capital are few, as<br />
we believe Saudi Arabia<br />
suffers from inadequate diversification<br />
beyond oil,<br />
and an embryonic work<br />
ethic that relies <strong>to</strong>o heavily<br />
on foreign workers and<br />
meaningless government<br />
jobs. Oil still represents approximately<br />
70% <strong>of</strong> state<br />
revenues and 40% <strong>of</strong> GDP,<br />
according <strong>to</strong> the EIA. Government<br />
positions account<br />
for 40% <strong>of</strong> all jobs, versus<br />
25% in industry (mostly<br />
petrochemicals) and oil. In<br />
time, free markets and high<br />
rate-<strong>of</strong>-return domestic oilrelated<br />
projects could repatriate<br />
much <strong>of</strong> this wealth,<br />
Exhibit 56 – Saudi Arabian GNP Per Capita and Urbanization<br />
Saudi Arabian GNP Per Capita, Constant 1995 U.S.$<br />
$12,000<br />
$11,000<br />
$10,000<br />
$9,000<br />
$8,000<br />
$7,000<br />
$6,000<br />
Exhibit 57 – Saudi Arabia Youth Wave, 1974 <strong>to</strong> 2040E<br />
200%<br />
190%<br />
180%<br />
170%<br />
160%<br />
150%<br />
140%<br />
130%<br />
120%<br />
110%<br />
100%<br />
1970<br />
1971<br />
1972<br />
1973<br />
1974<br />
1975<br />
1976<br />
1977<br />
1978<br />
1979<br />
1980<br />
1981<br />
1982<br />
1983<br />
1984<br />
1985<br />
1986<br />
1987<br />
1988<br />
1989<br />
1990<br />
1991<br />
1992<br />
1993<br />
1994<br />
1995<br />
1996<br />
1997<br />
1998<br />
Saudi Arabia GNP per Capita (Constant 1995 U.S.$)<br />
Source: <strong>The</strong> International Monetary Fund, World Economic Outlook Database 2001<br />
Saudi Arabia: A Measure <strong>of</strong> the Passions <strong>of</strong> a Population?<br />
1980<br />
1990<br />
2000<br />
Ratio <strong>of</strong> Less Stable (age 20-34) <strong>to</strong> More Established (age 35-49)<br />
Source: U.S. Census Bureau, International Data Base, 2000<br />
2010<br />
A<br />
volatile<br />
combination<br />
<strong>The</strong> rise in young Saudis with<br />
few job opportunities relative<br />
<strong>to</strong> older, and presumably more<br />
stable Saudis, provides fodder<br />
for religious extremists in the<br />
<strong>2002</strong> <strong>to</strong> <strong>2015</strong> period, in our<br />
view.<br />
2020<br />
2030<br />
90%<br />
85%<br />
80%<br />
75%<br />
70%<br />
65%<br />
60%<br />
55%<br />
50%<br />
Saudi Arabian Urban Population % <strong>of</strong> Total<br />
Saudi Arabia Urban Population as a % <strong>of</strong> <strong>The</strong> Total<br />
2040
Industrial Portfolio Strategy<br />
<strong>The</strong> <strong>Inflation</strong> <strong>Cycle</strong> <strong>of</strong> <strong>2002</strong> <strong>to</strong> <strong>2015</strong> ⎯ April 19, <strong>2002</strong> -74- Legg Mason Wood Walker, Inc.<br />
if free markets are given time <strong>to</strong> work. In addition <strong>to</strong> improved oil-based prosperity, we believe repatriation<br />
<strong>of</strong> capital in Saudi Arabia will require greater privatization, some form <strong>of</strong> taxation, a reduction <strong>of</strong> corruption<br />
and bribery, improved legal standards and property rights protection, and social reforms such as improved<br />
use <strong>of</strong> female human capital. <strong>The</strong> success without excessive reliance on hydrocarbons <strong>of</strong> Oman,<br />
Bahrain, and Dubai would appear <strong>to</strong> <strong>of</strong>fer examples that Saudi Arabia could follow, albeit selectively, moderately,<br />
and slowly, in our view.<br />
<strong>The</strong> Risk <strong>of</strong> Conventional (Non-Nuclear) War Between States in the Region<br />
Because our interest is the oil resources <strong>of</strong> the Persian Gulf, this section does not address other regional<br />
hot spots. For example, the Israeli-Palestinian imbroglio, or a worsening <strong>of</strong> the contentious Pakistan/<br />
India face-<strong>of</strong>f, could destabilize the region. As inves<strong>to</strong>rs, our focus is on the oil-rich Persian Gulf, particularly<br />
Saudi Arabia, Iraq and Iran, although any conflict could have a contagion effect in the region.<br />
<strong>The</strong> U.S. military presence in the Persian Gulf is invited, and regionwide. In Exhibit 58, we provide a<br />
Middle East map. <strong>The</strong> U.S. Central Command (CENTCOM) and coalition partners maintain a personnel or<br />
forward-deployed material presence in Kuwait and several border states, including the United Arab Emirates,<br />
Bahrain, Oman and Qatar. <strong>The</strong> major CENTCOM facility in Saudi Arabia is Prince Sultan Airbase,<br />
but since aircraft carriers play a large role in force projection, we note that CENTCOM’s naval presence is<br />
Exhibit 58 – Middle East Map<br />
Source: Legg Mason Wood Walker; map outline from www.graphicmaps.com
Industrial Portfolio Strategy<br />
<strong>The</strong> <strong>Inflation</strong> <strong>Cycle</strong> <strong>of</strong> <strong>2002</strong> <strong>to</strong> <strong>2015</strong> ⎯ April 19, <strong>2002</strong> -75- Legg Mason Wood Walker, Inc.<br />
the Fifth Fleet, headquartered<br />
in Bahrain. If the U.<br />
S. military presence were<br />
<strong>to</strong> be phased out prematurely<br />
in Saudi Arabia, our<br />
view is that it would be<br />
difficult <strong>to</strong> perform a deterrence<br />
role with only forward-deployed<br />
material<br />
and naval facilities.<br />
Exhibit 59 - <strong>The</strong> Persian Gulf Military Balance in 2001<br />
Other Artillery + Fixed<br />
Active Main Armored Multiple Wing<br />
Military Battle Fighting Rocket Combat Armed<br />
Personnel Tanks Vehicles Launchers Aircraft Helicopters<br />
Iraq 429,000 2,700 3,400 2,200 353 120<br />
Saudi Arabia 226,500 1,055 4,285 568 432 33<br />
Saudi military readiness<br />
has been a thorny issue.<br />
<strong>The</strong> all-in life cycle costs<br />
<strong>of</strong> a weapons system are<br />
usually at least twice the<br />
purchase price. <strong>The</strong> pressure<br />
from low oil prices<br />
has slowed Saudi Arabia’s<br />
military purchases, and<br />
spurred a desire <strong>to</strong> better<br />
utilize equipment on hand.<br />
Prior efforts <strong>to</strong> diversify<br />
arms vendors have proved<br />
<strong>to</strong> be an obstacle <strong>to</strong> force<br />
integration and<br />
interoperability, however,<br />
and aggravated an alreadydifficult<br />
readiness situation.<br />
This has contributed<br />
<strong>to</strong> the long-standing U.S.<br />
advisor presence in the<br />
Kingdom, aggravating the<br />
Islamic radical groups, and<br />
creating a problem for<br />
which there is no easy solution.<br />
<strong>The</strong> balance <strong>of</strong> military<br />
power in the Persian<br />
Gulf requires more than<br />
a cursory examination.<br />
In Exhibit 59, we provide<br />
a survey <strong>of</strong> the Persian<br />
Gulf military strength. On<br />
Kuwait 15,300 385 455 68 76 20<br />
Bahrain 11,000 106 411 107 24 26<br />
Oman 43,500 141 219 109 40 -<br />
Qatar 12,330 44 284 44 18 12<br />
UAE 65,000 237 1,138 289 99 49<br />
Yemen 66,300 1,030 1,290 702 89 8<br />
Total Other Gulf (1) 213,430 1,943 3,797 1,319 346 115<br />
Iran 513,000 1,410 1,105 3,224 304 100<br />
(1) Smaller Gulf states bordering or bridging Saudi Arabia. Military readiness is a problem, and there is<br />
generally considered <strong>to</strong> be little military cooperation within the Gulf Cooperation Counsel.<br />
Source: Center for Strategic and International Studies’ Anthony H. Cordesman draft report titled<br />
Saudi Military Forces Enter the 21st Century<br />
Exhibit 60 - Military Quality vs. Quantity in the Persian Gulf, 2001<br />
Total Medium- <strong>to</strong> % Medium- Fixed Medium- <strong>to</strong> % Medium-<br />
Main High- <strong>to</strong> High- Wing High- <strong>to</strong> High-<br />
Battle Quality (1) Quality Combat Quality (2) Quality<br />
Tanks Tanks Tanks Aircraft Aircraft Aircraft<br />
Iraq 2,700 1,000 37% 353 112 32%<br />
Saudi Arabia 1,055 765 73% 432 281 65%<br />
Kuwait 385 368 96% 76 60 79%<br />
Bahrain 106 106 100% 24 12 50%<br />
Oman 141 117 83% 40 28 70%<br />
Qatar 44 - 0% 18 12 67%<br />
UAE 237 192 81% 99 84 85%<br />
Yemen 1,030 310 30% 89 22 25%<br />
Total Other Gulf (3) 1,943 1,093 56% 346 218 63%<br />
Iran 1,410 715 51% 304 175 58%<br />
(1) Medium- <strong>to</strong> high-quality tanks, primarily M-1 and M-60 (U.S.), Tupolev-72 and Tupolev-62 (F.S.U.)<br />
(2) Medium- <strong>to</strong> high-quality aircraft are F-15 C/D/S (U.S.), Mirage F-1 (Fr.), MiG-29/25 and Su-20/22 (F.S.U.),<br />
Tornado IDS/ADV (UK), F-14 (U.S.), F-4E (U.S.)<br />
(3) Smaller Gulf states bordering or bridging Saudi Arabia. Military readiness is a problem, and there is<br />
generally considered <strong>to</strong> be little military cooperation within the Gulf Cooperation Counsel.<br />
Source: Center for Strategic and International Studies’ Anthony H. Cordesman draft report titled<br />
Saudi Military Forces Enter the 21st Century
Industrial Portfolio Strategy<br />
<strong>The</strong> <strong>Inflation</strong> <strong>Cycle</strong> <strong>of</strong> <strong>2002</strong> <strong>to</strong> <strong>2015</strong> ⎯ April 19, <strong>2002</strong> -76- Legg Mason Wood Walker, Inc.<br />
paper, Iraq appears <strong>to</strong> have a formidable conventional military, <strong>to</strong> include the region’s second-largest number<br />
<strong>of</strong> active military personnel (429,000), and the largest number <strong>of</strong> main battle tanks (2,700). Saudi Arabia<br />
has the most armored fighting vehicles (4,285) and fixed wing combat aircraft (432), and Iran has the<br />
most active military personnel (513,000), the most artillery pieces (3,224) and the only indigenous navy.<br />
But a closer examination <strong>of</strong> quality rather than quantity tells a different s<strong>to</strong>ry. In Exhibit 60, we observe that<br />
73% <strong>of</strong> Saudi Arabia's tanks are medium- <strong>to</strong> high-quality, compared <strong>to</strong> 37% in Iraq and 51% in Iran. In addition,<br />
65% <strong>of</strong> Saudi Arabia's combat aircraft are medium- <strong>to</strong> high-quality, versus 32% for Iraq and 58% for<br />
Iran.<br />
We do not believe that Iraq has ever recovered militarily from the Gulf War defeat. According <strong>to</strong> U.S.<br />
Army Lieutenant General Tom Kelly, during the Gulf War "Iraq went from the fourth-largest army in the<br />
world <strong>to</strong> the second-largest army in Iraq in 100 hours." Little appears <strong>to</strong> have changed for Iraq’s conventional<br />
forces since 1991, in our view. Since 1989, the year before the Iraqi invasion <strong>of</strong> Kuwait, the troop<br />
strength <strong>of</strong> Iraq has declined 52%, and its main battle tank inven<strong>to</strong>ry is down 51%, with most <strong>of</strong> the losses<br />
occurring during the Gulf War itself. In contrast, Saudi Arabia's troop strength is up 179%, and its main battle<br />
tank inven<strong>to</strong>ry is up 92%.<br />
Sparked by fear and vigilance, Saudi Arabia has been one <strong>of</strong> the largest importers <strong>of</strong> military hardware<br />
in the world each year for the last two decades. Saudi Arabia ranked first in the years 1989 <strong>to</strong> 1999 in<br />
terms <strong>of</strong> new arm deliveries. Saudi Arabia <strong>to</strong>ok heed when the Shah fell in Iran in 1979, ousted by a Shiite<br />
rebellion, and Saudi Arabia was further alarmed when there was a risk that Iraq would lose the Iran-Iraq<br />
War in the period 1984 <strong>to</strong> 1987. <strong>The</strong> Gulf War <strong>of</strong> 1990 <strong>to</strong> 1991 caused a similar reaction in Saudi Arabia,<br />
which saw a brewing threat <strong>to</strong> its borders. In the period 1995 <strong>to</strong> 2000E, military expenditures <strong>to</strong>taled $109.7<br />
billion for Saudi Arabia, $8.4 billion for Iraq, $28 billion for Iran, and $60.1 billion for the bordering Gulf<br />
states. As a percentage <strong>of</strong> GDP, Saudi military expenditures are now 14.5%, almost three times larger than<br />
Iraq and five times larger than Iran. Arms imports as a percentage <strong>of</strong> <strong>to</strong>tal imports <strong>of</strong> Saudi Arabia are approximately<br />
40%, as compared <strong>to</strong> approximately 12% for the Middle East as a whole. Prince Sultan has<br />
been instrumental in the Saudi military build-up, <strong>of</strong>ten buying what we believe are superior U.S. armaments,<br />
but because <strong>of</strong> U.S. ties <strong>to</strong> Israel and occasional Israeli resistance <strong>to</strong> U.S. sales <strong>to</strong> Saudi Arabia, the<br />
Kingdom has diversified its purchases.<br />
Central <strong>to</strong> the ability <strong>of</strong> Saudi Arabia <strong>to</strong> face a conventional war threat from a neighboring country is<br />
the structure <strong>of</strong> the Saudi military itself, and the level <strong>of</strong> esprit de corps. Saudi Arabia and Iraq have<br />
comparable pools <strong>of</strong> men <strong>of</strong> military age. Iran, with its larger population, has more draft-age men. <strong>The</strong> unsuccessful<br />
experience <strong>of</strong> Saudi Arabia in the Gulf War with respect <strong>to</strong> Pakistani troops contributed <strong>to</strong> a lack<br />
<strong>of</strong> faith among the Saudi military establishment <strong>of</strong> relying upon foreign troops at the combat level, and a<br />
decision was made <strong>to</strong> rely upon a pr<strong>of</strong>essional military in the future. <strong>The</strong> level <strong>of</strong> education and training <strong>of</strong><br />
the Saudi <strong>of</strong>ficer group, many <strong>of</strong> whom are drawn from the royal family, has greatly improved since the pre-<br />
Oil Embargo years, but Saudi <strong>of</strong>ficers performing military training in the U.S. are down approximately 85%<br />
since the early 1990s, and American advisors and civilian contrac<strong>to</strong>rs are key <strong>to</strong> maintaining Saudi Arabia’s<br />
military hardware. Another problem Saudi Arabia has faced in the creation <strong>of</strong> a pr<strong>of</strong>essional military<br />
class is the seniority-based system found in portions <strong>of</strong> the Saudi <strong>of</strong>ficer corps, which is perceived as an<br />
even greater problem than royal nepotism. But as evidence that Saudi <strong>of</strong>ficer positions are considered <strong>to</strong> be<br />
highly prestigious, the Saudi Arabian National Guard (SANG) Academy, which is the more proletarian<br />
branch <strong>of</strong> the service had a 15% acceptance rate last year, which was, coincidentally, approximately the
Industrial Portfolio Strategy<br />
<strong>The</strong> <strong>Inflation</strong> <strong>Cycle</strong> <strong>of</strong> <strong>2002</strong> <strong>to</strong> <strong>2015</strong> ⎯ April 19, <strong>2002</strong> -77- Legg Mason Wood Walker, Inc.<br />
same acceptance rate as the U.S. Military Academy at West Point. Even the SANG quality <strong>of</strong> troops, many<br />
<strong>of</strong> whom were simple Bedouin just a couple <strong>of</strong> decades ago, has improved. Our view is that Prince Sultan's<br />
build-up <strong>of</strong> Saudi defense forces has shown admirable foresight, given the rising tensions in the region, and<br />
Prince Abdullah’s stewardship <strong>of</strong> the SANG has helped produce an impressive, motivated fighting force.<br />
Still, there is hope among many in the Saudi royal family, and many outside the family, that if Prince Abdullah<br />
becomes King, he will shift the focus from military hardware purchases <strong>to</strong> the less glamorous, but<br />
more critical, readiness and integration issue, and gradually reducing the reliance on outside advisors.<br />
<strong>The</strong> Soviet-era weaponry <strong>of</strong> Saudi Arabia's potential opposition does not enjoy a favorable his<strong>to</strong>ry<br />
versus American military equipment, which lessens the conventional war risk, in our view. As evidence,<br />
we cite Operation Galilee in the spring <strong>of</strong> 1982, in which Israel responded <strong>to</strong> Palestinian attacks launched<br />
from southern Lebanon. In that operation, Israeli Air Force (IAF) pilots flying U.S. F-15 (Eagle) and F-16<br />
(Falcon) aircraft, both <strong>of</strong> which are still in the IAF and U.S. arsenal in updated models, engaged the Syrian<br />
Air Force flying Soviet MiG-21 and MiG-23 aircraft over the Bekaa Valley. <strong>The</strong> IAF downed 90 Syrian<br />
MiGs in aerial combat without a single aircraft lost. Another example occurred in the Gulf War, when the<br />
U.S. VII Corps, under the command <strong>of</strong> Lieutenant General Fred Franks, defeated Iraqi units in February<br />
1991. <strong>The</strong> VII Corps arsenal included equipment such as the U.S.-made Apache helicopter and M1 Abrams<br />
main battle tank, while the Iraqi forces employed Soviet-made Tupolev main battle tanks and other combat<br />
vehicles. In 90 hours <strong>of</strong> movement and combat, VII Corps reportedly destroyed more than a dozen Iraqi divisions,<br />
approximately 1,300 tanks, 1,200 fighting vehicles and armored personnel carriers, 285 artillery<br />
pieces, 100 air defense systems, and captured around 22,000 enemy soldiers. At the same time, VII Corps<br />
had extremely light casualties and equipment losses. Reports from the Gulf War stated that the superior<br />
range <strong>of</strong> the M1 Abrams gun and fire control system, and the superior ability <strong>of</strong> the M1 <strong>to</strong> see through the<br />
smoke and heat generated by burning oil fields, contributed <strong>to</strong> the armored rout. Based on these and other<br />
his<strong>to</strong>rical precedents, we believe inves<strong>to</strong>rs should not overreact <strong>to</strong> face-<strong>of</strong>fs between U.S.-equipped and<br />
trained forces when confronted with older generation Soviet era conventional weapons, although the level<br />
<strong>of</strong> training is, <strong>of</strong> course, a key <strong>to</strong> success. <strong>The</strong> latest generations <strong>of</strong> Russian military hardware are more formidable,<br />
such as the MiG-29 Fulcrum combat aircraft and the Tupolev-90 main battle tank, but that hardware<br />
has not been exported <strong>to</strong> Iraq or Iran, <strong>to</strong> the best <strong>of</strong> our knowledge.<br />
In summary, we do not believe Iraq or Iran poses a major, conventional warfare threat <strong>to</strong> Saudi Arabia,<br />
especially with improved aerial and signal intelligence that can detect troop movements before they become<br />
an invading force. Not <strong>to</strong> be overlooked, on the subject <strong>of</strong> external risk we note that Iran and Syria are<br />
Shiite strongholds, and their governments are indicted terrorist sponsors whose goals are not easily discernable.<br />
Internecine feuds between Shiite and Sunni (the Sunni are the majority in Saudi Arabia) Muslims have<br />
produced bloodshed occasionally, and may do so again, including within Saudia Arabia, in the Shiite-heavy<br />
eastern oil-producing region. On the subject <strong>of</strong> conventional threats <strong>to</strong> the flow <strong>of</strong> oil, we do view the surface<br />
navy <strong>of</strong> Iran and shore-launched anti-ship missiles as a viable threat <strong>to</strong> the Straits <strong>of</strong> Hormuz, through<br />
which 16 million barrels <strong>of</strong> oil pass every day. Given that the other Gulf states have not developed a major<br />
naval counter force <strong>to</strong> Iran, however, we must deduce that the states are confident in the ability <strong>of</strong> the Saudi<br />
and U.S. military <strong>to</strong> neutralize small and moderate threats <strong>to</strong> shipping at the mouth <strong>of</strong> the Persian Gulf.
Industrial Portfolio Strategy<br />
<strong>The</strong> <strong>Inflation</strong> <strong>Cycle</strong> <strong>of</strong> <strong>2002</strong> <strong>to</strong> <strong>2015</strong> ⎯ April 19, <strong>2002</strong> -78- Legg Mason Wood Walker, Inc.<br />
<strong>The</strong> Risk <strong>of</strong> Terrorists Obtaining Nuclear Weapons Developed in the Soviet Union<br />
Nuclear complexity inhibits proliferation. <strong>The</strong> difficulty <strong>of</strong> producing weapons grade U-235 or Pu-239<br />
probably places fission and certainly fusion devices beyond the grasp <strong>of</strong> terrorists, at least for the time being.<br />
On the other hand, reac<strong>to</strong>r grade plu<strong>to</strong>nium, other processed waste, as well as the political instability <strong>of</strong><br />
new nuclear powers such as Pakistan, are continuing risks. As for the nuclear arsenal <strong>of</strong> the former Soviet<br />
Union, we believe that the highly centralized command and control system <strong>of</strong> the Soviet military led <strong>to</strong> the<br />
widespread use <strong>of</strong> Permissive Access Links (PALs) such as those used in the U.S. (<strong>The</strong>re is some speculation<br />
the U.S. willingly gave the technology <strong>to</strong> the U.S.S.R.) PALs use heavily encrypted code systems <strong>to</strong><br />
activate a weapon, and are as complex as the weapons are dangerous. We also believe that there have been<br />
numerous public and private U.S. efforts <strong>to</strong> assist Russia in securing its nuclear weapons over the decades.<br />
We highlight the infamous “missing” Soviet “suitcase nukes,” if they ever existed at all, as a case in<br />
point for how inves<strong>to</strong>rs may receive misinformation in the media. <strong>The</strong> nuclear weapons cited were mentioned<br />
by Alexander Lebed (b. 1950), a former deputy commander <strong>of</strong> the Soviet Airborne (paratrooper)<br />
forces and former National Security Advisor (1996) <strong>to</strong> Russian President Boris Yeltsin. In a private meeting<br />
with U.S. congressmen in May 1997, Mr. Lebed cited up <strong>to</strong> 84 missing nuclear weapons <strong>of</strong> a suitcase size.<br />
In August <strong>of</strong> the same year, in a 60 Minutes news program interview, Mr. Lebed upped the number <strong>to</strong> 100<br />
missing nuclear weapons <strong>of</strong> that type. Although similar weapons did exist in the U.S. arsenal (the W54 Special<br />
A<strong>to</strong>mic Demolition Munition, called SADM, and later variants), we have several reasons <strong>to</strong> doubt the<br />
veracity <strong>of</strong> Mr. Lebed’s claim.<br />
<br />
<br />
<br />
<br />
Mr. Lebed’s claim was based on a preliminary study commissioned by Mr. Lebed when he was President<br />
Yeltsin’s National Security chief in 1996, but he did not stay in <strong>of</strong>fice long enough <strong>to</strong> obtain the<br />
results – he was fired by President Yeltsin for other reasons, some <strong>of</strong> which have been attributed <strong>to</strong> Mr.<br />
Lebed’s political aspirations while President Yeltsin was in ill health.<br />
Mr. Lebed is a self-made combat (rather than political) general from a proletarian background, who<br />
made the transition <strong>to</strong> politician in the melee <strong>of</strong> post-Communist Russia. As a result, he is given <strong>to</strong> bold<br />
political statements that seize the public imagination, in our view.<br />
<strong>The</strong>se weapons were ostensibly produced outside <strong>of</strong> the Soviet military establishment for use by operatives,<br />
but since such small devices would have <strong>to</strong> be Pu-239-based, we doubt the Soviet military would<br />
have lost track <strong>of</strong> that quantity <strong>of</strong> extremely difficult-<strong>to</strong>-produce Pu-239, which requires a complex reac<strong>to</strong>r-based<br />
refinement effort.<br />
<strong>The</strong> alleged weapons have been <strong>to</strong>uted as having large-citywide destructive capability. But the effective<br />
lethal radius (50% casualty rate) <strong>of</strong> a one kilo<strong>to</strong>n “suitcase nuke” fission device de<strong>to</strong>nated at ground<br />
level in an urban setting would be 800 yards, which is nowhere close <strong>to</strong> the six mile lethal radius <strong>of</strong> a<br />
one mega<strong>to</strong>n thermonuclear device <strong>of</strong> the sort found in the arsenals <strong>of</strong> advanced nuclear states.<br />
As we have stated, we believe it is difficult for inves<strong>to</strong>rs <strong>to</strong> separate fact from fiction in the complex and<br />
arcane world <strong>of</strong> political and military analysis. In this section <strong>of</strong> the report, our goal has been <strong>to</strong> shed more<br />
light on the subject so that inves<strong>to</strong>rs may be better informed.
Industrial Portfolio Strategy<br />
<strong>The</strong> <strong>Inflation</strong> <strong>Cycle</strong> <strong>of</strong> <strong>2002</strong> <strong>to</strong> <strong>2015</strong> ⎯ April 19, <strong>2002</strong> -79- Legg Mason Wood Walker, Inc.<br />
Non-Economic Contrasts Between East and West That Affect <strong>The</strong> Investment<br />
Outlook<br />
Until this point, we have only discussed economic contrasts between the West and the Middle East,<br />
but there are political and social facets <strong>to</strong> the relationship. Some <strong>of</strong> the radical elements <strong>of</strong> the East and<br />
West believe that there is an inevitable conflict between Islam and Christianity. A few even cite the four<br />
Crusades, which occurred between 1099 A.D. and 1198 A.D., as evidence <strong>of</strong> Christian hostility <strong>to</strong>ward Islam.<br />
In reality, the Crusades, as brutish as they were, were <strong>of</strong>ten bitter defeats for the Christian forces, and<br />
perhaps the Crusades’ only real contribution <strong>to</strong> his<strong>to</strong>ry was the opening <strong>of</strong> mutually beneficial trade routes,<br />
in our opinion. Fast forward a millennium, and we believe that the modern conflict on both sides is a complex<br />
mix <strong>of</strong> greed, envy, jealousy, righteousness and, at its core, the rivalry between secular and religious<br />
interests that has existed since Christ instructed Peter <strong>to</strong> “Render un<strong>to</strong> Caesar that which is Caesar's, and<br />
un<strong>to</strong> God that which is God’s.” In this section we explore the West versus East non-economic fac<strong>to</strong>rs that<br />
we believe will affect investment and commodity prices in the coming years.<br />
Political and Cultural Differences Between East and West<br />
In general, we believe that the Western model is a secular, capitalist republic with a monotheistic religious<br />
conscience. In our opinion, religion <strong>of</strong>ten functions as an effective <strong>of</strong>fset <strong>to</strong> the self-interest <strong>of</strong> individualistic,<br />
nationalistic societies by alternately acting as a brake and a rudder in the “pursuit <strong>of</strong> happiness,”<br />
one component <strong>of</strong> which is improving secular living standards. In the Western capitalist system, markets<br />
consist <strong>of</strong> consumers and producers for whom the psychology alternates over cycles between fear and<br />
greed. We observe that during periods <strong>of</strong> extreme greed, religion functions as a self-correcting mechanism<br />
by emphasizing charity, and in periods <strong>of</strong> extreme fear, religion provides a moral compass that helps markets<br />
(people) emerge from the economic paralysis associated with a loss <strong>of</strong> hope. <strong>The</strong> exact question <strong>of</strong> the<br />
mix between greed, fear and religion is much like observing a pendulum, in our view, because just how far<br />
an arc may travel before it begins a return is key. But an overwhelming confidence in the ability <strong>of</strong> the selfcorrecting,<br />
pendulum mechanisms <strong>to</strong> work, as they <strong>of</strong>ten do, is a trait <strong>of</strong> Western secular systems.<br />
We believe that the prevailing secular view <strong>of</strong> religious governance is that the latter structure leads <strong>to</strong><br />
a decay <strong>of</strong> material living standards and a loss <strong>of</strong> national ambition. This occurs because the systems <strong>of</strong><br />
religious governance <strong>of</strong>ten subordinate the needs <strong>of</strong> the individual <strong>to</strong> the needs <strong>of</strong> the many, removing the<br />
motivation <strong>of</strong> self-interest, and leaving only the self-correcting mechanisms that normally restrain such motivations.<br />
As a result, some secular adherents view this devolution <strong>of</strong> living standards in a theological dicta<strong>to</strong>rship<br />
as a by-product <strong>of</strong> faith by force, which is little changed from the missteps that contributed <strong>to</strong> the<br />
folly <strong>of</strong> the Crusades and the stagnation <strong>of</strong> the Middle Ages. <strong>The</strong> prevailing secular view from afar may be<br />
that the leaders in a theological dicta<strong>to</strong>rship, with the foibles <strong>of</strong> mortals and the vanity <strong>of</strong> scholars, seek <strong>to</strong><br />
insert themselves as the men between Man and God as arbiters <strong>of</strong> the faith beyond that which is clearly circumscribed<br />
by holy texts (even in the least obtuse Bucaille-based or other quasi-scientific interpretations).<br />
<strong>The</strong> prevailing, Western secular view in this regard is not without experience, as Europe had its own period<br />
<strong>of</strong> theological dicta<strong>to</strong>rship, the bulk <strong>of</strong> which occurred during the Middle Ages, roughly the period between<br />
Saint Augustine’s <strong>The</strong> City <strong>of</strong> God (ca. 426 AD) and Dante Alighieri’s <strong>The</strong> Divine Comedy (ca. 1300 AD).<br />
<strong>The</strong> temporary triumph <strong>of</strong> centralized faith over diffused knowledge that marked the Middle Ages segued <strong>to</strong><br />
the accomplishments <strong>of</strong> the Renaissance, as well as the modern era, if human achievement is the standard <strong>of</strong>
Industrial Portfolio Strategy<br />
<strong>The</strong> <strong>Inflation</strong> <strong>Cycle</strong> <strong>of</strong> <strong>2002</strong> <strong>to</strong> <strong>2015</strong> ⎯ April 19, <strong>2002</strong> -80- Legg Mason Wood Walker, Inc.<br />
measurement. That experience later became a corners<strong>to</strong>ne <strong>of</strong> the separation <strong>of</strong> church and state in the newly<br />
created United States <strong>of</strong> America almost five centuries later.<br />
In contrast, some adherents <strong>to</strong> religious governance, particularly in the East, believe that religion<br />
serves as a framework for a society rather than the foundation for a philosophy. For example, the Koran<br />
was compiled late enough (ca. the 7th century A.D.) in the development <strong>of</strong> modern civilization <strong>to</strong> serve<br />
as a practical guide for living rather than principally as a guide for moral behavior, and forms the basis <strong>of</strong><br />
the political constitution <strong>of</strong> Saudi Arabia, for example. In practice, advocates <strong>of</strong> religious governance find<br />
the religious way <strong>of</strong> life <strong>to</strong> be a fulfilling, powerful, unifying force, capable <strong>of</strong> focusing the disciplined will<br />
<strong>of</strong> the many on a single goal, rather than the individual, factional, or nationalist diversity <strong>of</strong> interests more<br />
typically associated with secular systems. To some <strong>of</strong> those practitioners, this sense <strong>of</strong> community, order<br />
and personal virtue is worth the admission price <strong>of</strong> lost personal freedom and secular wealth, although his<strong>to</strong>ry<br />
has shown that once the theological dicta<strong>to</strong>rship path is chosen, there is little democratic recourse for<br />
peaceful change if the popular sentiment shifts (which is, in our view, increasingly the case in Iran <strong>to</strong>day,<br />
for example).<br />
Areas <strong>of</strong> Instability in the Political and Cultural Relations Between East and West<br />
Some believers in religious governance feel that powerful secular interests are destabilizing their universal<br />
belief system and undermining the internal order in their societies. Since a society that deemphasizes<br />
the primacy <strong>of</strong> the individual and embraces a universal belief system may also be especially<br />
susceptible <strong>to</strong> crowd psychology, the concept <strong>of</strong> “Holy War” may be an extension <strong>of</strong> this crowd behavior.<br />
Although an emphasis on peace, which is another central tenet <strong>of</strong> some religious systems, may serve as a<br />
counterweight <strong>to</strong> the unruly caprice <strong>of</strong> crowd psychology, it is <strong>of</strong>ten not enough, and where conflict results<br />
there is <strong>of</strong>ten reprisal, leading <strong>to</strong> a downward spiral. In addition, there is also a view among some in the<br />
East that the pervasive influence <strong>of</strong> modern technology, such as the Internet and television, creates a corrupting<br />
influence on their societies. Since the propagation <strong>of</strong> electronic information is guided by physics,<br />
not politics, and his<strong>to</strong>ry has shown that it is virtually impossible <strong>to</strong> put the technology information “genie”<br />
back in<strong>to</strong> the bottle, we doubt that situation will reverse itself. In fact, we observe that the West also struggles<br />
with its own “technology genie” in the form <strong>of</strong> nuclear proliferation.<br />
Overarching the conflict and feeding the extremist flames at the periphery is the lack <strong>of</strong> a satisfac<strong>to</strong>ry<br />
resolution <strong>of</strong> the Israeli/Palestinian issue, which we believe is polarizing the conflict among the masses<br />
on both sides and thus expanding the number <strong>of</strong> extremist combatants. In our view, the lack <strong>of</strong> a resolution<br />
<strong>of</strong> this issue strengthens the hand <strong>of</strong> the radical elements <strong>of</strong> East and West. Since the periphery consists <strong>of</strong><br />
economic disenfranchisement and the evils <strong>of</strong> terrorism in the East, and political proselytizing without the<br />
goal <strong>of</strong> bilateral improvement by the West, such actions fan the flames <strong>of</strong> radicalism and resentment, and,<br />
we believe, raise the risk <strong>of</strong> war.<br />
Although we see no parallels in the past century <strong>to</strong> the current situation, veterans <strong>of</strong> the Cold War<br />
shape policy on the world governmental stage. In fact, veterans <strong>of</strong> the Cold War have lingered or<br />
emerged as political leaders in the East and the West. In a few cases, extremists among them already perceive<br />
the conflict as a “civilization war” <strong>of</strong> absolute dominion, similar <strong>to</strong> the Communist versus Capitalist<br />
struggle. We believe that the error <strong>of</strong> this assumption begins with a comparison <strong>of</strong> Middle Eastern versus<br />
Western characteristics in the context <strong>of</strong> the Cold War. In the latter struggle, the viability <strong>of</strong> “pure” commu-
Industrial Portfolio Strategy<br />
<strong>The</strong> <strong>Inflation</strong> <strong>Cycle</strong> <strong>of</strong> <strong>2002</strong> <strong>to</strong> <strong>2015</strong> ⎯ April 19, <strong>2002</strong> -81- Legg Mason Wood Walker, Inc.<br />
nism was threatened by the presence <strong>of</strong> capitalism in its midst, making a final resolution inevitable since the<br />
u<strong>to</strong>pian end game <strong>of</strong> pure communism required the abolition <strong>of</strong> private ownership <strong>of</strong> the “means <strong>of</strong> production”<br />
before the state could “wither away.” As a practical matter, we believe that the Soviet communist dicta<strong>to</strong>rship<br />
had no intention <strong>of</strong> withering away, but that did not reduce the necessity that government felt <strong>to</strong><br />
expand globally and eliminate the temptation <strong>of</strong> the “Western way” wherever it was encountered. As a result,<br />
arguments in the 1970s and 1980s among some in the West that there could be no moral absolution for<br />
Communism via détente were genuine, and the resulting vic<strong>to</strong>ry <strong>of</strong> capitalism over communism, as the latter<br />
was originally envisioned, was a hallmark <strong>of</strong> the late 20th century. Given that his<strong>to</strong>ry, we fail <strong>to</strong> see the<br />
similarities between the current conflict and the Cold War. We do not expect the West and East <strong>to</strong> converge<br />
on a common set <strong>of</strong> values for quite some time, if ever, but the key conclusion we draw is that<br />
differences between the East and West do not appear <strong>to</strong> require one system <strong>to</strong> replace the other, either,<br />
except, perhaps, in the minds <strong>of</strong> the extremist periphery.<br />
<strong>The</strong> Fork In <strong>The</strong> Road – Inves<strong>to</strong>rs Are Along For the Ride<br />
This is a new century, and instead <strong>of</strong> an antiquated Cold War model, our focus for investment research<br />
on this subject has been on the new realities <strong>of</strong> Iraq, Israel, Saudi Arabia and the Persian<br />
Gulf. We have described the Saudi power structure as a triumvirate, with political, religious and economic<br />
interests. We have drawn a separate line around Saddam Hussein’s Iraqi government, which appears <strong>to</strong> be<br />
guided by secular, terri<strong>to</strong>rial, and updated “Pan-Arab” goals rather than theological ideals. In this report, we<br />
have discussed the <strong>of</strong>ten self-inflicted Middle Eastern lack <strong>of</strong> prosperity in an economic sense, and the need<br />
for improved governance and reduced corruption in a political sense, while fending <strong>of</strong>f the radical elements<br />
seeking greater political power. Ensuring the vic<strong>to</strong>ry <strong>of</strong> the more moderate voices on both sides would appear<br />
<strong>to</strong> be in the best interest <strong>of</strong> inves<strong>to</strong>rs in both the West and the East, in our view, but <strong>to</strong> do so requires<br />
that the radical elements in both regions be removed from a position <strong>of</strong> power by undermining their appeal<br />
via increased global trade and enlargement <strong>of</strong> the global “economic pie.” Since the U.S. dependence on<br />
Persian Gulf oil is back <strong>to</strong> the highest levels <strong>of</strong> the mid-1970s, and <strong>to</strong>tal U.S. oil import dependence is<br />
at the highest level in his<strong>to</strong>ry, while Persian Gulf regimes are at a political and economic crossroads,<br />
the stakes are raised accordingly. As inves<strong>to</strong>rs we believe that it is necessary <strong>to</strong> be keen, disciplined and<br />
impartial observers. Our investment observation is that we believe that the risk <strong>of</strong> Middle East war is gradually<br />
rising, and major wars in U.S. his<strong>to</strong>ry, without exception, have been inflationary.
Industrial Portfolio Strategy<br />
<strong>The</strong> <strong>Inflation</strong> <strong>Cycle</strong> <strong>of</strong> <strong>2002</strong> <strong>to</strong> <strong>2015</strong> ⎯ April 19, <strong>2002</strong> -82- Legg Mason Wood Walker, Inc.<br />
Appendix A – U.S. <strong>Inflation</strong> <strong>Cycle</strong>s From a Monetary His<strong>to</strong>ry Perspective, 1898 <strong>to</strong> 2001<br />
No two cycles are ever alike, but as Mark Twain said, they do rhyme. In the following paragraphs, we summarize<br />
the conditions that surrounded the inflation cycles <strong>of</strong> the past century, and describe current similarities.<br />
<strong>The</strong> <strong>Inflation</strong> <strong>Cycle</strong> <strong>of</strong> 1898 <strong>to</strong> 1920 <strong>The</strong> years 1898 <strong>to</strong> 1914, before World War I, featured 2.2% annual commodity<br />
inflation, 1.2% annual consumer inflation, and a 3.0% annual price return for the U.S. s<strong>to</strong>ck market. <strong>The</strong> wartime period<br />
as we define it, from 1914 <strong>to</strong> 1920, featured inflation <strong>of</strong> 14.6% per year for commodities, 12.2% consumer inflation and<br />
a 0.1% U.S. annualized s<strong>to</strong>ck market return. <strong>The</strong> 1898 <strong>to</strong> 1914 period <strong>of</strong> even mild inflation without a major war was<br />
unprecedented in U.S. his<strong>to</strong>ry, and the reason most widely accepted was that large gold discoveries and improved mining<br />
technology debased the world’s currency reserve by causing world gold inven<strong>to</strong>ries <strong>to</strong> grow at twice the his<strong>to</strong>rical<br />
rate. For example, U.S. monetary gold holdings increased 220% from 1897 <strong>to</strong> 1914. This peacetime increase in gold<br />
supply as the world reserve currency may be similar <strong>to</strong> the strong peacetime (pre-war?) rate <strong>of</strong> increase in U.S.<br />
money supply since the mid-1990s, since the U.S. dollar is the de fac<strong>to</strong> world reserve currency. When World War I<br />
arrived, the combatants began <strong>to</strong> buy supplies from the U.S., which increased the gold s<strong>to</strong>ck <strong>of</strong> the U.S. <strong>The</strong> normal<br />
wartime diversion <strong>of</strong> production fueled inflation, but the fac<strong>to</strong>r that launched a more robust inflation cycle was the decision<br />
by most <strong>of</strong> the warring parties in Europe <strong>to</strong> suspend the gold standard. Just before the outbreak <strong>of</strong> World War I, the<br />
U.S. Congress creating the Federal Reserve System with a mandate <strong>to</strong> “furnish an elastic currency.” But the new Fed<br />
had as its first task fighting a world war, and did not pursue a restrictive monetary policy in its formative years. Also,<br />
direct U.S. involvement in the war caused large budget deficits in 1918 and 1919. If a future Persian Gulf war were <strong>to</strong><br />
occur, we believe that oil prices, which are dollar-denominated, would increase. U.S. dollars would then have <strong>to</strong> be<br />
furnished by the Fed <strong>to</strong> the strained global financial system, despite the inflationary implications, as the lesser <strong>of</strong><br />
two evils, in our view. In addition, the U.S. would likely experience federal budget deficits. After World War I, several<br />
countries repegged currencies <strong>to</strong> gold at the pre-war level, a fateful decision that was later blamed on the gold standard<br />
when, in reality, it was a misapplication <strong>of</strong> the gold standard <strong>to</strong> attempt <strong>to</strong> turn back time and return <strong>to</strong> pre-war<br />
price levels. In addition, the new Fed authorized higher interest rates in late 1919 and early 1920 because it saw declining<br />
free reserves in the U.S. banking system. Since 1920 also featured a bursting commodity speculation bubble<br />
(Exhibit 10, labeled point “A”) as the last hurrah <strong>of</strong> the inflation cycle, the stage was set for a major recession that year,<br />
and a price deflation concurrent with money supply growth that underpinned a new bull market for s<strong>to</strong>cks from 1921 <strong>to</strong><br />
1929. We observe that the commodity speculation bubble <strong>of</strong> 1920 was an asset price phenomenon that would be repeated<br />
several times in subsequent decades, with commodity price bubbles succeeding wars and preceding deflation<br />
and equity bull markets, and equity price bubbles succeeding peace and preceding inflation and secular bear markets<br />
for the equities that were not inflation beneficiaries.<br />
Deflation from 1921 <strong>to</strong> 1932 then led <strong>to</strong>…<br />
<strong>The</strong> <strong>Inflation</strong> <strong>Cycle</strong> <strong>of</strong> 1933 <strong>to</strong> 1951 In the midst <strong>of</strong> the Great Depression, between August 1931 and January 1932, a<br />
<strong>to</strong>tal <strong>of</strong> 1,860 U.S. banks with $1.45 billion <strong>of</strong> deposits failed in a liquidity crisis. <strong>The</strong> Fed had terminated a bank credit<br />
inflation in 1928, but tried desperately from 1929 <strong>to</strong> 1931 <strong>to</strong> ward <strong>of</strong>f the emerging crisis by inflating controlled reserves,<br />
although the Fed was simply out-gunned by the liquidity trap, and the aftermath was a financial calamity. Perhaps<br />
the Fed was distracted by the devaluation <strong>of</strong> the (overvalued) U.K. pound sterling in September 1931, which resulted<br />
in a drain <strong>of</strong> U.S. gold reserves <strong>to</strong> overseas, thereby overshadowing the domestic crisis. After some semblance <strong>of</strong><br />
U.S. banking stability was established, a misguided U.S. government published in 1933 a list <strong>of</strong> banks seeking federal<br />
agency assistance from the Reconstruction Financing Corporation, causing an already-skittish public <strong>to</strong> associate the list<br />
with weakness. Another run on deposits and banking panic ensued, worsening the Great Depression. <strong>The</strong> aggressive<br />
response <strong>of</strong> the Greenspan Fed <strong>to</strong> crises such as Long-Term Capital Management and the Asia Crisis grows directly<br />
out <strong>of</strong> a desire not <strong>to</strong> fall behind the power curve, or be caught in a liquidity trap. It should not be lost on inves<strong>to</strong>rs<br />
that the Fed appears <strong>to</strong> place the support <strong>of</strong> war efforts and/or avoidance <strong>of</strong> financial panic ahead <strong>of</strong> price stability<br />
in its mission hierarchy. We believe a number <strong>of</strong> events launched the inflation cycle <strong>of</strong> 1933 <strong>to</strong> 1951. First, President
Industrial Portfolio Strategy<br />
<strong>The</strong> <strong>Inflation</strong> <strong>Cycle</strong> <strong>of</strong> <strong>2002</strong> <strong>to</strong> <strong>2015</strong> ⎯ April 19, <strong>2002</strong> -83- Legg Mason Wood Walker, Inc.<br />
Franklin D. Roosevelt effectively “nationalized” the U.S. monetary gold supply in 1933, ordering that all (monetary)<br />
gold must be turned in<strong>to</strong> the Federal Reserve System in exchange for $35 per troy ounce <strong>of</strong> U.S. currency. <strong>The</strong>reafter,<br />
the U.S. Mint would buy, but not sell domestically, gold at $35 per ounce. Since this price was a sharp devaluation <strong>of</strong><br />
the U.S. dollar’s prior legal weight in gold, Europe had little choice but <strong>to</strong> follow the U.S. devaluation, since a huge<br />
“avalanche” <strong>of</strong> foreign gold began <strong>to</strong> make its way <strong>to</strong> the U.S., greatly increasing banking reserves. Second, the New<br />
Deal programs increased the role <strong>of</strong> the federal government. And third, the U.S. Supreme Count upheld the 1935 National<br />
Labor Relations Act, enabling workers <strong>to</strong> organize and employ strikes for better wages. As a result, 1933 <strong>to</strong> 1937<br />
featured a 53% increase in the U.S. money s<strong>to</strong>ck, <strong>of</strong>fsetting most <strong>of</strong> the one-third decline in money s<strong>to</strong>ck from 1929 <strong>to</strong><br />
1933. By 1937, U.S. real incomes had recovered <strong>to</strong> a level that was 3% above the 1929 peak, since the preliminary effect<br />
<strong>of</strong> inflationary policies is <strong>to</strong> shrug <strong>of</strong>f the stagnation <strong>of</strong> the prior deflation. But the pursuit <strong>of</strong> unilateral self-interest<br />
by the U.S. and other nations made the world a more dangerous place by the late 1930s, replete with trade and foreign<br />
exchange restrictions, competitive devaluation and rising political extremism in Europe. In the modern period, perhaps<br />
the competitive devaluation <strong>of</strong> the European euro and Japanese yen mark a return <strong>to</strong> economic unilateralism. In<br />
the case <strong>of</strong> Europe, politicians seem unwilling <strong>to</strong> make the structural adjustments <strong>to</strong> avoid reliance on devaluation,<br />
and in the case <strong>of</strong> Japan, a weaker yen appears <strong>to</strong> be an act <strong>of</strong> economic desperation. <strong>The</strong> beginning <strong>of</strong> World War II<br />
in Europe in 1939 produced events similar <strong>to</strong> World War I, with an initial inflow <strong>to</strong> the U.S. <strong>of</strong> gold <strong>to</strong> purchase<br />
goods, and such purchases were later funded by U.S. credit <strong>to</strong> our allies. Monetary policy served the war effort, and U.<br />
S. budget deficits averaged about 30% <strong>of</strong> GNP from 1942 <strong>to</strong> 1945 after the U.S. entered the war. For the entire war period<br />
September 1939 <strong>to</strong> August 1948, the U.S. money s<strong>to</strong>ck rose 12.1% per year, and wholesale prices rose 8.7% per<br />
year. <strong>Inflation</strong> was restrained by price controls from early 1942 <strong>to</strong> mid-1946. Those controls were instituted <strong>to</strong> contain<br />
the sort <strong>of</strong> inflation that had occurred in World War I. But as traditional economic theory would suggest, the side effects<br />
<strong>of</strong> price controls included substitution price differentials, barter, and a thriving black market. After 1948, there was a<br />
revival <strong>of</strong> prudent monetary policy, but the outbreak <strong>of</strong> hostilities in Korea in 1950 triggered a renewed round <strong>of</strong> commodity<br />
inflation and hoarding (Exhibit 10, point labeled “B”). As his<strong>to</strong>rical parallels would suggest, this late stage<br />
speculative blow-<strong>of</strong>f heralded the end <strong>of</strong> the preceding inflation mentality (similar <strong>to</strong> 1920) and the start <strong>of</strong> a deflationary<br />
economic and s<strong>to</strong>ck market boom in the 1950s and early 1960s.<br />
Deflation from 1952 <strong>to</strong> 1964 then led <strong>to</strong>…<br />
<strong>The</strong> Commodity <strong>Inflation</strong> <strong>Cycle</strong> <strong>of</strong> 1965 <strong>to</strong> 1981 In 1944, the Allied Powers economic ministers signed the Bret<strong>to</strong>n<br />
Woods Agreement, so named for the ski resort in New Hampshire at which talks were held. In accordance with the<br />
agreement, from 1947 until the system was abandoned in 1971, the U.S. agreed <strong>to</strong> exchange U.S. dollars for gold at $35<br />
per ounce (for foreign treasury signa<strong>to</strong>ries), and member governments agreed <strong>to</strong> peg their currencies <strong>to</strong> the gold-backed<br />
U.S. dollar. Combined with the U.S. manufacturing and service base that emerged from World War II unscathed, the<br />
primacy <strong>of</strong> U.S. economic and political power was sealed. <strong>The</strong> U.S. enjoyed a golden age <strong>of</strong> power in the 1950s that we<br />
do not believe was seen again until the fall <strong>of</strong> Communism ushered in a similar period <strong>of</strong> hegemony in the 1990s. But,<br />
as his<strong>to</strong>ry has shown, reliance on a “leading” central bank <strong>to</strong> put currency bloc altruistic interests ahead <strong>of</strong> nationalist<br />
interests was a fatal flaw. <strong>The</strong> “Guns and Butter” policy <strong>of</strong> pursuing an aggressive social agenda in the 1960s as part <strong>of</strong><br />
President Johnson’s “Great Society,” while simultaneously fighting a prolonged war in Vietnam, led <strong>to</strong> deficits and a<br />
debasing <strong>of</strong> the U.S. dollar. In a hauntingly similar parallel <strong>to</strong> <strong>to</strong>day, we note that the cost <strong>of</strong> the War on Terrorism is<br />
just beginning <strong>to</strong> rise. Also similar <strong>to</strong> the 1960s, the Great Society cost may pale in comparison <strong>to</strong> the medical and<br />
Social Security costs associated with the aging <strong>of</strong> the Baby Boom generation. By year-end 1965, U.S. capacity utilization<br />
was about 90%, and unemployment was only 4.0% versus the 5.5% average from 1960 <strong>to</strong> 1965. This fullemployment<br />
economy collided with fiscal and monetary stimulus <strong>to</strong> undermine the price stability discipline <strong>of</strong> Bret<strong>to</strong>n<br />
Woods. No longer wishing <strong>to</strong> import U.S. inflation, the U.K. and France teamed up <strong>to</strong> challenge the U.S. by demanding<br />
that their dollars be converted in<strong>to</strong> gold in the summer <strong>of</strong> 1971. In response, President Nixon closed the U.S. gold window<br />
on August 15, 1971, ending the Bret<strong>to</strong>n Woods Agreement, and laying the foundations for the 1970s’ inflation. All<br />
that was missing was a catalyst, and we cite two. First, the wave <strong>of</strong> U.S. Baby Boomers born in 1946 began <strong>to</strong> graduate<br />
from high school in 1964 and college in 1968 or 1970, depending on military service. As each year passed, more<br />
“Boomers” required meaningful employment, which created the political imperative <strong>of</strong> a Phillips Curve full-
Industrial Portfolio Strategy<br />
<strong>The</strong> <strong>Inflation</strong> <strong>Cycle</strong> <strong>of</strong> <strong>2002</strong> <strong>to</strong> <strong>2015</strong> ⎯ April 19, <strong>2002</strong> -84- Legg Mason Wood Walker, Inc.<br />
employment inflation. Second, the oil embargoes made it impossible <strong>to</strong> <strong>of</strong>fset the inflation <strong>of</strong> dollar-denominated oil,<br />
because any reduction in the value <strong>of</strong> the U.S. dollar simply raised the dollar cost <strong>of</strong> oil. Thus, the great inflation <strong>of</strong> the<br />
1970s began, and from 1965 <strong>to</strong> 1980, the average year-over-year growth rate for U.S. M2 was 8.7%, for the U.S. PPI<br />
all commodities index it was 6.9%, and for the CPI inflation rate it was 6.3%. Arguably, had there not been a Mutually<br />
Assured Destruction (MAD) balance between the U.S. and the Soviet Union, this combination <strong>of</strong> events plus such flareups<br />
as the 1973 Arab-Israeli War (with Syria and Egypt backed by the U.S.S.R) may have led <strong>to</strong> a Third World War.<br />
Instead, the economies <strong>of</strong> the West were forced <strong>to</strong> pay the price for pursuing inflationary policies after the mid-1960s,<br />
and for the folly <strong>of</strong> assuming that imported energy would always be abundant and inexpensive. For this reason, and<br />
given the MAD balance that probably forestalled a broad war, we refer <strong>to</strong> the decade <strong>of</strong> the 1970s as a period <strong>of</strong> global<br />
economic warfare. Relating those events <strong>to</strong> <strong>to</strong>day, we observe that the post-Cold War U.S. economic and military hegemony<br />
in the world has produced losers on the receiving end <strong>of</strong> commodity deflation. It further stands <strong>to</strong> reason<br />
that the response <strong>of</strong> some elements in countries overly reliant on oil prices has been <strong>to</strong> engage in asymmetric warfare<br />
(indirect, terrorist, stateless or informally state-sponsored, opportunistic, and focused) against U.S. interests.<br />
<strong>The</strong> late 1970s featured a typical speculative blow-<strong>of</strong>f for commodity prices (Exhibit 10, point labeled “C”) and inflation,<br />
which, as we have seen, heralded the end <strong>of</strong> the inflation regime and the beginning <strong>of</strong> deflation. By 1980, the<br />
Boomers born in 1957, the latter being the peak year <strong>of</strong> births as a percentage <strong>of</strong> the U.S. population (4.31 million live<br />
births in 1957, 2.51% <strong>of</strong> the population) turned approximately age 23 and entered the workforce if they had chosen <strong>to</strong><br />
go <strong>to</strong> college. Those who had not gone <strong>to</strong> college entered the workforce in the late 1970s, no doubt contributing <strong>to</strong> the<br />
heightened inflation <strong>of</strong> that brief period, in our view. At the same time this demographic (and political) weight was being<br />
lifted in 1980, the unreliability <strong>of</strong>—and economic price umbrella afforded by—OPEC oil was encouraging fuel conservation<br />
and non-OPEC oil exploration and production. New Fed Chairman Paul Volcker, perhaps sensing these<br />
changes, instituted a monetary course that replaced the waning political imperatives <strong>of</strong> the 1970s, and set out <strong>to</strong> break<br />
the back <strong>of</strong> inflation. For the third time in a century, around 1980 a commodity bubble was pierced. Following the major<br />
recession <strong>of</strong> 1981 <strong>to</strong> 1982 a 10-year, disinflationary equity bull market began, and this was later supplemented by<br />
the dual U.S. war vic<strong>to</strong>ries <strong>of</strong> the Cold War and the Gulf War around 1990 <strong>to</strong> 1991, furthering the disinflationary peace<br />
dividend, and stringing <strong>to</strong>gether a 20-year, unprecedented, U.S. equity bull market and a largely unbroken deflation<br />
trend that we believe is now ending.<br />
Deflation from 1982 <strong>to</strong> 2001 then led <strong>to</strong>…
Industrial Portfolio Strategy<br />
<strong>The</strong> <strong>Inflation</strong> <strong>Cycle</strong> <strong>of</strong> <strong>2002</strong> <strong>to</strong> <strong>2015</strong> ⎯ April 19, <strong>2002</strong> -85- Legg Mason Wood Walker, Inc.<br />
Appendix B – Caterpillar, Inc. Data Used <strong>to</strong> Build EVA Model, 1970 <strong>to</strong> 2006E<br />
A B C D = E = F G H I = J = K L<br />
B x C A + B - D F - G - H E / I<br />
Consolidated NOPAT Non- Invested NOPAT<br />
Consolidated Tax Rate % Tax Shield on (Net Inc. + Consolidated Interest Capital ROIC CAT Caterpillar<br />
Net Pr<strong>of</strong>it Net Interest (Some are Net Interest + Int. Expense Total Short-term Bearing (Assets - Cash on Aver. Average Shares<br />
After Expense multi-year Expense - Int. Tax Shield Assets Investments Current Liab. & Eq. - NIBCL) Capital Annual Outstg.<br />
Year Tax $000 $000 averages) $000 $000 $000 & Cash $000 $000 $000 $000 <strong>Price</strong> 000s<br />
1970 $143,785 $37,705 47.2% $17,808 $163,682 $1,798,397 $37,471 $302,907 $1,458,019 11.2% $6.19 341,364<br />
1971 $128,290 $32,334 45.6% $14,748 $145,876 $1,808,759 $49,316 $273,876 $1,485,567 9.9% $8.06 341,676<br />
1972 $206,445 $24,751 43.8% $10,842 $220,354 $1,912,278 $81,248 $394,262 $1,436,768 15.1% $9.89 341,864<br />
1973 $246,845 $29,802 38.2% $11,382 $265,265 $2,232,800 $47,100 $413,300 $1,772,400 16.5% $10.73 342,658<br />
1974 $229,200 $62,400 36.8% $22,989 $268,611 $2,934,000 $80,300 $589,300 $2,264,400 13.3% $9.10 343,242<br />
1975 $398,700 $83,800 38.4% $32,200 $450,300 $3,386,600 $121,300 $712,500 $2,552,800 18.7% $11.02 343,410<br />
1976 $383,200 $78,400 41.0% $32,151 $429,449 $3,893,900 $88,100 $761,300 $3,044,500 15.3% $14.43 344,294<br />
1977 $445,000 $99,800 43.0% $42,900 $501,900 $4,345,600 $209,400 $856,000 $3,280,200 15.9% $13.46 344,906<br />
1978 $566,000 $111,900 41.2% $46,131 $631,769 $5,031,100 $244,500 $1,090,000 $3,696,600 18.1% $13.79 345,262<br />
1979 $492,000 $139,100 33.8% $47,037 $584,063 $5,403,300 $147,200 $923,000 $4,333,100 14.5% $13.94 345,624<br />
1980 $565,000 $173,200 30.1% $52,185 $686,015 $6,098,200 $104,000 $1,265,000 $4,729,200 15.1% $13.59 345,834<br />
1981 $579,000 $224,800 28.5% $64,065 $739,735 $7,284,900 $81,000 $2,194,300 $5,009,600 15.2% $15.14 348,714<br />
1982 $(180,000) $334,000 39.0%Avg. $130,197 $23,803 $7,201,000 $81,000 $974,000 $6,146,000 0.4% $10.32 351,996<br />
1983 $(345,000) $306,000 39.0%Avg. $119,282 ($158,282) $6,968,000 $71,000 $1,223,000 $5,674,000 -2.7% $11.00 369,514<br />
1984 $(428,000) $265,000 39.0%Avg. $103,300 ($266,300) $6,223,000 $62,000 $1,462,000 $4,699,000 -5.1% $9.82 383,680<br />
1985 $198,000 $234,000 12.5% $29,250 $402,750 $6,016,000 $282,000 $1,515,000 $4,219,000 9.0% $8.82 391,168<br />
1986 $76,000 $197,000 23.2% $45,768 $227,232 $6,288,000 $124,000 $1,561,000 $4,603,000 5.2% $11.63 394,508<br />
1987 $350,000 $252,000 25.7% $64,784 $537,216 $7,631,000 $155,000 $1,849,000 $5,627,000 10.5% $13.75 398,672<br />
1988 $616,000 $340,000 31.1% $105,796 $850,204 $9,686,000 $74,000 $2,128,000 $7,484,000 13.0% $15.46 405,642<br />
1989 $497,000 $372,000 26.1% $97,043 $771,957 $10,926,000 $148,000 $2,198,000 $8,580,000 9.6% $14.97 405,668<br />
1990 $210,000 $406,000 29.9% $121,333 $494,667 $11,951,000 $110,000 $2,428,000 $9,413,000 5.5% $12.94 404,960<br />
1991 $(404,000) $469,000 27.2%Avg. $127,595 ($62,595) $12,042,000 $104,000 $2,504,000 $9,434,000 -0.7% $11.99 403,640<br />
1992 $(218,000) $497,000 27.2%Avg. $135,213 $143,787 $13,935,000 $119,000 $2,674,000 $11,142,000 1.4% $13.21 403,736<br />
1993 $652,000 $440,000 27.2%Avg. $119,705 $972,295 $14,807,000 $83,000 $3,138,000 $11,586,000 8.6% $18.60 405,200<br />
1994 $955,000 $410,000 27.8% $114,014 $1,250,986 $16,250,000 $419,000 $3,865,000 $11,966,000 10.6% $27.33 406,383<br />
1995 $1,136,000 $484,000 31.0% $150,145 $1,469,855 $16,830,000 $638,000 $3,613,000 $12,579,000 12.0% $29.70 396,858<br />
1996 $1,361,000 $510,000 31.6% $161,066 $1,709,934 $18,728,000 $487,000 $4,086,000 $14,155,000 12.8% $34.57 384,960<br />
1997 $1,665,000 $580,000 33.0% $191,330 $2,053,670 $20,756,000 $292,000 $4,753,000 $15,711,000 13.8% $48.40 381,000<br />
1998 $1,513,000 $753,000 30.6% $230,333 $2,035,667 $25,128,000 $360,000 $4,897,000 $19,871,000 11.4% $49.82 368,130<br />
1999 $946,000 $829,000 32.0% $265,443 $1,509,557 $26,711,000 $548,000 $4,380,000 $21,783,000 7.2% $52.74 359,181<br />
2000 $1,053,000 $980,000 29.3% $286,688 $1,746,312 $28,464,000 $334,000 $4,835,000 $23,295,000 7.7% $37.90 348,898<br />
2001 $805,000 $942,000 31.4% $295,735 $1,451,265 $30,657,000 $400,000 $4,965,000 $25,292,000 6.0% $48.24 347,092<br />
<strong>2002</strong>E $729,691 $799,704 32.7% $261,162 $1,268,232 $33,659,895 $688,783 $5,385,583 $27,585,529 4.8% $54.92 347,737<br />
2003E $1,106,425 $885,857 32.6% $289,141 $1,703,141 $36,763,202 $114,217 $6,249,744 $30,399,241 5.9% $54.92 347,092<br />
2004E $1,311,783 $959,584 33.3% $319,713 $1,951,653 $40,263,170 $203,588 $7,247,371 $32,812,212 6.2% $54.92 347,092<br />
2005E $1,957,980 $1,105,446 33.0% $364,422 $2,699,005 $44,087,292 $142,614 $7,935,713 $36,008,965 7.8% $54.92 347,092<br />
2006E $2,775,888 $1,155,155 32.8% $378,872 $3,552,171 $48,544,089 $109,564 $8,737,936 $39,696,589 9.4% $54.92 347,092<br />
2007E NA NA NA NA NA NA NA NA NA NA NA NA<br />
2008E NA NA NA NA NA NA NA NA NA NA NA NA<br />
2009E NA NA NA NA NA NA NA NA NA NA NA NA<br />
2010E NA NA NA NA NA NA NA NA NA NA NA NA<br />
2011E NA NA NA NA NA NA NA NA NA NA NA NA<br />
2012E NA NA NA NA NA NA NA NA NA NA NA NA<br />
2013E NA NA NA NA NA NA NA NA NA NA NA NA<br />
2014E NA NA NA NA NA NA NA NA NA NA NA NA<br />
<strong>2015</strong>E NA NA NA NA NA NA NA NA NA NA NA NA<br />
Source: Company reports, Moody’s Industrial Manuals, Legg Mason estimates and projections for <strong>2002</strong> <strong>to</strong> 2006E
Industrial Portfolio Strategy<br />
<strong>The</strong> <strong>Inflation</strong> <strong>Cycle</strong> <strong>of</strong> <strong>2002</strong> <strong>to</strong> <strong>2015</strong> ⎯ April 19, <strong>2002</strong> -86- Legg Mason Wood Walker, Inc.<br />
Appendix B – Cont’d., Caterpillar, Inc. Data Used <strong>to</strong> Build EVA Model, 1970 <strong>to</strong> 2006E<br />
M N O P Q = R = S = T = U V = W = X<br />
B / P Q x (1-C) [M/(M+P)] J - S M / U (M+P-G)/<br />
x O U<br />
Forward Consol. +[P/(M+P)]<br />
CAT 10-yr. Consolid. Interest After-Tax x R CAT Avg. CAT Avg. CAT Tot.<br />
Mkt. Val. S&P 500 S&P 500 Gross Rate on Cost <strong>of</strong> CAT Total Annual Annual Net Debt/<br />
<strong>of</strong> Eqty. Yrly. Total Total Ret. Debt Average Debt % EVA Sales & <strong>Price</strong>/ EV/ Mkt. Val.<br />
Year 000s Return = Ke $000 Debt % = Kd WACC % Revs. $000 Sales Mult. Sales Mult. Equity %<br />
1970 $2,113,374 3.9% 5.9% $517,642 7.3% 3.8% 5.5% 5.74% $2,127,751 0.99 1.22 23%<br />
1971 $2,754,761 14.3% 8.5% $504,092 6.3% 3.4% 7.7% 2.21% $2,175,169 1.27 1.48 17%<br />
1972 $3,380,060 19.0% 6.5% $358,039 5.7% 3.2% 6.2% 8.89% $2,602,178 1.30 1.41 8%<br />
1973 $3,677,623 -14.7% 6.7% $482,700 7.1% 4.4% 6.5% 10.07% $3,182,358 1.16 1.29 12%<br />
1974 $3,121,951 -26.4% 10.7% $881,200 9.2% 5.8% 9.6% 3.72% $4,082,100 0.76 0.96 26%<br />
1975 $3,785,259 37.2% 14.8% $913,400 9.3% 5.8% 13.1% 5.64% $4,963,700 0.76 0.92 21%<br />
1976 $4,969,249 23.9% 14.3% $1,094,000 7.8% 4.6% 12.6% 2.76% $5,042,300 0.99 1.19 20%<br />
1977 $4,643,656 -7.2% 13.9% $1,110,900 9.1% 5.2% 12.2% 3.70% $5,848,900 0.79 0.95 19%<br />
1978 $4,762,638 6.6% 15.3% $1,164,900 9.8% 5.8% 13.4% 4.69% $7,219,200 0.66 0.79 19%<br />
1979 $4,818,035 18.6% 16.3% $1,415,100 10.8% 7.1% 14.2% 0.31% $7,613,200 0.63 0.80 26%<br />
1980 $4,701,181 32.5% 17.5% $1,378,200 12.4% 8.7% 15.5% (0.39%) $8,603,000 0.55 0.69 27%<br />
1981 $5,280,656 -4.9% 13.9% $1,808,500 14.1% 10.1% 12.9% 2.25% $9,160,000 0.58 0.77 33%<br />
1982 $3,633,625 21.6% 17.6% $2,612,000 15.1% 9.2% 14.1% (13.66%) $6,472,000 0.56 0.95 70%<br />
1983 $4,065,616 22.6% 16.2% $2,247,000 12.6% 7.7% 13.1% (15.82%) $5,429,000 0.75 1.15 54%<br />
1984 $3,767,858 6.3% 14.9% $1,861,000 12.9% 7.9% 12.6% (17.72%) $6,597,000 0.57 0.84 48%<br />
1985 $3,450,224 31.7% 14.4% $1,404,000 14.3% 12.5% 13.8% (4.80%) $6,760,000 0.51 0.68 33%<br />
1986 $4,587,183 18.7% 14.9% $1,582,000 13.2% 10.1% 13.6% (8.49%) $7,380,000 0.62 0.82 32%<br />
1987 $5,480,702 5.2% 15.3% $2,196,000 13.3% 9.9% 13.7% (3.23%) $8,294,000 0.66 0.91 37%<br />
1988 $6,272,662 16.6% 18.0% $3,260,000 12.5% 8.6% 14.8% (1.83%) $10,435,000 0.60 0.91 51%<br />
1989 $6,072,343 31.6% 19.2% $3,994,000 10.3% 7.6% 14.6% (4.97%) $11,126,000 0.55 0.89 63%<br />
1990 $5,240,225 -3.1% 18.2% $4,721,000 9.3% 6.5% 12.7% (7.17%) $11,436,000 0.46 0.86 88%<br />
1991 $4,838,424 30.4% 17.4% $5,247,000 9.4% 6.9% 11.9% (12.60%) $10,182,000 0.48 0.98 106%<br />
1992 $5,333,731 7.6% 12.9% $5,672,000 9.1% 6.6% 9.7% (8.28%) $10,194,000 0.52 1.07 104%<br />
1993 $7,537,353 10.1% 13.1% $5,428,000 7.9% 5.8% 10.0% (1.47%) $11,615,000 0.65 1.11 71%<br />
1994 $11,104,627 1.3% 12.9% $5,903,000 7.2% 5.2% 10.3% 0.36% $14,328,000 0.78 1.16 49%<br />
1995 $11,785,856 37.5% 13.7% $6,400,000 7.9% 5.4% 10.8% 1.21% $16,072,000 0.73 1.09 49%<br />
1996 $13,309,190 22.9% 10.9% $7,459,000 7.4% 5.0% 8.8% 4.01% $16,522,000 0.81 1.23 52%<br />
1997 $18,438,765 33.4% 9.3% $8,568,000 7.2% 4.9% 7.9% 5.84% $18,949,000 0.97 1.41 45%<br />
1998 $18,338,404 28.6% 6.9% $12,452,000 7.2% 5.0% 6.1% 5.33% $21,089,000 0.87 1.44 66%<br />
1999 $18,943,030 21.0% 4.8% $13,802,000 6.3% 4.3% 4.6% 2.68% $19,836,000 0.95 1.62 70%<br />
2000 $13,221,780 -9.1% 3.3% $15,067,000 6.8% 4.8% 4.1% 3.66% $20,378,000 0.65 1.37 111%<br />
2001 $16,744,295 -11.9% 4.7% $16,602,000 5.9% 4.1% 4.4% 1.58% $20,672,000 0.81 1.59 97%<br />
<strong>2002</strong>E $19,097,716 9.2% 6.4% $17,231,595 4.7% 3.2% 4.9% (0.10%) $20,283,690 0.94 1.76 87%<br />
2003E $19,062,293 8.6% 5.9% $18,523,643 5.0% 3.3% 4.6% 1.25% $21,503,665 0.89 1.74 97%<br />
2004E $19,062,293 8.0% 5.3% $19,692,760 5.0% 3.3% 4.3% 1.86% $23,786,587 0.80 1.62 102%<br />
2005E $19,062,293 7.4% 4.8% $21,874,171 5.3% 3.6% 4.1% 3.69% $26,372,535 0.72 1.55 114%<br />
2006E $19,062,293 6.8% 4.4% $23,293,352 5.1% 3.4% 3.9% 5.52% $28,887,074 0.66 1.46 122%<br />
2007E NA 6.3% NA NA NA NA NA NA NA NA NA NA<br />
2008E NA 5.3% NA NA NA NA NA NA NA NA NA NA<br />
2009E NA 4.8% NA NA NA NA NA NA NA NA NA NA<br />
2010E NA 4.3% NA NA NA NA NA NA NA NA NA NA<br />
2011E NA 3.9% NA NA NA NA NA NA NA NA NA NA<br />
2012E NA 3.4% NA NA NA NA NA NA NA NA NA NA<br />
2013E NA 3.0% NA NA NA NA NA NA NA NA NA NA<br />
2014E NA 3.0% NA NA NA NA NA NA NA NA NA NA<br />
<strong>2015</strong>E NA 3.0% NA NA NA NA NA NA NA NA NA NA<br />
Source: Company reports, Moody’s Industrial Manuals, Legg Mason estimates and projections for <strong>2002</strong> <strong>to</strong> 2006E
Industrial Portfolio Strategy<br />
<strong>The</strong> <strong>Inflation</strong> <strong>Cycle</strong> <strong>of</strong> <strong>2002</strong> <strong>to</strong> <strong>2015</strong> ⎯ April 19, <strong>2002</strong> -87- Legg Mason Wood Walker, Inc.<br />
Legg Mason Wood Walker, Inc. makes a market in the shares <strong>of</strong> Joy Global, Inc.<br />
Additional information is available upon request<br />
<strong>The</strong> information contained herein has been prepared from sources believed <strong>to</strong> be reliable but is not guaranteed by us<br />
and is not a complete summary or statement <strong>of</strong> all available data, nor is it considered an <strong>of</strong>fer <strong>to</strong> buy or sell and securities<br />
referenced herein. Opinions expressed are subject <strong>to</strong> change without notice and do not take in<strong>to</strong> account the particular<br />
investment objectives, financial situation or needs <strong>of</strong> individual inves<strong>to</strong>rs. No investments or services mentioned<br />
are available in the European Economic Area <strong>to</strong> “private cus<strong>to</strong>mers” or <strong>to</strong> anyone in Canada other than a<br />
“Designated Institution.” From time <strong>to</strong> time, Legg Mason Wood Walker, Inc. and/or its employees involved in the<br />
preparation or issuance <strong>of</strong> the communication may have positions in the securities or options <strong>of</strong> the recommended issuer.<br />
© Copyright <strong>2002</strong> Legg Mason Wood Walker, Inc.