The Inflation Cycle of 2002 to 2015 - Uhlmann Price Securities
The Inflation Cycle of 2002 to 2015 - Uhlmann Price Securities
The Inflation Cycle of 2002 to 2015 - Uhlmann Price Securities

You also want an ePaper? Increase the reach of your titles
YUMPU automatically turns print PDFs into web optimized ePapers that Google loves.
Industrial Portfolio Strategy<br />
<strong>The</strong> <strong>Inflation</strong> <strong>Cycle</strong> <strong>of</strong> <strong>2002</strong> <strong>to</strong> <strong>2015</strong> ⎯ April 19, <strong>2002</strong> -44- Legg Mason Wood Walker, Inc.<br />
velopment compares <strong>to</strong> that <strong>of</strong> the U.S. in the last decade <strong>of</strong> the 19th century. <strong>The</strong> U.S. currently has four<br />
times more inland freight transport avenues (paved roads, railways, and navigable waterways) per square<br />
mile than China does. So, typical <strong>of</strong> a developing country, China’s freight capabilities are heavily skewed<br />
<strong>to</strong>ward inland waterways, which handle 51% <strong>of</strong> freight traffic versus only 14% in the U.S. As a result,<br />
China has embarked on a major road-building campaign, the scale <strong>of</strong> which has not been seen since the<br />
building <strong>of</strong> the Eisenhower U.S. Interstate network, and if the U.S. experience is a guide, China plans <strong>to</strong><br />
populate those highways with au<strong>to</strong>mobiles rapidly. China built 8,000 miles <strong>of</strong> expressway in the past three<br />
years, with plans <strong>to</strong> build seven additional east-west and five north-south expressways by 2008. Using those<br />
roads will be 72 million mo<strong>to</strong>r vehicles (excluding mo<strong>to</strong>rcycles) by 2010, according <strong>to</strong> a recent Chinese<br />
government study, up from only 20 million in 2001, for a growth rate <strong>of</strong> over 15% annually, similar <strong>to</strong> the<br />
U.S. experience <strong>of</strong> the first half <strong>of</strong> the 20th century. China imposes a tariff <strong>of</strong> 80% <strong>to</strong> 100% on imported<br />
au<strong>to</strong>s, but WTO entrance requires China <strong>to</strong> lower that rate <strong>to</strong> 25% by July 2006. Many <strong>of</strong> the world’s major<br />
au<strong>to</strong>makers are establishing manufacturing facilities in China, with the main purpose <strong>of</strong> selling cars <strong>to</strong> the<br />
domestic market rather than exporting them.<br />
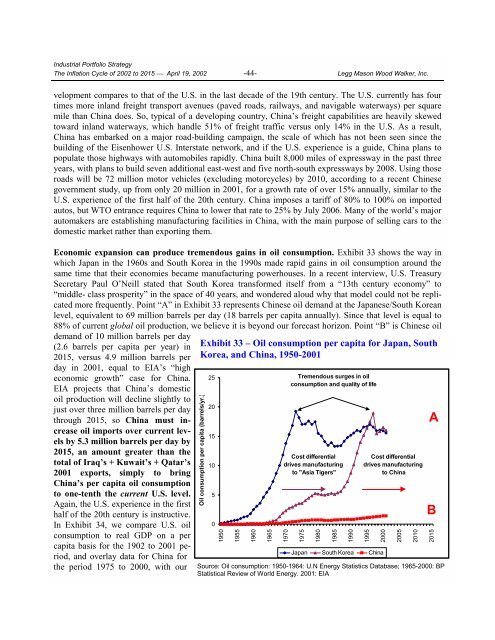
Economic expansion can produce tremendous gains in oil consumption. Exhibit 33 shows the way in<br />
which Japan in the 1960s and South Korea in the 1990s made rapid gains in oil consumption around the<br />
same time that their economies became manufacturing powerhouses. In a recent interview, U.S. Treasury<br />
Secretary Paul O’Neill stated that South Korea transformed itself from a “13th century economy” <strong>to</strong><br />
“middle- class prosperity” in the space <strong>of</strong> 40 years, and wondered aloud why that model could not be replicated<br />
more frequently. Point “A” in Exhibit 33 represents Chinese oil demand at the Japanese/South Korean<br />
level, equivalent <strong>to</strong> 69 million barrels per day (18 barrels per capita annually). Since that level is equal <strong>to</strong><br />
88% <strong>of</strong> current global oil production, we believe it is beyond our forecast horizon. Point “B” is Chinese oil<br />
demand <strong>of</strong> 10 million barrels per day<br />
(2.6 barrels per capita per year) in<br />
<strong>2015</strong>, versus 4.9 million barrels per<br />
day in 2001, equal <strong>to</strong> EIA’s “high<br />
economic growth” case for China.<br />
EIA projects that China’s domestic<br />
oil production will decline slightly <strong>to</strong><br />
just over three million barrels per day<br />
through <strong>2015</strong>, so China must increase<br />
oil imports over current levels<br />
by 5.3 million barrels per day by<br />
<strong>2015</strong>, an amount greater than the<br />
<strong>to</strong>tal <strong>of</strong> Iraq’s + Kuwait’s + Qatar’s<br />
2001 exports, simply <strong>to</strong> bring<br />
China’s per capita oil consumption<br />
<strong>to</strong> one-tenth the current U.S. level.<br />
Again, the U.S. experience in the first<br />
half <strong>of</strong> the 20th century is instructive.<br />
In Exhibit 34, we compare U.S. oil<br />
consumption <strong>to</strong> real GDP on a per<br />
capita basis for the 1902 <strong>to</strong> 2001 period,<br />
and overlay data for China for<br />
the period 1975 <strong>to</strong> 2000, with our<br />
Exhibit 33 – Oil consumption per capita for Japan, South<br />
Korea, and China, 1950-2001<br />
Oil consumption per capita (barrels/yr.)<br />
25<br />
20<br />
15<br />
10<br />
5<br />
0<br />
1950<br />
1955<br />
1960<br />
1965<br />
1970<br />
Tremendous surges in oil<br />
consumption and quality <strong>of</strong> life<br />
Cost differential<br />
drives manufacturing<br />
<strong>to</strong> "Asia Tigers"<br />
1975<br />
1980<br />
Source: Oil consumption: 1950-1964: U.N Energy Statistics Database; 1965-2000: BP<br />
Statistical Review <strong>of</strong> World Energy. 2001: EIA<br />
1985<br />
1990<br />
1995<br />
2000<br />
Japan South Korea China<br />
Cost differential<br />
drives manufacturing<br />
<strong>to</strong> China<br />
2005<br />
2010<br />
A<br />
B<br />
<strong>2015</strong>