The Inflation Cycle of 2002 to 2015 - Uhlmann Price Securities
The Inflation Cycle of 2002 to 2015 - Uhlmann Price Securities
The Inflation Cycle of 2002 to 2015 - Uhlmann Price Securities

Create successful ePaper yourself
Turn your PDF publications into a flip-book with our unique Google optimized e-Paper software.
Industrial Portfolio Strategy<br />
<strong>The</strong> <strong>Inflation</strong> <strong>Cycle</strong> <strong>of</strong> <strong>2002</strong> <strong>to</strong> <strong>2015</strong> ⎯ April 19, <strong>2002</strong> -29- Legg Mason Wood Walker, Inc.<br />
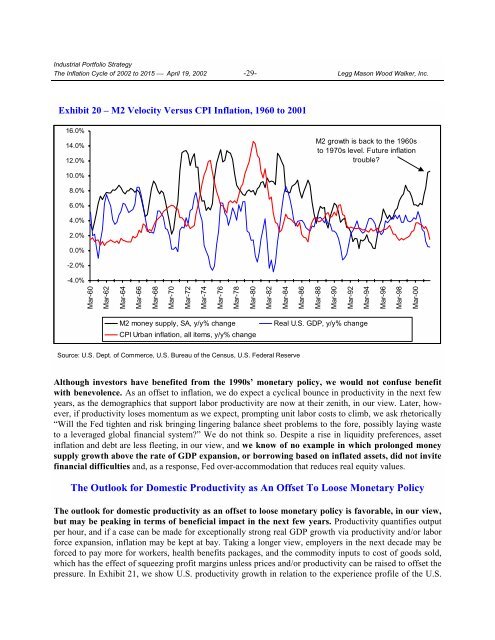
Exhibit 20 – M2 Velocity Versus CPI <strong>Inflation</strong>, 1960 <strong>to</strong> 2001<br />
16.0%<br />
14.0%<br />
12.0%<br />
M2 growth is back <strong>to</strong> the 1960s<br />
<strong>to</strong> 1970s level. Future inflation<br />
trouble?<br />
10.0%<br />
8.0%<br />
6.0%<br />
4.0%<br />
2.0%<br />
0.0%<br />
-2.0%<br />
-4.0%<br />
Mar-60<br />
Mar-62<br />
Mar-64<br />
Mar-66<br />
Mar-68<br />
Mar-70<br />
Mar-72<br />
Mar-74<br />
Mar-76<br />
Mar-78<br />
Mar-80<br />
Mar-82<br />
Mar-84<br />
Mar-86<br />
Mar-88<br />
Mar-90<br />
Mar-92<br />
Mar-94<br />
Mar-96<br />
Mar-98<br />
Mar-00<br />
M2 money supply, SA, y/y% change<br />
CPI Urban inflation, all items, y/y% change<br />
Real U.S. GDP, y/y% change<br />
Source: U.S. Dept. <strong>of</strong> Commerce, U.S. Bureau <strong>of</strong> the Census, U.S. Federal Reserve<br />
Although inves<strong>to</strong>rs have benefited from the 1990s’ monetary policy, we would not confuse benefit<br />
with benevolence. As an <strong>of</strong>fset <strong>to</strong> inflation, we do expect a cyclical bounce in productivity in the next few<br />
years, as the demographics that support labor productivity are now at their zenith, in our view. Later, however,<br />
if productivity loses momentum as we expect, prompting unit labor costs <strong>to</strong> climb, we ask rhe<strong>to</strong>rically<br />
“Will the Fed tighten and risk bringing lingering balance sheet problems <strong>to</strong> the fore, possibly laying waste<br />
<strong>to</strong> a leveraged global financial system?” We do not think so. Despite a rise in liquidity preferences, asset<br />
inflation and debt are less fleeting, in our view, and we know <strong>of</strong> no example in which prolonged money<br />
supply growth above the rate <strong>of</strong> GDP expansion, or borrowing based on inflated assets, did not invite<br />
financial difficulties and, as a response, Fed over-accommodation that reduces real equity values.<br />
<strong>The</strong> Outlook for Domestic Productivity as An Offset To Loose Monetary Policy<br />
<strong>The</strong> outlook for domestic productivity as an <strong>of</strong>fset <strong>to</strong> loose monetary policy is favorable, in our view,<br />
but may be peaking in terms <strong>of</strong> beneficial impact in the next few years. Productivity quantifies output<br />
per hour, and if a case can be made for exceptionally strong real GDP growth via productivity and/or labor<br />
force expansion, inflation may be kept at bay. Taking a longer view, employers in the next decade may be<br />
forced <strong>to</strong> pay more for workers, health benefits packages, and the commodity inputs <strong>to</strong> cost <strong>of</strong> goods sold,<br />
which has the effect <strong>of</strong> squeezing pr<strong>of</strong>it margins unless prices and/or productivity can be raised <strong>to</strong> <strong>of</strong>fset the<br />
pressure. In Exhibit 21, we show U.S. productivity growth in relation <strong>to</strong> the experience pr<strong>of</strong>ile <strong>of</strong> the U.S.