The Inflation Cycle of 2002 to 2015 - Uhlmann Price Securities
The Inflation Cycle of 2002 to 2015 - Uhlmann Price Securities
The Inflation Cycle of 2002 to 2015 - Uhlmann Price Securities

You also want an ePaper? Increase the reach of your titles
YUMPU automatically turns print PDFs into web optimized ePapers that Google loves.
Industrial Portfolio Strategy<br />
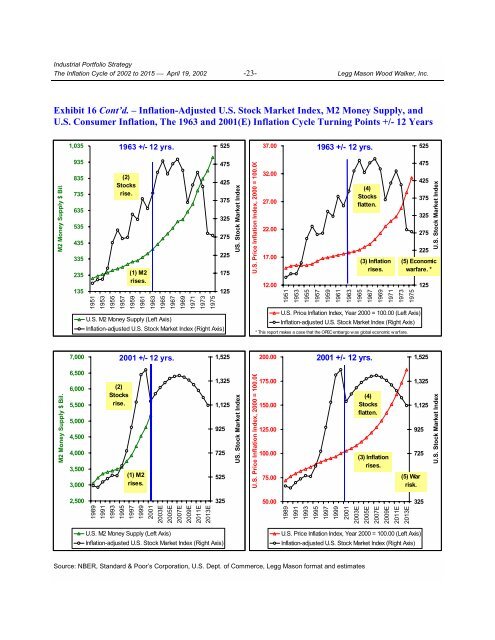
<strong>The</strong> <strong>Inflation</strong> <strong>Cycle</strong> <strong>of</strong> <strong>2002</strong> <strong>to</strong> <strong>2015</strong> ⎯ April 19, <strong>2002</strong> -23- Legg Mason Wood Walker, Inc.<br />
Exhibit 16 Cont’d. – <strong>Inflation</strong>-Adjusted U.S. S<strong>to</strong>ck Market Index, M2 Money Supply, and<br />
U.S. Consumer <strong>Inflation</strong>, <strong>The</strong> 1963 and 2001(E) <strong>Inflation</strong> <strong>Cycle</strong> Turning Points +/- 12 Years<br />
1,035<br />
1963 +/- 12 yrs.<br />
525<br />
37.00<br />
1963 +/- 12 yrs.<br />
525<br />
M2 Money Supply $ Bil.<br />
935<br />
835<br />
735<br />
635<br />
535<br />
435<br />
335<br />
235<br />
135<br />
(2)<br />
S<strong>to</strong>cks<br />
rise.<br />
(1) M2<br />
rises.<br />
1951<br />
1953<br />
1955<br />
1957<br />
1959<br />
1961<br />
1963<br />
1965<br />
1967<br />
1969<br />
1971<br />
1973<br />
1975<br />
U.S. M2 Money Supply (Left Axis)<br />
<strong>Inflation</strong>-adjusted U.S. S<strong>to</strong>ck Market Index (Right Axis)<br />
475<br />
425<br />
375<br />
325<br />
275<br />
225<br />
175<br />
125<br />
US. S<strong>to</strong>ck Market Index<br />
U.S. <strong>Price</strong> <strong>Inflation</strong> Index, 2000 = 100.00<br />
32.00<br />
27.00<br />
22.00<br />
17.00<br />
12.00<br />
(4)<br />
S<strong>to</strong>cks<br />
flatten.<br />
(3) <strong>Inflation</strong><br />
rises.<br />
1951<br />
1953<br />
1955<br />
1957<br />
1959<br />
1961<br />
1963<br />
1965<br />
1967<br />
1969<br />
1971<br />
1973<br />
1975<br />
475<br />
425<br />
375<br />
325<br />
275<br />
225<br />
(5) Economic<br />
warfare. 175 *<br />
U.S. <strong>Price</strong> <strong>Inflation</strong> Index, Year 2000 = 100.00 (Left Axis)<br />
<strong>Inflation</strong>-adjusted U.S. S<strong>to</strong>ck Market Index (Right Axis)<br />
7,000<br />
2001 +/- 12 yrs.<br />
1,525<br />
6,500<br />
6,000<br />
5,500<br />
5,000<br />
4,500<br />
4,000<br />
3,500<br />
3,000<br />
2,500<br />
1989<br />
1991<br />
1993<br />
1995<br />
1997<br />
1999<br />
2001<br />
2003E<br />
2005E<br />
2007E<br />
2009E<br />
2011E<br />
2013E<br />
* This report makes a case that the OPEC embargo w as global economic w arfare.<br />
125<br />
U.S. S<strong>to</strong>ck Market Index<br />
200.00<br />
2001 +/- 12 yrs.<br />
1,525<br />
M2 Money Supply $ Bil.<br />
(2)<br />
S<strong>to</strong>cks<br />
rise.<br />
(1) M2<br />
rises.<br />
1,325<br />
1,125<br />
925<br />
725<br />
525<br />
US. S<strong>to</strong>ck Market Index<br />
U.S. <strong>Price</strong> <strong>Inflation</strong> Index, 2000 = 100.00<br />
175.00<br />
150.00<br />
125.00<br />
100.00<br />
75.00<br />
(4)<br />
S<strong>to</strong>cks<br />
flatten.<br />
(3) <strong>Inflation</strong><br />
rises.<br />
1,325<br />
1,125<br />
925<br />
725<br />
(5) War 525<br />
risk.<br />
325<br />
50.00<br />
1989<br />
1991<br />
1993<br />
1995<br />
1997<br />
1999<br />
2001<br />
2003E<br />
2005E<br />
2007E<br />
2009E<br />
2011E<br />
2013E<br />
U.S. S<strong>to</strong>ck Market Index<br />
325<br />
U.S. M2 Money Supply (Left Axis)<br />
<strong>Inflation</strong>-adjusted U.S. S<strong>to</strong>ck Market Index (Right Axis)<br />
U.S. <strong>Price</strong> <strong>Inflation</strong> Index, Year 2000 = 100.00 (Left Axis)<br />
<strong>Inflation</strong>-adjusted U.S. S<strong>to</strong>ck Market Index (Right Axis)<br />
Source: NBER, Standard & Poor’s Corporation, U.S. Dept. <strong>of</strong> Commerce, Legg Mason format and estimates