The Inflation Cycle of 2002 to 2015 - Uhlmann Price Securities
The Inflation Cycle of 2002 to 2015 - Uhlmann Price Securities
The Inflation Cycle of 2002 to 2015 - Uhlmann Price Securities

Create successful ePaper yourself
Turn your PDF publications into a flip-book with our unique Google optimized e-Paper software.
Industrial Portfolio Strategy<br />
<strong>The</strong> <strong>Inflation</strong> <strong>Cycle</strong> <strong>of</strong> <strong>2002</strong> <strong>to</strong> <strong>2015</strong> ⎯ April 19, <strong>2002</strong> -21- Legg Mason Wood Walker, Inc.<br />
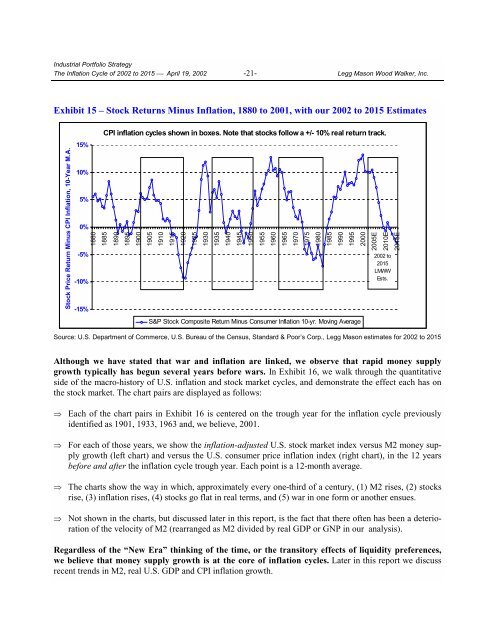
Exhibit 15 – S<strong>to</strong>ck Returns Minus <strong>Inflation</strong>, 1880 <strong>to</strong> 2001, with our <strong>2002</strong> <strong>to</strong> <strong>2015</strong> Estimates<br />
S<strong>to</strong>ck <strong>Price</strong> Return Minus CPI <strong>Inflation</strong>, 10-Year M.A.<br />
15%<br />
10%<br />
5%<br />
0%<br />
-5%<br />
-10%<br />
-15%<br />
CPI inflation cycles shown in boxes. Note that s<strong>to</strong>cks follow a +/- 10% real return track.<br />
1880<br />
1885<br />
1890<br />
1895<br />
1900<br />
1905<br />
1910<br />
1915<br />
1920<br />
1925<br />
1930<br />
1935<br />
1940<br />
1945<br />
1950<br />
1955<br />
1960<br />
1965<br />
1970<br />
1975<br />
1980<br />
1985<br />
1990<br />
1995<br />
2000<br />
2005E<br />
2010E<br />
<strong>2015</strong>E<br />
S&P S<strong>to</strong>ck Composite Return Minus Consumer <strong>Inflation</strong> 10-yr. Moving Average<br />
<strong>2002</strong> <strong>to</strong><br />
<strong>2015</strong><br />
LMWW<br />
Ests.<br />
Source: U.S. Department <strong>of</strong> Commerce, U.S. Bureau <strong>of</strong> the Census, Standard & Poor’s Corp., Legg Mason estimates for <strong>2002</strong> <strong>to</strong> <strong>2015</strong><br />
Although we have stated that war and inflation are linked, we observe that rapid money supply<br />
growth typically has begun several years before wars. In Exhibit 16, we walk through the quantitative<br />
side <strong>of</strong> the macro-his<strong>to</strong>ry <strong>of</strong> U.S. inflation and s<strong>to</strong>ck market cycles, and demonstrate the effect each has on<br />
the s<strong>to</strong>ck market. <strong>The</strong> chart pairs are displayed as follows:<br />
<br />
<br />
<br />
<br />
Each <strong>of</strong> the chart pairs in Exhibit 16 is centered on the trough year for the inflation cycle previously<br />
identified as 1901, 1933, 1963 and, we believe, 2001.<br />
For each <strong>of</strong> those years, we show the inflation-adjusted U.S. s<strong>to</strong>ck market index versus M2 money supply<br />
growth (left chart) and versus the U.S. consumer price inflation index (right chart), in the 12 years<br />
before and after the inflation cycle trough year. Each point is a 12-month average.<br />
<strong>The</strong> charts show the way in which, approximately every one-third <strong>of</strong> a century, (1) M2 rises, (2) s<strong>to</strong>cks<br />
rise, (3) inflation rises, (4) s<strong>to</strong>cks go flat in real terms, and (5) war in one form or another ensues.<br />
Not shown in the charts, but discussed later in this report, is the fact that there <strong>of</strong>ten has been a deterioration<br />
<strong>of</strong> the velocity <strong>of</strong> M2 (rearranged as M2 divided by real GDP or GNP in our analysis).<br />
Regardless <strong>of</strong> the “New Era” thinking <strong>of</strong> the time, or the transi<strong>to</strong>ry effects <strong>of</strong> liquidity preferences,<br />
we believe that money supply growth is at the core <strong>of</strong> inflation cycles. Later in this report we discuss<br />
recent trends in M2, real U.S. GDP and CPI inflation growth.