The Inflation Cycle of 2002 to 2015 - Uhlmann Price Securities
The Inflation Cycle of 2002 to 2015 - Uhlmann Price Securities
The Inflation Cycle of 2002 to 2015 - Uhlmann Price Securities

Create successful ePaper yourself
Turn your PDF publications into a flip-book with our unique Google optimized e-Paper software.
Industrial Portfolio Strategy<br />
<strong>The</strong> <strong>Inflation</strong> <strong>Cycle</strong> <strong>of</strong> <strong>2002</strong> <strong>to</strong> <strong>2015</strong> ⎯ April 19, <strong>2002</strong> -47- Legg Mason Wood Walker, Inc.<br />
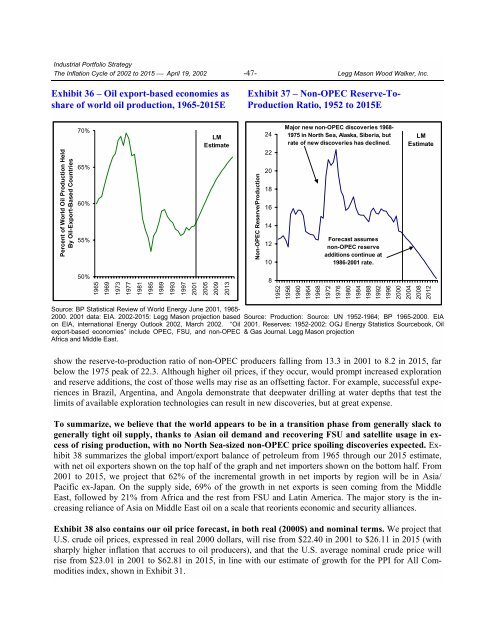
Exhibit 36 – Oil export-based economies as<br />
share <strong>of</strong> world oil production, 1965-<strong>2015</strong>E<br />
Exhibit 37 – Non-OPEC Reserve-To-<br />
Production Ratio, 1952 <strong>to</strong> <strong>2015</strong>E<br />
Percent <strong>of</strong> World Oil Production Held<br />
By Oil-Export-Based Countries<br />
70%<br />
65%<br />
60%<br />
55%<br />
LM<br />
Estimate<br />
Non-OPEC Reserve/Production<br />
24<br />
22<br />
20<br />
18<br />
16<br />
14<br />
12<br />
10<br />
Major new non-OPEC discoveries 1968-<br />
1975 in North Sea, Alaska, Siberia, but<br />
rate <strong>of</strong> new discoveries has declined.<br />
Forecast assumes<br />
non-OPEC reserve<br />
additions continue at<br />
1986-2001 rate.<br />
LM<br />
Estimate<br />
50%<br />
1965<br />
1969<br />
1973<br />
1977<br />
1981<br />
1985<br />
1989<br />
1993<br />
1997<br />
2001<br />
2005<br />
2009<br />
2013<br />
8<br />
1952<br />
1956<br />
1960<br />
1964<br />
1968<br />
1972<br />
1976<br />
1980<br />
1984<br />
1988<br />
1992<br />
1996<br />
2000<br />
2004<br />
2008<br />
2012<br />
Source: BP Statistical Review <strong>of</strong> World Energy June 2001, 1965-<br />
2000. 2001 data: EIA. <strong>2002</strong>-<strong>2015</strong>: Legg Mason projection based<br />
on EIA, international Energy Outlook <strong>2002</strong>, March <strong>2002</strong>. “Oil<br />
export-based economies” include OPEC, FSU, and non-OPEC<br />
Africa and Middle East.<br />
Source: Production: Source: UN 1952-1964; BP 1965-2000. EIA<br />
2001. Reserves: 1952-<strong>2002</strong>: OGJ Energy Statistics Sourcebook, Oil<br />
& Gas Journal. Legg Mason projection<br />
show the reserve-<strong>to</strong>-production ratio <strong>of</strong> non-OPEC producers falling from 13.3 in 2001 <strong>to</strong> 8.2 in <strong>2015</strong>, far<br />
below the 1975 peak <strong>of</strong> 22.3. Although higher oil prices, if they occur, would prompt increased exploration<br />
and reserve additions, the cost <strong>of</strong> those wells may rise as an <strong>of</strong>fsetting fac<strong>to</strong>r. For example, successful experiences<br />
in Brazil, Argentina, and Angola demonstrate that deepwater drilling at water depths that test the<br />
limits <strong>of</strong> available exploration technologies can result in new discoveries, but at great expense.<br />
To summarize, we believe that the world appears <strong>to</strong> be in a transition phase from generally slack <strong>to</strong><br />
generally tight oil supply, thanks <strong>to</strong> Asian oil demand and recovering FSU and satellite usage in excess<br />
<strong>of</strong> rising production, with no North Sea-sized non-OPEC price spoiling discoveries expected. Exhibit<br />
38 summarizes the global import/export balance <strong>of</strong> petroleum from 1965 through our <strong>2015</strong> estimate,<br />
with net oil exporters shown on the <strong>to</strong>p half <strong>of</strong> the graph and net importers shown on the bot<strong>to</strong>m half. From<br />
2001 <strong>to</strong> <strong>2015</strong>, we project that 62% <strong>of</strong> the incremental growth in net imports by region will be in Asia/<br />
Pacific ex-Japan. On the supply side, 69% <strong>of</strong> the growth in net exports is seen coming from the Middle<br />
East, followed by 21% from Africa and the rest from FSU and Latin America. <strong>The</strong> major s<strong>to</strong>ry is the increasing<br />
reliance <strong>of</strong> Asia on Middle East oil on a scale that reorients economic and security alliances.<br />
Exhibit 38 also contains our oil price forecast, in both real (2000$) and nominal terms. We project that<br />
U.S. crude oil prices, expressed in real 2000 dollars, will rise from $22.40 in 2001 <strong>to</strong> $26.11 in <strong>2015</strong> (with<br />
sharply higher inflation that accrues <strong>to</strong> oil producers), and that the U.S. average nominal crude price will<br />
rise from $23.01 in 2001 <strong>to</strong> $62.81 in <strong>2015</strong>, in line with our estimate <strong>of</strong> growth for the PPI for All Commodities<br />
index, shown in Exhibit 31.