The Inflation Cycle of 2002 to 2015 - Uhlmann Price Securities
The Inflation Cycle of 2002 to 2015 - Uhlmann Price Securities
The Inflation Cycle of 2002 to 2015 - Uhlmann Price Securities

Create successful ePaper yourself
Turn your PDF publications into a flip-book with our unique Google optimized e-Paper software.
Industrial Portfolio Strategy<br />
<strong>The</strong> <strong>Inflation</strong> <strong>Cycle</strong> <strong>of</strong> <strong>2002</strong> <strong>to</strong> <strong>2015</strong> ⎯ April 19, <strong>2002</strong> -39- Legg Mason Wood Walker, Inc.<br />
Scenario (2) Rapid Developing Country Modernization And Global Economic<br />
Growth Leading <strong>to</strong> a Sustained and <strong>Inflation</strong>ary Boom in Commodity<br />
Demand: Probability: 60%<br />
Will Surging Demand Create Peacetime Commodity <strong>Inflation</strong>?<br />
In a peacetime scenario, we believe that the U.S.’s need for sustainable growth <strong>to</strong> service its debts will<br />
require the creation <strong>of</strong> new markets <strong>to</strong> sell its goods and services, primarily in the developing world.<br />
In an unusual twist versus the his<strong>to</strong>rical norm <strong>of</strong> trade-based deflation, we believe that there is a 60% probability<br />
that the post-Communist, World Trade Organization-inspired, fertile mix <strong>of</strong> cheap labor, freeflowing<br />
capital, and technology transfer will create extraordinarily rapid global economic growth that<br />
places stresses on key raw material markets. Many raw materials producers have scaled back their internal<br />
investment as they have incurred poor returns since the previous inflation cycle, which ended approximately<br />
20 years ago. <strong>The</strong> combination <strong>of</strong> sustained, strong demand plus relatively inelastic supply, along with a<br />
Fed that remains somewhat accommodative as a result <strong>of</strong> the financial and political stresses discussed earlier,<br />
could spur a demand-led price inflation cycle in the <strong>2002</strong> <strong>to</strong> <strong>2015</strong> period.<br />
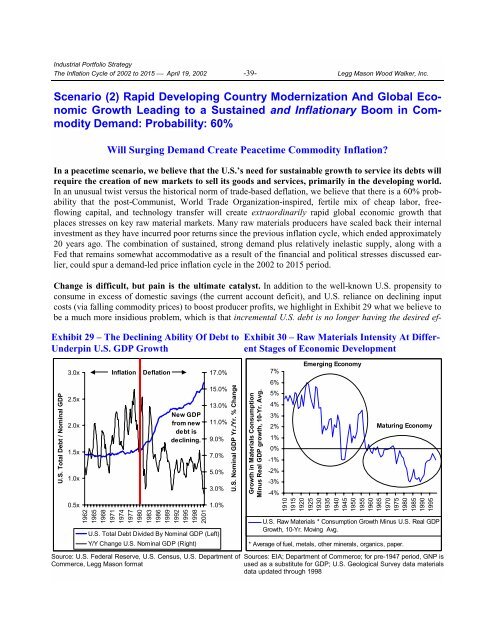
Change is difficult, but pain is the ultimate catalyst. In addition <strong>to</strong> the well-known U.S. propensity <strong>to</strong><br />
consume in excess <strong>of</strong> domestic savings (the current account deficit), and U.S. reliance on declining input<br />
costs (via falling commodity prices) <strong>to</strong> boost producer pr<strong>of</strong>its, we highlight in Exhibit 29 what we believe <strong>to</strong><br />
be a much more insidious problem, which is that incremental U.S. debt is no longer having the desired ef-<br />
Exhibit 29 – <strong>The</strong> Declining Ability Of Debt <strong>to</strong><br />
Underpin U.S. GDP Growth<br />
U.S. Total Debt / Nominal GDP<br />
3.0x<br />
2.5x<br />
2.0x<br />
1.5x<br />
1.0x<br />
0.5x<br />
<strong>Inflation</strong><br />
Deflation<br />
New GDP<br />
from new<br />
debt is<br />
declining.<br />
1962<br />
1965<br />
1968<br />
1971<br />
1974<br />
1977<br />
1980<br />
1983<br />
1986<br />
1989<br />
1992<br />
1995<br />
1998<br />
2001<br />
17.0%<br />
15.0%<br />
13.0%<br />
11.0%<br />
9.0%<br />
7.0%<br />
5.0%<br />
3.0%<br />
1.0%<br />
U.S. Total Debt Divided By Nominal GDP (Left)<br />
Y/Y Change U.S. Nominal GDP (Right)<br />
Source: U.S. Federal Reserve, U.S. Census, U.S. Department <strong>of</strong><br />
Commerce, Legg Mason format<br />
U.S. Nominal GDP Yr./Yr. % Change<br />
Exhibit 30 – Raw Materials Intensity At Different<br />
Stages <strong>of</strong> Economic Development<br />
Growth in Materials Consumption<br />
Minus Real GDP growth, 10-Yr. Avg.<br />
7%<br />
6%<br />
5%<br />
4%<br />
3%<br />
2%<br />
1%<br />
0%<br />
-1%<br />
-2%<br />
-3%<br />
-4%<br />
Emerging Economy<br />
Maturing Economy<br />
1910<br />
1915<br />
1920<br />
1925<br />
1930<br />
1935<br />
1940<br />
1945<br />
1950<br />
1955<br />
1960<br />
1965<br />
1970<br />
1975<br />
1980<br />
1985<br />
1990<br />
1995<br />
U.S. Raw Materials * Consumption Growth Minus U.S. Real GDP<br />
Growth, 10-Yr. Moving Avg.<br />
* Average <strong>of</strong> fuel, metals, other minerals, organics, paper.<br />
Sources: EIA; Department <strong>of</strong> Commerce; for pre-1947 period, GNP is<br />
used as a substitute for GDP; U.S. Geological Survey data materials<br />
data updated through 1998