The Inflation Cycle of 2002 to 2015 - Uhlmann Price Securities
The Inflation Cycle of 2002 to 2015 - Uhlmann Price Securities
The Inflation Cycle of 2002 to 2015 - Uhlmann Price Securities

You also want an ePaper? Increase the reach of your titles
YUMPU automatically turns print PDFs into web optimized ePapers that Google loves.
Industrial Portfolio Strategy<br />
<strong>The</strong> <strong>Inflation</strong> <strong>Cycle</strong> <strong>of</strong> <strong>2002</strong> <strong>to</strong> <strong>2015</strong> ⎯ April 19, <strong>2002</strong> -51- Legg Mason Wood Walker, Inc.<br />
U.S. Farm Commodity Export and <strong>Inflation</strong> Prospects, <strong>2002</strong> <strong>to</strong> <strong>2015</strong>E<br />
U.S. Farm Commodity <strong>Price</strong> <strong>Cycle</strong>s<br />
In Exhibit 40, we show the seven inflationary or deflationary price cycles <strong>of</strong> the PPI for Farm Products<br />
(PPI-Farm) index from 1870 <strong>to</strong> present. <strong>The</strong> cycles have lasted an average <strong>of</strong> 19 years, with prices<br />
in the average inflation cycle rising 8.0% per year, in a range <strong>of</strong> 6.2% <strong>to</strong> 9.8% per year. <strong>Price</strong>s in the average<br />
deflation cycle declined 2.6% per year, in a range <strong>of</strong> minus 8.7% <strong>to</strong> positive 1.6%. We find it interesting<br />
that inflation cycles are more uniform and regular than cycles <strong>of</strong> deflation in the farm industry. As Exhibit<br />
40 shows, some <strong>of</strong> the determinants <strong>of</strong> those cycles have been rising or falling input costs, farm productivity,<br />
and acreage, but one <strong>of</strong> the most important determinants has been the growth <strong>of</strong> exports. For clues as <strong>to</strong><br />
the direction <strong>of</strong> U.S. agricultural export growth we turn <strong>to</strong> the U.S. dollar. <strong>The</strong> declines in the agricultural<br />
trade-weighted U.S. dollar from 1970 <strong>to</strong> 1978 and 1985 <strong>to</strong> 1993 were associated with a surge in the export<br />
<strong>of</strong> U.S. agricultural products, just as U.S. dollar strength in 1978 <strong>to</strong> 1985 and 1995 <strong>to</strong> <strong>2002</strong> pressured U.S.<br />
food exports. An important difference between agricultural exports and oil exports is that the latter is denominated<br />
in U.S. dollars worldwide, whereas the fluctuations in home currency have a disproportionate<br />
effect on farmers (and numerous other commodity producers, for that matter).<br />
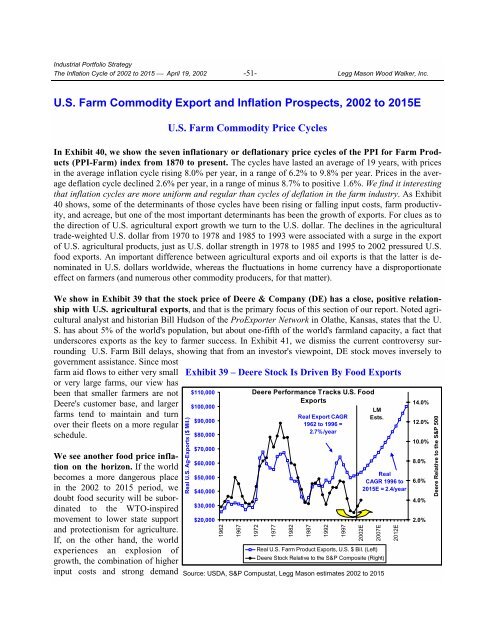
We show in Exhibit 39 that the s<strong>to</strong>ck price <strong>of</strong> Deere & Company (DE) has a close, positive relationship<br />
with U.S. agricultural exports, and that is the primary focus <strong>of</strong> this section <strong>of</strong> our report. Noted agricultural<br />
analyst and his<strong>to</strong>rian Bill Hudson <strong>of</strong> the ProExporter Network in Olathe, Kansas, states that the U.<br />
S. has about 5% <strong>of</strong> the world's population, but about one-fifth <strong>of</strong> the world's farmland capacity, a fact that<br />
underscores exports as the key <strong>to</strong> farmer success. In Exhibit 41, we dismiss the current controversy surrounding<br />
U.S. Farm Bill delays, showing that from an inves<strong>to</strong>r's viewpoint, DE s<strong>to</strong>ck moves inversely <strong>to</strong><br />
government assistance. Since most<br />
farm aid flows <strong>to</strong> either very small<br />
or very large farms, our view has<br />
been that smaller farmers are not<br />
Deere's cus<strong>to</strong>mer base, and larger<br />
farms tend <strong>to</strong> maintain and turn<br />
over their fleets on a more regular<br />
schedule.<br />
We see another food price inflation<br />
on the horizon. If the world<br />
becomes a more dangerous place<br />
in the <strong>2002</strong> <strong>to</strong> <strong>2015</strong> period, we<br />
doubt food security will be subordinated<br />
<strong>to</strong> the WTO-inspired<br />
movement <strong>to</strong> lower state support<br />
and protectionism for agriculture.<br />
If, on the other hand, the world<br />
experiences an explosion <strong>of</strong><br />
growth, the combination <strong>of</strong> higher<br />
input costs and strong demand<br />
Exhibit 39 – Deere S<strong>to</strong>ck Is Driven By Food Exports<br />
Real U.S. Ag-Exports ($ Mil.)<br />
$110,000<br />
$100,000<br />
$90,000<br />
$80,000<br />
$70,000<br />
$60,000<br />
$50,000<br />
$40,000<br />
$30,000<br />
$20,000<br />
1962<br />
1967<br />
Deere Performance Tracks U.S. Food<br />
Exports<br />
1972<br />
1977<br />
Source: USDA, S&P Compustat, Legg Mason estimates <strong>2002</strong> <strong>to</strong> <strong>2015</strong><br />
1982<br />
Real Export CAGR<br />
1962 <strong>to</strong> 1996 =<br />
2.7%/year<br />
1987<br />
1992<br />
1997<br />
<strong>2002</strong>E<br />
LM<br />
Ests.<br />
Real U.S. Farm Product Exports, U.S. $ Bil. (Left)<br />
2007E<br />
Deere S<strong>to</strong>ck Relative <strong>to</strong> the S&P Composite (Right)<br />
Real<br />
CAGR 1996 <strong>to</strong><br />
<strong>2015</strong>E = 2.4/year<br />
2012E<br />
14.0%<br />
12.0%<br />
10.0%<br />
8.0%<br />
6.0%<br />
4.0%<br />
2.0%<br />
Deere Relative <strong>to</strong> the S&P 500