The Inflation Cycle of 2002 to 2015 - Uhlmann Price Securities
The Inflation Cycle of 2002 to 2015 - Uhlmann Price Securities
The Inflation Cycle of 2002 to 2015 - Uhlmann Price Securities

You also want an ePaper? Increase the reach of your titles
YUMPU automatically turns print PDFs into web optimized ePapers that Google loves.
Industrial Portfolio Strategy<br />
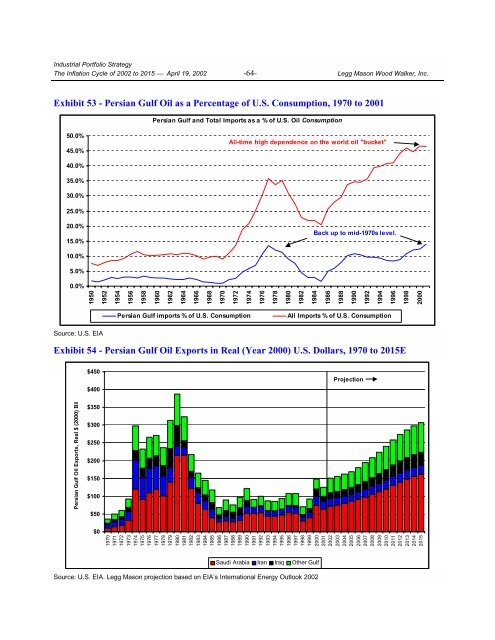
<strong>The</strong> <strong>Inflation</strong> <strong>Cycle</strong> <strong>of</strong> <strong>2002</strong> <strong>to</strong> <strong>2015</strong> ⎯ April 19, <strong>2002</strong> -64- Legg Mason Wood Walker, Inc.<br />
Exhibit 53 - Persian Gulf Oil as a Percentage <strong>of</strong> U.S. Consumption, 1970 <strong>to</strong> 2001<br />
Persian Gulf and Total Imports as a % <strong>of</strong> U.S. Oil Consumption<br />
50.0%<br />
45.0%<br />
All-time high dependence on the world oil "bucket"<br />
40.0%<br />
35.0%<br />
30.0%<br />
25.0%<br />
20.0%<br />
15.0%<br />
Back up <strong>to</strong> mid-1970s level.<br />
10.0%<br />
5.0%<br />
0.0%<br />
1950<br />
1952<br />
1954<br />
1956<br />
1958<br />
1960<br />
1962<br />
1964<br />
1966<br />
1968<br />
1970<br />
1972<br />
1974<br />
1976<br />
1978<br />
1980<br />
1982<br />
1984<br />
1986<br />
1988<br />
1990<br />
1992<br />
1994<br />
1996<br />
1998<br />
2000<br />
Persian Gulf imports % <strong>of</strong> U.S. Consumption<br />
All Imports % <strong>of</strong> U.S. Consumption<br />
Source: U.S. EIA<br />
Exhibit 54 - Persian Gulf Oil Exports in Real (Year 2000) U.S. Dollars, 1970 <strong>to</strong> <strong>2015</strong>E<br />
$450<br />
$400<br />
Projection<br />
Persian Gulf Oil Exports, Real $ (2000) Bil<br />
$350<br />
$300<br />
$250<br />
$200<br />
$150<br />
$100<br />
$50<br />
$0<br />
1970<br />
1971<br />
1972<br />
1973<br />
1974<br />
1975<br />
1976<br />
1977<br />
1978<br />
1979<br />
1980<br />
1981<br />
1982<br />
1983<br />
1984<br />
1985<br />
1986<br />
1987<br />
1988<br />
1989<br />
1990<br />
1991<br />
1992<br />
1993<br />
1994<br />
1995<br />
1996<br />
1997<br />
1998<br />
1999<br />
2000<br />
2001<br />
<strong>2002</strong><br />
2003<br />
2004<br />
2005<br />
2006<br />
2007<br />
2008<br />
2009<br />
2010<br />
2011<br />
2012<br />
2013<br />
2014<br />
<strong>2015</strong><br />
Saudi Arabia Iran Iraq Other Gulf<br />
Source: U.S. EIA. Legg Mason projection based on EIA’s International Energy Outlook <strong>2002</strong>