The Inflation Cycle of 2002 to 2015 - Uhlmann Price Securities
The Inflation Cycle of 2002 to 2015 - Uhlmann Price Securities
The Inflation Cycle of 2002 to 2015 - Uhlmann Price Securities

You also want an ePaper? Increase the reach of your titles
YUMPU automatically turns print PDFs into web optimized ePapers that Google loves.
Industrial Portfolio Strategy<br />
<strong>The</strong> <strong>Inflation</strong> <strong>Cycle</strong> <strong>of</strong> <strong>2002</strong> <strong>to</strong> <strong>2015</strong> ⎯ April 19, <strong>2002</strong> -56- Legg Mason Wood Walker, Inc.<br />
ports, where demand is believed <strong>to</strong> be<br />
greater and less subject <strong>to</strong> political<br />
considerations.<br />
Despite the competitive pressure,<br />
we believe Chinese agriculture<br />
should not be underestimated. Chinese<br />
production <strong>of</strong> corn, wheat and<br />
rice grew from about 100 MMT in the<br />
early 1960s, just before a disastrous<br />
famine, <strong>to</strong> 200 MMT in the late 1970s,<br />
as labor and land were applied <strong>to</strong> the<br />
shortage problem. Since China introduced<br />
certain agricultural market reforms<br />
in 1978, followed by an additional<br />
round in the mid-1990s termed<br />
the "Governor's Grain Bag" policy,<br />
<strong>to</strong>tal agricultural staples production<br />
rose <strong>to</strong> about 390 MMT in the late<br />
1990s, an increase <strong>of</strong> 90% in two decades.<br />
China set its tariff rate quotas<br />
(TRQs) high enough for corn and<br />
wheat that they are unlikely <strong>to</strong> be a<br />
problem for exporters <strong>to</strong> China in<br />
FY02, and notably absent is a TRQ<br />
for soybeans, <strong>of</strong> which China has<br />
been a prodigious importer. In fact,<br />
Chinese imports <strong>of</strong> soybeans represent<br />
about 20% <strong>of</strong> the global oilseed<br />
trade, and China imported approximately<br />
14 MMT <strong>of</strong> soybeans last<br />
year. China has maintained a liberal<br />
import policy with respect <strong>to</strong> soybean<br />
imports <strong>to</strong> feed its growing domestic<br />
needs, so we are not alarmed by the<br />
genetically modified organism (GMO)<br />
talk, which may simply be posturing<br />
<strong>to</strong> protect other segments <strong>of</strong> the Chinese<br />
farming sec<strong>to</strong>r.<br />
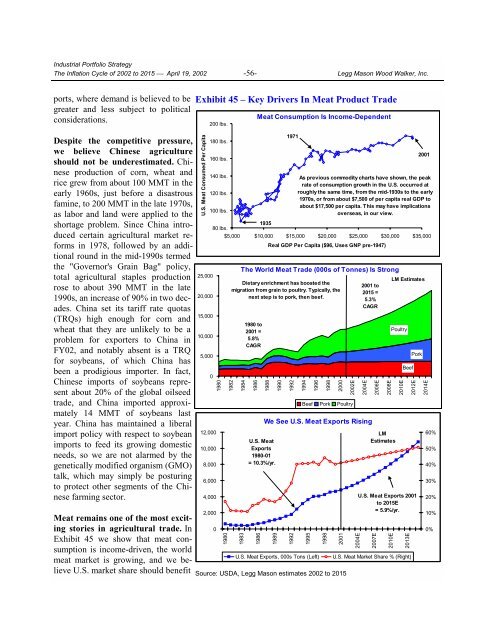
Exhibit 45 – Key Drivers In Meat Product Trade<br />
U.S. Meat Consumed Per Capita<br />
25,000<br />
20,000<br />
15,000<br />
10,000<br />
200 lbs.<br />
180 lbs.<br />
160 lbs.<br />
140 lbs.<br />
120 lbs.<br />
100 lbs.<br />
Meat Consumption Is Income-Dependent<br />
1935<br />
80 lbs.<br />
$5,000 $10,000 $15,000 $20,000 $25,000 $30,000 $35,000<br />
Real GDP Per Capita ($96, Uses GNP pre-1947)<br />
Meat remains one <strong>of</strong> the most exciting<br />
s<strong>to</strong>ries in agricultural trade. In 0<br />
Exhibit 45 we show that meat consumption<br />
is income-driven, the world<br />
U.S. Meat Exports, 000s Tons (Left)<br />
meat market is growing, and we believe<br />
U.S. market share should benefit Source: USDA, Legg Mason estimates <strong>2002</strong> <strong>to</strong> <strong>2015</strong><br />
5,000<br />
0<br />
12,000<br />
10,000<br />
8,000<br />
6,000<br />
4,000<br />
2,000<br />
1980<br />
1980<br />
1982<br />
1984<br />
1986<br />
1988<br />
1990<br />
1971<br />
1992<br />
2001<br />
As previous commodity charts have shown, the peak<br />
rate <strong>of</strong> consumption growth in the U.S. occurred at<br />
roughly the same time, from the mid-1930s <strong>to</strong> the early<br />
1970s, or from about $7,500 <strong>of</strong> per capita real GDP <strong>to</strong><br />
about $17,500 per capita. This may have implications<br />
overseas, in our view.<br />
<strong>The</strong> World Meat Trade (000s <strong>of</strong> Tonnes) Is Strong<br />
LM Estimates<br />
Dietary enrichment has boosted the<br />
2001 <strong>to</strong><br />
migration from grain <strong>to</strong> poultry. Typically, the<br />
<strong>2015</strong> =<br />
next step is <strong>to</strong> pork, then beef.<br />
5.3%<br />
CAGR<br />
1983<br />
1980 <strong>to</strong><br />
2001 =<br />
5.8%<br />
CAGR<br />
U.S. Meat<br />
Exports<br />
1980-01<br />
= 10.3%/yr.<br />
1986<br />
1994<br />
1996<br />
1998<br />
2000<br />
<strong>2002</strong>E<br />
Beef Pork Poultry<br />
2004E<br />
We See U.S. Meat Exports Rising<br />
1989<br />
1992<br />
1995<br />
1998<br />
2001<br />
2004E<br />
2006E<br />
2008E<br />
LM<br />
Estimates<br />
2007E<br />
2010E<br />
Poultry<br />
2010E<br />
Beef<br />
2013E<br />
Pork<br />
2012E<br />
U.S. Meat Exports 2001<br />
<strong>to</strong> <strong>2015</strong>E<br />
= 5.9%/yr.<br />
U.S. Meat Market Share % (Right)<br />
2014E<br />
60%<br />
50%<br />
40%<br />
30%<br />
20%<br />
10%<br />
0%