The Inflation Cycle of 2002 to 2015 - Uhlmann Price Securities
The Inflation Cycle of 2002 to 2015 - Uhlmann Price Securities
The Inflation Cycle of 2002 to 2015 - Uhlmann Price Securities
Create successful ePaper yourself
Turn your PDF publications into a flip-book with our unique Google optimized e-Paper software.
Industrial Portfolio Strategy<br />
<strong>The</strong> <strong>Inflation</strong> <strong>Cycle</strong> <strong>of</strong> <strong>2002</strong> <strong>to</strong> <strong>2015</strong> ⎯ April 19, <strong>2002</strong> -7- Legg Mason Wood Walker, Inc.<br />
Report Conclusion: “His<strong>to</strong>ry Doesn’t Repeat Itself, But It Does<br />
Rhyme” – Mark Twain<br />
This report began with the question “Do commodity-serving companies, which have generally been<br />
poor investments since the early 1980s, deserve inves<strong>to</strong>rs’ capital in the coming decade?” Commodityserving<br />
companies generally perform best when commodity supply is tight and/or demand is strong, which<br />
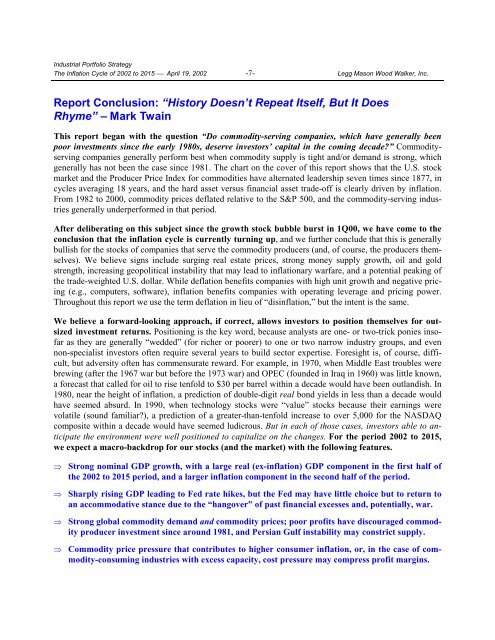
generally has not been the case since 1981. <strong>The</strong> chart on the cover <strong>of</strong> this report shows that the U.S. s<strong>to</strong>ck<br />
market and the Producer <strong>Price</strong> Index for commodities have alternated leadership seven times since 1877, in<br />
cycles averaging 18 years, and the hard asset versus financial asset trade-<strong>of</strong>f is clearly driven by inflation.<br />
From 1982 <strong>to</strong> 2000, commodity prices deflated relative <strong>to</strong> the S&P 500, and the commodity-serving industries<br />
generally underperformed in that period.<br />
After deliberating on this subject since the growth s<strong>to</strong>ck bubble burst in 1Q00, we have come <strong>to</strong> the<br />
conclusion that the inflation cycle is currently turning up, and we further conclude that this is generally<br />
bullish for the s<strong>to</strong>cks <strong>of</strong> companies that serve the commodity producers (and, <strong>of</strong> course, the producers themselves).<br />
We believe signs include surging real estate prices, strong money supply growth, oil and gold<br />
strength, increasing geopolitical instability that may lead <strong>to</strong> inflationary warfare, and a potential peaking <strong>of</strong><br />
the trade-weighted U.S. dollar. While deflation benefits companies with high unit growth and negative pricing<br />
(e.g., computers, s<strong>of</strong>tware), inflation benefits companies with operating leverage and pricing power.<br />
Throughout this report we use the term deflation in lieu <strong>of</strong> “disinflation,” but the intent is the same.<br />
We believe a forward-looking approach, if correct, allows inves<strong>to</strong>rs <strong>to</strong> position themselves for outsized<br />
investment returns. Positioning is the key word, because analysts are one- or two-trick ponies ins<strong>of</strong>ar<br />
as they are generally “wedded” (for richer or poorer) <strong>to</strong> one or two narrow industry groups, and even<br />
non-specialist inves<strong>to</strong>rs <strong>of</strong>ten require several years <strong>to</strong> build sec<strong>to</strong>r expertise. Foresight is, <strong>of</strong> course, difficult,<br />
but adversity <strong>of</strong>ten has commensurate reward. For example, in 1970, when Middle East troubles were<br />
brewing (after the 1967 war but before the 1973 war) and OPEC (founded in Iraq in 1960) was little known,<br />
a forecast that called for oil <strong>to</strong> rise tenfold <strong>to</strong> $30 per barrel within a decade would have been outlandish. In<br />
1980, near the height <strong>of</strong> inflation, a prediction <strong>of</strong> double-digit real bond yields in less than a decade would<br />
have seemed absurd. In 1990, when technology s<strong>to</strong>cks were “value” s<strong>to</strong>cks because their earnings were<br />
volatile (sound familiar?), a prediction <strong>of</strong> a greater-than-tenfold increase <strong>to</strong> over 5,000 for the NASDAQ<br />
composite within a decade would have seemed ludicrous. But in each <strong>of</strong> those cases, inves<strong>to</strong>rs able <strong>to</strong> anticipate<br />
the environment were well positioned <strong>to</strong> capitalize on the changes. For the period <strong>2002</strong> <strong>to</strong> <strong>2015</strong>,<br />
we expect a macro-backdrop for our s<strong>to</strong>cks (and the market) with the following features.<br />
<br />
<br />
<br />
<br />
Strong nominal GDP growth, with a large real (ex-inflation) GDP component in the first half <strong>of</strong><br />
the <strong>2002</strong> <strong>to</strong> <strong>2015</strong> period, and a larger inflation component in the second half <strong>of</strong> the period.<br />
Sharply rising GDP leading <strong>to</strong> Fed rate hikes, but the Fed may have little choice but <strong>to</strong> return <strong>to</strong><br />
an accommodative stance due <strong>to</strong> the “hangover” <strong>of</strong> past financial excesses and, potentially, war.<br />
Strong global commodity demand and commodity prices; poor pr<strong>of</strong>its have discouraged commodity<br />
producer investment since around 1981, and Persian Gulf instability may constrict supply.<br />
Commodity price pressure that contributes <strong>to</strong> higher consumer inflation, or, in the case <strong>of</strong> commodity-consuming<br />
industries with excess capacity, cost pressure may compress pr<strong>of</strong>it margins.


