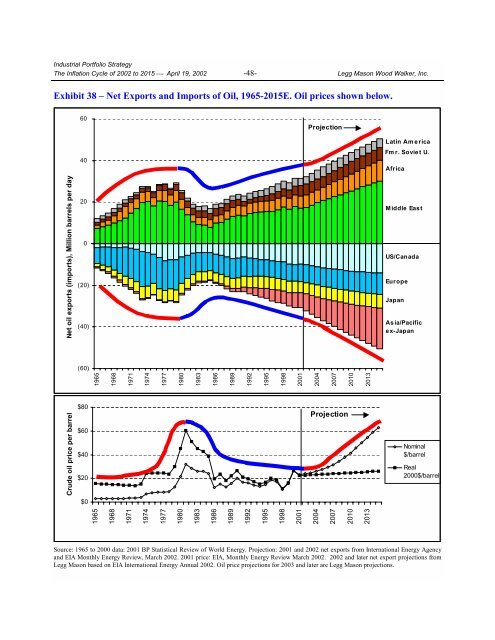
Industrial Portfolio Strategy <strong>The</strong> <strong>Inflation</strong> <strong>Cycle</strong> <strong>of</strong> <strong>2002</strong> <strong>to</strong> <strong>2015</strong> ⎯ April 19, <strong>2002</strong> -48- Legg Mason Wood Walker, Inc. Exhibit 38 – Net Exports and Imports <strong>of</strong> Oil, 1965-<strong>2015</strong>E. Oil prices shown below. 60 Projection Net oil exports (imports), Million barrels per day 40 20 0 (20) (40) Latin America Fm r. Sovie t U. Africa Middle East US/Canada Europe Japan Asia/Pacific ex-Japan (60) 1965 1968 1971 1974 1977 1980 1983 1986 Crude oil price per barrel 1989 1992 1995 1998 2001 2004 2007 2010 2013 $80 $60 $40 $20 $0 Projection Nominal $/barrel Real 2000$/barrel 1965 1968 1971 1974 1977 1980 1983 1986 1989 1992 1995 1998 2001 2004 2007 2010 2013 Source: 1965 <strong>to</strong> 2000 data: 2001 BP Statistical Review <strong>of</strong> World Energy. Projection: 2001 and <strong>2002</strong> net exports from International Energy Agency and EIA Monthly Energy Review, March <strong>2002</strong>. 2001 price: EIA, Monthly Energy Review March <strong>2002</strong>. <strong>2002</strong> and later net export projections from Legg Mason based on EIA International Energy Annual <strong>2002</strong>. Oil price projections for 2003 and later are Legg Mason projections.
Industrial Portfolio Strategy <strong>The</strong> <strong>Inflation</strong> <strong>Cycle</strong> <strong>of</strong> <strong>2002</strong> <strong>to</strong> <strong>2015</strong> ⎯ April 19, <strong>2002</strong> -49- Legg Mason Wood Walker, Inc. Substitute Fuels – Promising, But Enough <strong>to</strong> Make a Difference? We believe that the use <strong>of</strong> substitutes first requires an inflation in the “old” fuel <strong>to</strong> stimulate the switch. <strong>The</strong> world has migrated in patterns from solid fuels (wood, coal), <strong>to</strong> liquid fuels (kerosene, oil, gasoline) and then <strong>to</strong> gasses (natural gas, hydrogen fuel cells in the future). For now, however, crude oil is, in many ways, the ideal fuel, and the only catalyst we see for developing a new energy infrastructure and encouraging fuel switching is prolonged, high prices for crude oil, which fulfills our thesis, anyway. Crude oil has an energy density that is over 50% higher than high-grade coal and 1,000 times greater than natural gas at atmospheric pressure; it can be transported cheaply via tanker or pipeline; it can be refined in<strong>to</strong> a range <strong>of</strong> products from jet fuel <strong>to</strong> home heating oil <strong>to</strong> petrochemicals; when refined in<strong>to</strong> gasoline, it burns cleanly and just 90 pounds <strong>of</strong> gasoline can fuel a 3,000 pound vehicle for hundreds <strong>of</strong> miles; and most importantly, it is available in very large quantities. More than for other commodities such as food or metals, the demand for energy and petroleum by-products <strong>of</strong>ten expands <strong>to</strong> utilize available supply. As early as 1901, the oil gusher at Spindle<strong>to</strong>p, Texas, instantly doubled world oil supplies, and within a decade, au<strong>to</strong>s and trucks in the U.S. had soared from 8,000 vehicles fueled by a variety <strong>of</strong> fuels <strong>to</strong> a mass-produced, gasoline-powered fleet <strong>of</strong> 640,000 vehicles growing at over 40% per year. On the demand side <strong>of</strong> consumption, fuel switching is likely <strong>to</strong> occur, moving oil users away from low-value applications and more <strong>to</strong>ward high-value transportation uses. Low-value applications include power plants, industrial use <strong>of</strong> distillate and residual fuel oils, and residential/commercial use <strong>of</strong> distillate fuel. <strong>The</strong> U.S. has already made major strides in reducing low-value uses, but some developing markets are lagging behind. For example, U.S. non-transportation oil consumption went from 48% <strong>of</strong> <strong>to</strong>tal U.S. oil consumption in 1965 <strong>to</strong> 41% in 1981 and then <strong>to</strong> only 33% in 2000. Low-value oil consumption in the U.S. went from 23% <strong>of</strong> U.S. oil demand in 1965 <strong>to</strong> 18% in 1981 and then <strong>to</strong> only 10% in 2000. <strong>The</strong> rest <strong>of</strong> the world presents more opportunities for replacing oil with other fuels such as coal or natural gas in lowvalue applications. In 1999, global oil consumption in low-value applications was 25% <strong>of</strong> <strong>to</strong>tal petroleum demand, representing substantial “low-hanging fruit” if high oil prices force all nations <strong>to</strong> use oil more efficiently. And on the supply side, we do see the door opening for a host <strong>of</strong> energy supply alternatives, but they face a chicken and egg conundrum. <strong>The</strong> modern petroleum market has a highly efficient system <strong>of</strong> delivering around 76 million barrels <strong>of</strong> oil <strong>to</strong> consumers around the world every day, so even those crude oil substitutes that are able <strong>to</strong> prove some cost or performance advantage must reckon with the fact that a new retail distribution infrastructure will require many years <strong>to</strong> develop fully, and the development <strong>of</strong> that infrastructure will not come, in our view, unless crude oil prices are high for a similar period. Still, there are promising alternatives, such as liquefied natural gas (LNG) and the oil sands <strong>of</strong> Canada. <strong>The</strong> growing use <strong>of</strong> LNG solves two problems: what <strong>to</strong> do with excess natural gas in oil-producing regions with low domestic energy demand needs, and how <strong>to</strong> expand fuel consumption in areas with little native fossil fuel resources, such as Japan and China. LNG is natural gas that has been liquefied through pressurization and cooling <strong>to</strong> low temperatures in a liquefaction plant located close <strong>to</strong> a natural gas source. <strong>The</strong> liquefied gas is loaded on<strong>to</strong> a special double-hulled refrigerated tanker, transported across the water <strong>to</strong> an unloading terminal, and converted back <strong>to</strong> gaseous form in a regasification plant. <strong>The</strong> process is energyintensive and capital-intensive, but LNG provides a supply option that bypasses the use <strong>of</strong> gas pipelines, which may be impractical (e.g., distance) or nearly impossible (e.g., distant islands). Depending on the gas production cost and the distance between source and destination, <strong>to</strong>tal costs <strong>of</strong> natural gas via LNG range from about $2.50 <strong>to</strong> $4.00 per million Btu (MMBtu), making it very competitive with natural gas supplied via pipelines. For comparison purposes, the average U.S. city gate natural gas price in 1999 was $3.01/