GHA-Report-2010.pdf - Global Humanitarian Assistance
GHA-Report-2010.pdf - Global Humanitarian Assistance
GHA-Report-2010.pdf - Global Humanitarian Assistance

You also want an ePaper? Increase the reach of your titles
YUMPU automatically turns print PDFs into web optimized ePapers that Google loves.
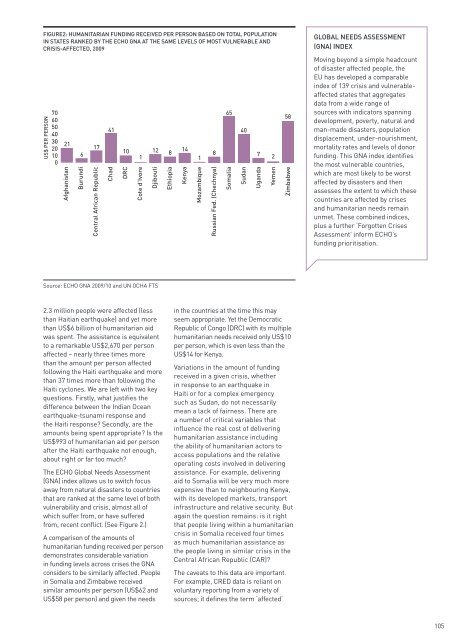
FIGURE2: HUMANITARIAN FUNDING RECEIVED PER PERSON BASED ON TOTAL POPULATION<br />
IN STATES RANKED BY THE ECHO GNA AT THE SAME LEVELS OF MOST VULNERABLE AND<br />
CRISIS-AFFECTED, 2009<br />
US$ PER PERSON<br />
70<br />
60<br />
50<br />
40<br />
30<br />
20<br />
10<br />
0<br />
21<br />
Afghanistan<br />
6<br />
Burundi<br />
17<br />
Central African Republic<br />
41<br />
Chad<br />
10<br />
DRC<br />
1<br />
Cote d’Ivore<br />
12 8<br />
Djibouti<br />
Ethiopia<br />
14<br />
Kenya<br />
1<br />
Mozambique<br />
8<br />
Russian Fed. (Chechnya)<br />
65<br />
Somalia<br />
40<br />
Sudan<br />
7 2<br />
Uganda<br />
Yemen<br />
58<br />
Zimbabwe<br />
GLOBAL NEEDS ASSESSMENT<br />
(GNA) INDEX<br />
Moving beyond a simple headcount<br />
of disaster affected people, the<br />
EU has developed a comparable<br />
index of 139 crisis and vulnerableaffected<br />
states that aggregates<br />
data from a wide range of<br />
sources with indicators spanning<br />
development, poverty, natural and<br />
man-made disasters, population<br />
displacement, under-nourishment,<br />
mortality rates and levels of donor<br />
funding. This GNA index identifies<br />
the most vulnerable countries,<br />
which are most likely to be worst<br />
affected by disasters and then<br />
assesses the extent to which these<br />
countries are affected by crises<br />
and humanitarian needs remain<br />
unmet. These combined indices,<br />
plus a further ‘Forgotten Crises<br />
Assessment’ inform ECHO’s<br />
funding prioritisation.<br />
Source: ECHO GNA 2009/10 and UN OCHA FTS<br />
2.3 million people were affected (less<br />
than Haitian earthquake) and yet more<br />
than US$6 billion of humanitarian aid<br />
was spent. The assistance is equivalent<br />
to a remarkable US$2,670 per person<br />
affected – nearly three times more<br />
than the amount per person affected<br />
following the Haiti earthquake and more<br />
than 37 times more than following the<br />
Haiti cyclones. We are left with two key<br />
questions. Firstly, what justifies the<br />
difference between the Indian Ocean<br />
earthquake-tsunami response and<br />
the Haiti response? Secondly, are the<br />
amounts being spent appropriate? Is the<br />
US$993 of humanitarian aid per person<br />
after the Haiti earthquake not enough,<br />
about right or far too much?<br />
The ECHO <strong>Global</strong> Needs Assessment<br />
(GNA) index allows us to switch focus<br />
away from natural disasters to countries<br />
that are ranked at the same level of both<br />
vulnerability and crisis, almost all of<br />
which suffer from, or have suffered<br />
from, recent conflict. (See Figure 2.)<br />
A comparison of the amounts of<br />
humanitarian funding received per person<br />
demonstrates considerable variation<br />
in funding levels across crises the GNA<br />
considers to be similarly affected. People<br />
in Somalia and Zimbabwe received<br />
similar amounts per person (US$62 and<br />
US$58 per person) and given the needs<br />
in the countries at the time this may<br />
seem appropriate. Yet the Democratic<br />
Republic of Congo (DRC) with its multiple<br />
humanitarian needs received only US$10<br />
per person, which is even less than the<br />
US$14 for Kenya.<br />
Variations in the amount of funding<br />
received in a given crisis, whether<br />
in response to an earthquake in<br />
Haiti or for a complex emergency<br />
such as Sudan, do not necessarily<br />
mean a lack of fairness. There are<br />
a number of critical variables that<br />
influence the real cost of delivering<br />
humanitarian assistance including<br />
the ability of humanitarian actors to<br />
access populations and the relative<br />
operating costs involved in delivering<br />
assistance. For example, delivering<br />
aid to Somalia will be very much more<br />
expensive than to neighbouring Kenya,<br />
with its developed markets, transport<br />
infrastructure and relative security. But<br />
again the question remains: is it right<br />
that people living within a humanitarian<br />
crisis in Somalia received four times<br />
as much humanitarian assistance as<br />
the people living in similar crisis in the<br />
Central African Republic (CAR)?<br />
The caveats to this data are important.<br />
For example, CRED data is reliant on<br />
voluntary reporting from a variety of<br />
sources; it defines the term ‘affected’<br />
105