GHA-Report-2010.pdf - Global Humanitarian Assistance
GHA-Report-2010.pdf - Global Humanitarian Assistance
GHA-Report-2010.pdf - Global Humanitarian Assistance

Create successful ePaper yourself
Turn your PDF publications into a flip-book with our unique Google optimized e-Paper software.
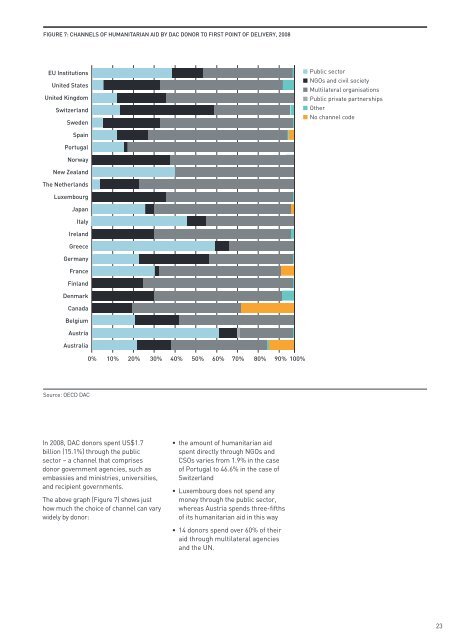
FIGURE 7: CHANNELS OF HUMANITARIAN AID BY DAC DONOR TO FIRST POINT OF DELIVERY, 2008<br />
EU Institutions<br />
United States<br />
United Kingdom<br />
Switzerland<br />
Sweden<br />
Public sector<br />
NGOs and civil society<br />
Multilateral organisations<br />
Public private partnerships<br />
Other<br />
No channel code<br />
Spain<br />
Portugal<br />
Norway<br />
New Zealand<br />
The Netherlands<br />
Luxembourg<br />
Japan<br />
Italy<br />
Ireland<br />
Greece<br />
Germany<br />
France<br />
Finland<br />
Denmark<br />
Canada<br />
Belgium<br />
Austria<br />
Australia<br />
0% 10% 20% 30% 40% 50% 60% 70% 80% 90% 100%<br />
Source: OECD DAC<br />
In 2008, DAC donors spent US$1.7<br />
billion (15.1%) through the public<br />
sector – a channel that comprises<br />
donor government agencies, such as<br />
embassies and ministries, universities,<br />
and recipient governments.<br />
The above graph (Figure 7) shows just<br />
how much the choice of channel can vary<br />
widely by donor:<br />
• the amount of humanitarian aid<br />
spent directly through NGOs and<br />
CSOs varies from 1.9% in the case<br />
of Portugal to 46.6% in the case of<br />
Switzerland<br />
• Luxembourg does not spend any<br />
money through the public sector,<br />
whereas Austria spends three-fifths<br />
of its humanitarian aid in this way<br />
• 14 donors spend over 60% of their<br />
aid through multilateral agencies<br />
and the UN.<br />
23