GHA-Report-2010.pdf - Global Humanitarian Assistance
GHA-Report-2010.pdf - Global Humanitarian Assistance
GHA-Report-2010.pdf - Global Humanitarian Assistance

Create successful ePaper yourself
Turn your PDF publications into a flip-book with our unique Google optimized e-Paper software.
GOVERNMENT DONOR PRIORITIES, PATTERNS<br />
AND PROCESSES COMPARED<br />
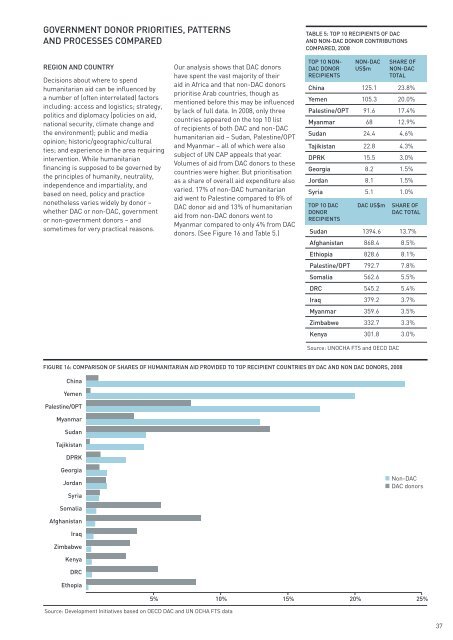
TABLE 5: TOP 10 RECIPIENTS OF DAC<br />
AND NON-DAC DONOR CONTRIBUTIONS<br />
COMPARED, 2008<br />
REGION AND COUNTRY<br />
Decisions about where to spend<br />
humanitarian aid can be influenced by<br />
a number of (often interrelated) factors<br />
including: access and logistics; strategy,<br />
politics and diplomacy (policies on aid,<br />
national security, climate change and<br />
the environment); public and media<br />
opinion; historic/geographic/cultural<br />
ties; and experience in the area requiring<br />
intervention. While humanitarian<br />
financing is supposed to be governed by<br />
the principles of humanity, neutrality,<br />
independence and impartiality, and<br />
based on need, policy and practice<br />
nonetheless varies widely by donor –<br />
whether DAC or non-DAC, government<br />
or non-government donors – and<br />
sometimes for very practical reasons.<br />
Our analysis shows that DAC donors<br />
have spent the vast majority of their<br />
aid in Africa and that non-DAC donors<br />
prioritise Arab countries, though as<br />
mentioned before this may be influenced<br />
by lack of full data. In 2008, only three<br />
countries appeared on the top 10 list<br />
of recipients of both DAC and non-DAC<br />
humanitarian aid – Sudan, Palestine/OPT<br />
and Myanmar – all of which were also<br />
subject of UN CAP appeals that year.<br />
Volumes of aid from DAC donors to these<br />
countries were higher. But prioritisation<br />
as a share of overall aid expenditure also<br />
varied. 17% of non-DAC humanitarian<br />
aid went to Palestine compared to 8% of<br />
DAC donor aid and 13% of humanitarian<br />
aid from non-DAC donors went to<br />
Myanmar compared to only 4% from DAC<br />
donors. (See Figure 16 and Table 5.)<br />
TOP 10 NON-<br />
DAC DONOR<br />
RECIPIENTS<br />
NON-DAC<br />
US$m<br />
SHARE OF<br />
NON-DAC<br />
TOTAL<br />
China 125.1 23.8%<br />
Yemen 105.3 20.0%<br />
Palestine/OPT 91.6 17.4%<br />
Myanmar 68 12.9%<br />
Sudan 24.4 4.6%<br />
Tajikistan 22.8 4.3%<br />
DPRK 15.5 3.0%<br />
Georgia 8.2 1.5%<br />
Jordan 8.1 1.5%<br />
Syria 5.1 1.0%<br />
TOP 10 DAC<br />
DONOR<br />
RECIPIENTS<br />
DAC US$m<br />
SHARE OF<br />
DAC TOTAL<br />
Sudan 1394.6 13.7%<br />
Afghanistan 868.4 8.5%<br />
Ethiopia 828.6 8.1%<br />
Palestine/OPT 792.7 7.8%<br />
Somalia 562.6 5.5%<br />
DRC 545.2 5.4%<br />
Iraq 379.2 3.7%<br />
Myanmar 359.6 3.5%<br />
Zimbabwe 332.7 3.3%<br />
Kenya 301.8 3.0%<br />
Source: UNOCHA FTS and OECD DAC<br />
FIGURE 16: COMPARISON OF SHARES OF HUMANITARIAN AID PROVIDED TO TOP RECIPIENT COUNTRIES BY DAC AND NON DAC DONORS, 2008<br />
China<br />
Yemen<br />
Palestine/OPT<br />
Myanmar<br />
Sudan<br />
Tajikistan<br />
DPRK<br />
Georgia<br />
Jordan<br />
Syria<br />
Non-DAC<br />
DAC donors<br />
Somalia<br />
Afghanistan<br />
Iraq<br />
Zimbabwe<br />
Kenya<br />
DRC<br />
Ethopia<br />
Source: Development Initiatives based on OECD DAC and UN OCHA FTS data<br />
5% 10% 15% 20% 25%<br />
37