GHA-Report-2010.pdf - Global Humanitarian Assistance
GHA-Report-2010.pdf - Global Humanitarian Assistance
GHA-Report-2010.pdf - Global Humanitarian Assistance

Create successful ePaper yourself
Turn your PDF publications into a flip-book with our unique Google optimized e-Paper software.
SUPPORT FOR UN PROCESSES<br />
AND FINANCING MECHANISMS<br />
SUPPORT FOR MULTILATERAL CHANNELS<br />
Traditionally, non-DAC donors have<br />
channelled a larger proportion of<br />
humanitarian aid bilaterally to the<br />
affected recipient governments whereas<br />
in contrast, DAC donors have favoured<br />
multilateral channels. In 2008 just<br />
3% of DAC humanitarian aid was<br />
channelled bilaterally compared 30.8%<br />
of non-DAC donor humanitarian aid.<br />
Whilst the proportion of non-DAC donor<br />
humanitarian contributions directed to<br />
recipient governments is higher than<br />
DAC contributions, recent trends show<br />
that traditional non-DAC donor patterns<br />
of channelling humanitarian aid seem<br />
to be changing. For example, in 2009<br />
non-DAC donor bilateral contributions<br />
dropped from 30.8% to 7.3% and<br />
contributions through UN multilateral<br />
organisations rose from 51.6% to 83.6%.<br />
The evidence suggests this may not be<br />
a complete change in delivery priorities.<br />
UN appeals for Pakistan, Palestine/OPT<br />
and Afghanistan – all priorites for non-<br />
DAC donors – may have promoted more<br />
funding through UN channels.<br />
SUPPORT FOR FINANCING MECHANISMS<br />
Government donors make significant<br />
contributions to pooled funding<br />
mechanisms. In 2008:<br />
• of total government donor<br />
humanitarian contributions (US$12.8<br />
billion), 6.8% (US$851 million) was<br />
channelled to humanitarian pooled<br />
funds (CERF, ERF, and CHF)<br />
• the majority of this funding was from<br />
DAC donors (US$845 million, 97.4%)<br />
• government donors gave U$452.3<br />
million to the CERF (99.8%<br />
of the total) of which US$446.5<br />
million (98.5%) was from DAC<br />
donors and US$5.8 million (1.3%)<br />
from non-DAC donors<br />
• the largest DAC donor to pooled funds<br />
(CERF, ERFs and CHFs) was the UK<br />
with US$255 million; the highest<br />
non-DAC contributor was Korea<br />
with US$2 million.<br />
SUPPORT FOR THE CONSOLIDATED<br />
APPEALS PROCESS (CAP)<br />
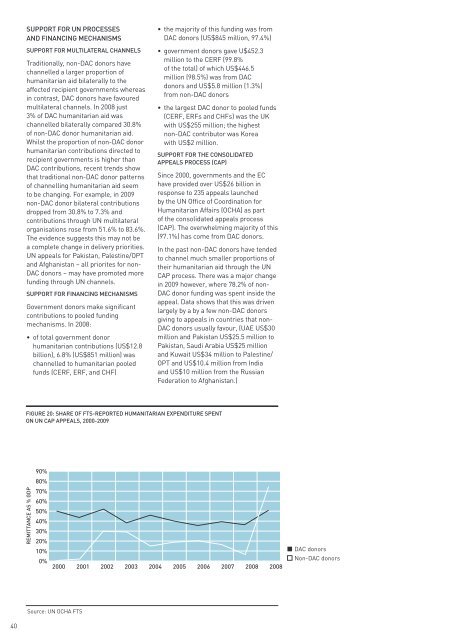
Since 2000, governments and the EC<br />
have provided over US$26 billion in<br />
response to 235 appeals launched<br />
by the UN Office of Coordination for<br />
<strong>Humanitarian</strong> Affairs (OCHA) as part<br />
of the consolidated appeals process<br />
(CAP). The overwhelming majority of this<br />
(97.1%) has come from DAC donors.<br />
In the past non-DAC donors have tended<br />
to channel much smaller proportions of<br />
their humanitarian aid through the UN<br />
CAP process. There was a major change<br />
in 2009 however, where 78.2% of non-<br />
DAC donor funding was spent inside the<br />
appeal. Data shows that this was driven<br />
largely by a by a few non-DAC donors<br />
giving to appeals in countries that non-<br />
DAC donors usually favour, (UAE US$30<br />
million and Pakistan US$25.5 million to<br />
Pakistan, Saudi Arabia US$25 million<br />
and Kuwait US$34 million to Palestine/<br />
OPT and US$10.4 million from India<br />
and US$10 million from the Russian<br />
Federation to Afghanistan.)<br />
FIGURE 20: SHARE OF FTS-REPORTED HUMANITARIAN EXPENDITURE SPENT<br />
ON UN CAP APPEALS, 2000-2009<br />
REMITTANCE AS % GDP<br />
90%<br />
80%<br />
70%<br />
60%<br />
50%<br />
40%<br />
30%<br />
20%<br />
10%<br />
0%<br />
2000<br />
2001 2002 2003 2004 2005 2006 2007 2008 2008<br />
DAC donors<br />
Non-DAC donors<br />
Source: UN OCHA FTS<br />
40