Implementing LDI with swaptions - Russell Investments
Implementing LDI with swaptions - Russell Investments
Implementing LDI with swaptions - Russell Investments

Create successful ePaper yourself
Turn your PDF publications into a flip-book with our unique Google optimized e-Paper software.
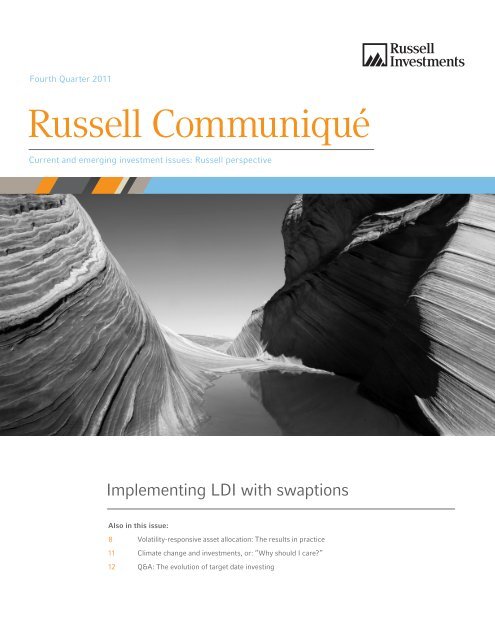
Fourth Quarter 2011<br />
<strong>Russell</strong> Communiqué<br />
Current and emerging investment issues: <strong>Russell</strong> perspective<br />
<strong>Implementing</strong> <strong>LDI</strong> <strong>with</strong> <strong>swaptions</strong><br />
Also in this issue:<br />
8 Volatility-responsive asset allocation: The results in practice<br />
11 Climate change and investments, or: “Why should I care?”<br />
12 Q&A: The evolution of target date investing
EXECUTIVE VIEW<br />
3 Dealing <strong>with</strong> change:<br />
Applying the lessons of a thousand clichés<br />
By: Bob Collie, FIA, Chief Research Strategist, Americas Institutional<br />
INVESTMENT FOCUS<br />
4 <strong>Implementing</strong> <strong>LDI</strong> <strong>with</strong> <strong>swaptions</strong><br />
By: Lisa Cavallari, Director, Fixed Income Derivatives, and<br />
Martin Jaugietis, CFA, Head of <strong>LDI</strong> Solutions<br />
As the popularity of liability-driven investing (<strong>LDI</strong>) continues to increase, so does<br />
the number of ways to implement an <strong>LDI</strong> program. This article discusses one such<br />
instrument: an option on interest rate swaps, generally referred to as a “swaption.”<br />
It also describes how <strong>swaptions</strong> can fit especially well into a program designed to<br />
reduce risk in accordance <strong>with</strong> a liability-responsive asset allocation (LRAA) schedule.<br />
CLIENT FOCUS<br />
8 Volatility-responsive asset allocation:<br />
The results in practice<br />
By: Bob Collie, FIA, Chief Research Strategist; Mike Sylvanus, Senior Investment Strategist; and<br />
Michael Thomas, CFA, Head of Consulting and Chief Investment Officer<br />
In last quarter’s Communiqué, Mike Thomas explained how volatility is itself variable<br />
over time and how an investment policy that responds to those variations might<br />
be designed. How would such policy perform? And what impact would following<br />
a volatility-responsive asset allocation strategy have on risk and returns?<br />
OPINION<br />
11 Climate change and investments, or: “Why should I care?”<br />
By: Greg Liddell, Managing Director, Consulting & Advisory Services—Australasia<br />
Few issues have generated more skepticism than the subject of climate<br />
change. In this article, Greg Liddell outlines why it matters to fiduciaries.<br />
Q&A<br />
12 The evolution of target date investing<br />
With Josh Cohen, Defined Contribution Practice Leader<br />
In this brief interview, Josh Cohen discusses developments and trends<br />
in target date investing.<br />
GREAT MOMENTS IN FINANCIAL HISTORY<br />
14 The opening of the Lions Gate<br />
By: Aran Murphy, Product Strategist<br />
<strong>Russell</strong> <strong>Investments</strong> // <strong>Russell</strong> Communiqué p / 2
EXECUTIVE VIEW<br />
Dealing <strong>with</strong> change: Applying<br />
the lessons of a thousand clichés<br />
Dear Readers,<br />
Like it or loathe it, there’s no avoiding change. We are, of course, supposed to embrace it,<br />
to never stop learning, and to apply lots of other advice that has unfortunately lost its luster<br />
through overuse and passed into the realm of cliché—which doesn’t make it bad advice. So,<br />
although it wins us no points for the originality of the theme, change is the thread that runs<br />
through this issue of Communiqué.<br />
Change comes in many forms. We are slowest to accept change when it challenges our old<br />
way of seeing the world, when it calls into question long-held opinions or practices that have<br />
become part of our fabric. For example, for many years institutional investors saw strategic<br />
asset allocation as fixed asset allocation, but it doesn’t have to be. One of the biggest themes<br />
in our work <strong>with</strong> institutional investors over the past couple of years has been a much more<br />
dynamic approach to asset allocation—all the while retaining the discipline and long-term<br />
perspective that distinguish the strategic from the tactical. The catalyst that made this change<br />
possible was liability-responsive asset allocation: a dynamic—but strategic—approach that<br />
opened the door to the possibility of other forms of dynamic strategic allocation.<br />
In this issue, we pick up the theme of volatility-responsive asset allocation that was introduced<br />
in last quarter’s Communiqué and look at the evidence that adjusting asset allocation in<br />
response to market volatility can help in the management of risk. Lisa Cavallari and Marty<br />
Jaugietis take a look at <strong>swaptions</strong>, an emerging tool for <strong>LDI</strong> managers, describing how these<br />
instruments work and how they can help manage interest rate exposure for defined benefit<br />
plans. Our Q&A column turns to the world of defined contribution and looks at how target<br />
date funds (TDFs) are already changing as the first generation of TDF products is replaced<br />
by a more flexible design approach. This quarter’s Opinion article looks at another type of<br />
change—climate change—as Greg Liddell argues the case for why investors need to pay<br />
more attention than they do.<br />
Thank you for reading,<br />
Bob Collie<br />
Bob Collie,<br />
Chief Research Strategist, Americas Institutional<br />
p / 3
STRATEGY TIMING IMPLEMENTATION<br />
INVESTMENT FOCUS<br />
<strong>Implementing</strong> <strong>LDI</strong><br />
<strong>with</strong> <strong>swaptions</strong><br />
By: Lisa Cavallari, Director, Fixed Income Derivatives, and Martin Jaugietis, CFA, Head of <strong>LDI</strong> Solutions<br />
Lisa Cavallari<br />
Martin Jaugietis<br />
1<br />
For more details of the<br />
swaption market, see<br />
Tom Fletcher (2011),<br />
“Conditional interest<br />
rate trades when the<br />
yield curve is steep:<br />
development of the<br />
case for swaption use,”<br />
<strong>Russell</strong> <strong>Investments</strong>.<br />
With the increased adoption of liability-driven investing (<strong>LDI</strong>) by corporate<br />
defined benefit (DB) pension plans, the range of instruments available to<br />
help implement <strong>LDI</strong> programs has widened. One of these instruments is an<br />
option on interest rate swaps, generally referred to as a “swaption,” which<br />
can fit especially well into a program designed to reduce risk in accordance<br />
<strong>with</strong> a liability-responsive asset allocation (LRAA) schedule.<br />
Available instruments for implementation of an <strong>LDI</strong> program include Treasury bonds;<br />
corporate and other non-government bonds; exchange-traded derivatives, such as interest<br />
rate futures and options; and over-the-counter (OTC) instruments, such as swaps and options<br />
on swaps. It is the OTC market and, in particular, options on interest rate swaps (“<strong>swaptions</strong>”)<br />
that we will examine in this article.<br />
What is a swaption?<br />
An interest rate swap is, as the name suggests, an exchange of one interest rate for another.<br />
For example, one investor might agree to pay another a fixed rate for 10 years (the fixed rate<br />
being determined by the current market level of interest rates) and in return receive a floating<br />
rate (the floating rate being determined by a market rate such as the London Interbank Offer<br />
Rate, or LIBOR). The effect is similar to that of an investor’s selling a 10-year bond and holding<br />
cash. Because the terms of the swap are based on current market rates, no money needs to<br />
change hands at the outset; the value of the obligation to pay one interest rate and the right<br />
to receive the other are equal at the outset, although that will change once the terms are<br />
established and as market prices then move over time.<br />
A swaption is an option to enter into a swap trade. 1 A “3y10y” swaption is the right to enter into<br />
a 10-year swap trade in three years, based on terms that are set today. An example: suppose<br />
you buy a receiver swaption, i.e., an option to receive a fixed rate and pay a floating rate for<br />
10 years starting in three years. Fast-forward three years: if the terms that are available on the<br />
10-year swap at that time are better than those in the swaption, then you will not exercise the<br />
option. If the terms in the swaption are better, then you will exercise it. As <strong>with</strong> all options, you<br />
are in a good position if you are the holder of the option; if you like the deal at the exercise date,<br />
you win—if you don’t like the deal, you don’t lose. And, as <strong>with</strong> all options, that good position<br />
comes at a price: a premium has to be paid at the outset to buy the option.<br />
Swaptions and LRAA<br />
What makes <strong>swaptions</strong> intriguing in an <strong>LDI</strong> context is their conditionality, as well as their<br />
potential interaction <strong>with</strong> an LRAA schedule.<br />
<strong>Russell</strong> <strong>Investments</strong> // <strong>Russell</strong> Communiqué p / 4
RUSSELL INVESTMENTS<br />
In today’s low interest rate environment,<br />
many plan sponsors have been reluctant<br />
to fully eliminate the interest rate risk<br />
in their plans but have preferred a more<br />
incremental approach to <strong>LDI</strong>. In this sense,<br />
one application of LRAA is to increase<br />
the duration of a plan’s fixed income<br />
investments incrementally as the allocation<br />
to fixed income increases overall. 2 While this<br />
approach has some merit, the unfortunate<br />
outcome for most plans in the very early<br />
stages of their LRAA and/or <strong>LDI</strong> programs<br />
has been that they remain in very shortduration<br />
positions vis-à-vis liabilities, and<br />
funding levels have suffered in the recent<br />
declining interest rate environment.<br />
The ultimate goal in an <strong>LDI</strong> portfolio is to<br />
increase the duration exposure of fixed<br />
income investments, and we know that<br />
plan sponsors want protection against<br />
declining interest rates. One version of a<br />
swaption trade—the “zero-cost collar,”<br />
discussed below—provides this type of<br />
exposure by offering protection against<br />
declining interest rates in exchange for the<br />
promise to enter a swap at a certain interest<br />
rate above current rates. While there are<br />
many moving parts in this version, these<br />
higher rates can potentially be aligned at<br />
levels along the LRAA schedule, where<br />
the plan sponsor would be increasing the<br />
duration exposure of the fixed income<br />
portfolio in any case.<br />
An example of a swaption trade:<br />
the zero-cost collar<br />
The swaption trade we describe below is<br />
based on buying a receiver swaption at a<br />
low interest rate (to offer the protection<br />
we’d like to have, should rates fall) matched<br />
by selling a payer swaption 3 at a higher<br />
rate (the rate at which we are likely to be<br />
seeking longer-duration exposure anyway).<br />
For convenience, the terms of the two deals<br />
can be chosen such that the premium paid<br />
for buying the protection of the receiver<br />
swaption is equal to the premium collected<br />
for selling the payer swaption.<br />
Exhibit 1: Rates<br />
Swap curve date 8/30/2011<br />
10y (spot) 2.36<br />
3y10y (forward) 3.41<br />
Source: Bloomberg<br />
Exhibit 2: Strategies<br />
Strategy<br />
Zero-cost<br />
swaption<br />
collar<br />
Payer<br />
strike<br />
Receiver<br />
strike<br />
A 3y10y+50 3.91 3.04<br />
B 3y10y+100 4.41 2.70<br />
C 3y10y+150 4.91 2.38<br />
D 3y10y+200 5.41 2.10<br />
Source: Bloomberg<br />
The interest rates associated <strong>with</strong> such<br />
a trade, as of August 30, 2011, are shown<br />
in Exhibit 1. At that date, the at-themoney-forward<br />
(ATMF) rate was 3.41% 4 .<br />
In Exhibit 2, the payer swaption strikes<br />
at 50-basis-points-higher increments are<br />
3.91%, 4.41%, 4.91% and 5.41%. The<br />
strike shown for the receiver swaption is<br />
in each case the strike that results in an<br />
equal premium for the two <strong>swaptions</strong> (i.e.<br />
creating a zero-cost collar).<br />
In Exhibit 3, we illustrate the effect of<br />
these strategies by looking at the impact<br />
of interest rate shock at option expiration<br />
on an example plan that is 80% funded.<br />
The first thing we note is that all of the<br />
swaption strategies reduce the impact of<br />
interest rate variation on the funded status<br />
of the plan. This should not be a surprise:<br />
in each example strategy there is a built-in<br />
exposure to interest rates, so it becomes a<br />
de-risking strategy for any DB plan whose<br />
liabilities are driven by interest rates.<br />
2<br />
For a description of this<br />
strategy, see Jim Gannon<br />
& Bob Collie (2009),<br />
“Liability-Responsive<br />
Asset Allocation,” <strong>Russell</strong><br />
Viewpoint.<br />
3<br />
A payer swaption being<br />
the right to pay the fixed<br />
rate and receive the<br />
floating.<br />
4<br />
This can be thought of<br />
as the 10-year swap rate<br />
which current pricing<br />
implies the market expects<br />
in three years’ time.<br />
p / 5
INVESTMENT FOCUS (continued)<br />
Exhibit 3: Strategies’ impact on funded status<br />
120%<br />
115%<br />
110%<br />
105%<br />
Funded status<br />
100%<br />
95%<br />
90%<br />
85%<br />
80%<br />
75%<br />
70%<br />
-200 0 100 200 300 400<br />
Spot swap curve changes (basis points)<br />
Original Strategy A Strategy B Strategy C Strategy D<br />
5<br />
For an expansion of<br />
this point, see Michael<br />
Thomas and Greg<br />
Nordquist (2011),<br />
“Interest rate <strong>swaptions</strong>—<br />
downside protection you<br />
can live <strong>with</strong>,” <strong>Russell</strong><br />
Research.<br />
Next we note that in the event of a fall in<br />
rates, we do get the downside protection we<br />
would like. Indeed, because the yield curve<br />
is currently steep, we get protection not just<br />
against rates going down, but also against<br />
rates not going up by as much as expected<br />
due to some of the receiver strikes being<br />
above the current 10-year spot rate. With so<br />
much talk of downside protection strategies<br />
being focused on falls in equity markets, it<br />
is easy to forget that downside protection<br />
on the liability side of a DB plan’s balance<br />
sheet can offer better value than downside<br />
protection on the asset side.<br />
Over time, the impact of the strategies<br />
becomes different. At the three-year horizon<br />
(the point at which the options will either<br />
be exercised or not exercised), rates might<br />
be low enough that the receiver swaption is<br />
exercised; they might be high enough that<br />
the payer swaption is exercised; or they<br />
might fall into the range between (in which<br />
case, nothing happens).<br />
As already mentioned, if rates are low, then<br />
the strategy pays off, reducing the negative<br />
effect that the fall in rates has on the plan’s<br />
funded status. If rates are high, funded<br />
status has improved, but the strategy<br />
results in a loss (this is the price that is paid<br />
for the downside protection). If either option<br />
is exercised, then the plan finds itself <strong>with</strong><br />
an increased exposure to interest rates: this<br />
is the previously mentioned tie-in to LRAA<br />
in the case of a rise in rates.<br />
Variation in attractiveness of pricing<br />
In general, protection for investors is<br />
expensive. The price that must be paid for<br />
downside protection is often significant.<br />
Pricing does, however, vary over time.<br />
In the case of the interest rate swaption<br />
<strong>Russell</strong> <strong>Investments</strong> // <strong>Russell</strong> Communiqué p / 6
RUSSELL INVESTMENTS<br />
trade, there are times when market supply<br />
and demand can act in favor of DB plans. 5<br />
Versus historical levels, <strong>swaptions</strong>’ current<br />
levels may be attractive enough to warrant<br />
consideration. 6 Indeed, the consensus<br />
(due to sovereign risk concerns, debt<br />
downgrades, inflation concerns or other<br />
reasons) has been that interest rates will<br />
rise, so most investors have been seeking<br />
protection against this scenario. Pension<br />
plans, on the other hand, which seek<br />
protection from falling interest rates, appear<br />
very much in the minority on the demand<br />
versus supply ledger. The purchase of such<br />
protection is therefore currently (at time<br />
of this writing) cheaper than it has been<br />
historically. Investors should keep in mind<br />
the variability of pricing over time—the<br />
strategy we have described here makes a<br />
lot more sense in certain circumstances than<br />
it does in others.<br />
Conclusion: another instrument<br />
in the <strong>LDI</strong> toolbox<br />
We have seen that <strong>swaptions</strong> can help<br />
to reduce the exposure of a DB plan to<br />
variations in interest rates and thus form<br />
part of an <strong>LDI</strong> program, and that the<br />
conditionality built into <strong>swaptions</strong> can<br />
mirror the design of an LRAA strategy.<br />
On the plus side, <strong>swaptions</strong> offer downside<br />
protection in the case of declines in interest<br />
rates, <strong>with</strong> the price being paid by a cap on<br />
potential gains if rates rise significantly. That<br />
price, however, appears consistent <strong>with</strong> the<br />
directional trend to de-risk as a plan’s funded<br />
status improves. Finally, the attractiveness<br />
of the pricing of these instruments can vary<br />
significantly over time, so there is always a<br />
timing judgment that needs to be exercised<br />
when choosing <strong>swaptions</strong>.<br />
The authors wish<br />
to thank Jim<br />
Simonson for his<br />
excellent research<br />
assistance.<br />
Additional research on liability-driven investing<br />
You can access the following <strong>Russell</strong> research papers on <strong>Russell</strong>.com/institutional<br />
or via ClientLINK at https://clientlink.russell.com:<br />
››<br />
“Positioning <strong>LDI</strong> portfolios in today’s volatile market conditions” by Martin<br />
Jaugietis and Bob Collie<br />
››<br />
“Transitioning to <strong>LDI</strong> strategies” by Travis Bagley and Aran Murphy<br />
››<br />
“<strong>LDI</strong>’s role in pension plan strategy: Risk and return considerations” by Bob<br />
Collie and John Osborn<br />
››<br />
“Liability-responsive asset allocation” by James Gannon and Bob Collie<br />
››<br />
“Does equity have duration? And if so, is it useful for <strong>LDI</strong>?” by James Gannon<br />
6<br />
Based on market prices as<br />
of September 15, 2011.<br />
p / 7
STRATEGY TIMING IMPLEMENTATION<br />
CLIENT FOCUS<br />
Volatility-responsive asset<br />
allocation: The results in practice<br />
By: Bob Collie, FIA, Chief Research Strategist, Mike Sylvanus, Senior Investment Strategist, and<br />
Michael Thomas, CFA, Head of Consulting and Chief Investment Officer<br />
Bob Collie<br />
In last quarter’s issue of Communiqué, Mike Thomas explained how volatility<br />
is itself variable over time and how an investment policy might be designed<br />
that responds to those variations. This quarter we look at how such a policy<br />
would have performed—at the impact on the risk and returns of following a<br />
volatility-responsive strategy.<br />
Mike Sylvanus<br />
Michael Thomas<br />
Reducing volatility and improving the risk/return trade-off<br />
The principle that underpins volatility-responsive asset allocation is to reduce exposure to<br />
risky assets when volatility is high, and to increase that exposure when volatility is low.<br />
Volatility is an appealing foundation for a dynamic strategy because, unlike the outlook for<br />
returns (which are notoriously difficult to forecast), we can be relatively confident in our<br />
assessment of the volatility environment. One reason for this confidence is that changes in<br />
volatility are more persistent than changes in returns: Even a simple look at recent returns<br />
gives us useful insight about the immediate volatility environment. There are other ways to<br />
gauge the volatility environment: the volatility implied by options prices, for example, or the<br />
volatility of other markets.<br />
The analysis that follows is based on two assets only: U.S equity and U.S. fixed income, as<br />
represented by the <strong>Russell</strong> 3000 ® Index and the Barclays Capital U.S. Aggregate Bond Index<br />
(see Exhibit 1 for reference). It covers the period April 1979–June 2011, the period for which<br />
data on the <strong>Russell</strong> 3000 is available (the data starts at January 1979, and the strategy starts<br />
once 60 days’ return data is available from which to calculate trailing volatility).<br />
At the start of each month, the volatility of the daily equity market returns for the previous<br />
60 trading days is calculated. If that volatility lies in the range 10.3%–16.9%, then a notrade<br />
zone applies; this level of volatility is not regarded as being unusual enough to merit a<br />
deviation from the default asset allocation of 50% equity/50% fixed income. (This range was<br />
chosen so that the no-trade zone applies half of the time.)<br />
As volatility rises beyond 16.9%, the allocation to risky assets is decreased. Conversely, as<br />
volatility falls below 10.3%, the allocation to risky assets is increased. Note that the size of the<br />
no-trade zone, the minimum and maximum allocations to risky assets and the rate at which<br />
those minimum and maximum positions are achieved are parameters that can be customized<br />
to the specific situation.<br />
Our analysis confirms that this strategy does indeed produce lower volatility than the fixed<br />
mix, and its volatility is more stable and predictable. However, this is only half of the story.<br />
<strong>Russell</strong> <strong>Investments</strong> // <strong>Russell</strong> Communiqué p / 8
RUSSELL INVESTMENTS<br />
CLIENT FOCUS (continued)<br />
Asset allocation is not about risk alone,<br />
but about the trade-off between risk and<br />
expected return. If the rewards for taking<br />
risk are highest at the times of high market<br />
volatility, then the reduction in volatility<br />
shown above would come at too high a<br />
price: a drop in returns that more than wipes<br />
out the risk benefit. Here, too, the strategy<br />
stands up well: there was no return penalty<br />
over the period analyzed; the volatilityresponsive<br />
strategy delivered an average 40<br />
basis points higher return after accounting<br />
for trading costs.<br />
The full results are summarized in the table<br />
below, which compares the return pattern of<br />
the volatility-responsive strategy to that of a<br />
fixed 50/50 mix.<br />
Let us consider each of these statistics in turn.<br />
Annualized return: Even allowing for the<br />
cost of trading, the volatility-responsive<br />
strategy delivered a return over the full<br />
period that not only matched but beat that<br />
of the fixed mix. Note, however, that this can<br />
be episodic: there are periods of reduced<br />
return as well as periods of enhanced return.<br />
Annualized standard deviation: For<br />
the reasons described in the previous<br />
Communiqué article, we would expect the<br />
volatility-responsive strategy to deliver a<br />
more stable return stream than the fixed mix,<br />
and this was indeed the case. Note that not<br />
only is the standard deviation of returns over<br />
the full period lower, but the variability of the<br />
standard deviation over short periods is also<br />
materially lower, as shown in Exhibit 2.<br />
5%ile monthly return: Roughly one in<br />
20 of the monthly returns were –3.05%<br />
or worse under the volatility-responsive<br />
strategy, while roughly one in 30 were<br />
–3.41% or worse under the fixed mix. Thus,<br />
using this as a definition of a bad-case<br />
scenario, the volatility-responsive strategy<br />
fares slightly better, mitigating downside risk.<br />
Worst monthly return: A more extreme<br />
bad-case scenario is provided by a look<br />
at the lowest monthly return. For the<br />
volatility-responsive strategy, this would<br />
have occurred in October 1987, when the<br />
portfolio value fell by 9.44%. (As a point<br />
of comparison, in that month the fixed-mix<br />
value fell by 9.43%.) The worst month for<br />
the fixed mix was October 2008, when<br />
it fell by 10.05%. (By comparison, the<br />
volatility-responsive strategy fell by 5.44%<br />
that month.)<br />
Worst three-month return: For the<br />
volatility-responsive strategy, this was a<br />
September through November 1987 decline<br />
of 12.16%. (As a point of comparison, over<br />
that same period, the 50/50 fixed mix<br />
declined by 14.37%.) The worst three-month<br />
return for the fixed mix, a loss of 16.86%,<br />
occurred in September through November<br />
2008. (By comparison, the volatilityresponsive<br />
strategy would have declined by<br />
8.77% over that three-month period.)<br />
In summary, then, each of the measures<br />
points to the volatility-responsive strategy<br />
Exhibit 1: Summary statistics of volatility-responsive strategy, April 1979–June 2011<br />
Fixed mix (50% equity) Volatility-responsive strategy<br />
Annualized return 10.28% 10.68%<br />
Annualized standard deviation 8.99% 8.43%<br />
5%ile monthly return –3.41% –3.05%<br />
Worst monthly return –10.05% –9.44%<br />
Worst three-month return –16.86% –12.16%<br />
Indexes are unmanaged and cannot be invested in directly.<br />
Past performance is not indicative of future results.<br />
p / 9
Exhibit 2: Volatility of returns is more stable under the volatility-responsive strategy<br />
Trailing 24-month standard deviation of returns, annualized<br />
16%<br />
12%<br />
VRAA strategy<br />
increases volatility<br />
from low levels<br />
8%<br />
4%<br />
0%<br />
VRAA strategy reduces<br />
volatility from high levels<br />
Fixed 50/50<br />
VRAA<br />
Indexes are unmanaged and cannot be invested in directly.<br />
Past performance is not indicative of future results.<br />
This article is<br />
an excerpt from<br />
the authors’<br />
Volatility-Responsive<br />
Asset Allocation:<br />
A stronger link<br />
between asset<br />
allocation policy<br />
and the market<br />
environment.<br />
having been effective in reducing and<br />
stabilizing risk, <strong>with</strong>out incurring any overall<br />
reduction in returns.<br />
As mentioned above, however, these<br />
benefits are somewhat episodic, especially<br />
<strong>with</strong> regard to the effect on returns. Thus,<br />
even though the volatility-responsive<br />
strategy would have delivered a better risk/<br />
return trade-off, it would also have created<br />
tracking error relative to the fixed mix. So<br />
if it is judged only on the basis of its impact<br />
relative to the default strategy, there will<br />
be times when it underperforms. Now, it<br />
really makes no more sense to look at the<br />
tracking error of the volatility-responsive<br />
strategy compared to a fixed mix than it<br />
would be to move from, say, a fixed 60/40<br />
mix to a fixed 50/50 mix and then judge<br />
the 50/50 mix on its tracking error relative<br />
to the higher-risk strategy. It is, however, a<br />
comparison that some will make, and it is<br />
sensible to be prepared in advance for what<br />
that comparison will show.<br />
This highlights the difference between<br />
judging a strategy in terms of its absolute<br />
return (in which case the overall performance<br />
is used to assess risk) and judging it in terms<br />
of its relative return (in which case tracking<br />
error is used to assess risk).<br />
Conclusion<br />
In summary, the use of fixed weights<br />
in strategic asset allocation policy does<br />
not result in a stable risk/return pattern<br />
over time, but rather leads to greater risk<br />
at times of high market volatility and to<br />
lower risk in unusually stable markets. For<br />
investors who are sensitive to volatility,<br />
a more consistent outcome can be<br />
achieved—both in terms of the volatility of<br />
returns and in terms of how volatile that<br />
volatility itself is—by adopting a dynamic,<br />
or volatility-responsive, approach.<br />
<strong>Russell</strong> <strong>Investments</strong> // <strong>Russell</strong> Communiqué p / 10
STRATEGY TIMING IMPLEMENTATION<br />
RUSSELL INVESTMENTS<br />
OPINION<br />
Climate change and investments,<br />
or: “Why should I care?”<br />
By: Greg Liddell, Managing Director, Consulting & Advisory Services—Australasia<br />
Greg Liddell<br />
1<br />
Doran and Zimmerman,<br />
University of Illinois,<br />
Examining the Scientific<br />
Consensus on Climate<br />
Change, EOS Volume 90<br />
Number 3, 20 January<br />
2009.<br />
2<br />
US National Oceanic<br />
and Atmospheric<br />
Administration, National<br />
Climate Date Centre<br />
http://www.ncdc.noaa.<br />
gov/indicators/<br />
3<br />
Stern Review on the<br />
Economics of Climate<br />
Change 2006.<br />
Few issues have generated more skepticism than the subject of climate change. If 97% of the<br />
world’s astronomers told us a large meteor would collide <strong>with</strong> the Earth on December 22, 2012<br />
(the alleged last day of the Mayan calendar), we would not waste too much time arguing about<br />
the veracity of their models. Rather, we would focus on building a rocket to destroy the meteor,<br />
or at least to change its trajectory. However, when 97% of the world’s geoscientists 1 tell us that<br />
anthropogenic (the politically correct term for “man-made”) carbon emissions are resulting<br />
in 0.29ºF of global warming per decade, 2 <strong>with</strong> long-term but ultimately devastating impacts,<br />
the consequence is a degree of skepticism that has led to years of procrastination. In my view,<br />
fiduciaries do not have the luxury of procrastination.<br />
So why should fiduciaries squeeze climate change considerations into governance budgets which<br />
are already stretched? In my view, there are two answers to that question, one based on long-term<br />
sustainable values and one based on responsibilities in relation to the management of risk.<br />
Our current economy has a use-by date. Ultimately we will run out of fossil fuels and be forced to<br />
transition to renewable sources of energy. Studies tell us that the longer we postpone the transition,<br />
the more harm we will do to the planet, and the more costly and painful the transition will be. 3 Those<br />
who adopt a broader view of fiduciary responsibility would argue that as effective owners of the<br />
economy, fiduciaries should deploy capital not only to generate returns, but also to facilitate transition<br />
to a sustainable economy and in doing so, protect and maintain the society and way of life of members.<br />
On a shorter-term basis, fiduciaries should be aware of the risk to portfolios climate change poses.<br />
Agencies such as the EPA can introduce regulations materially changing the economics of some<br />
enterprises. State governments can introduce measures that effectively put a price on carbon,<br />
and foreign governments can introduce measures impacting companies operating <strong>with</strong>in their<br />
jurisdictions—for example, U.S. airlines flying into Europe will need to purchase carbon credits from<br />
January 2012. The physical risks associated <strong>with</strong> climate change should also not be ignored. Owners<br />
of physical assets need to incorporate stress testing for climate-change scenarios in their due diligence<br />
and ongoing management, or face potential losses and liability. Property must cope <strong>with</strong> rising<br />
seawater and more violent storms, motorways must cope <strong>with</strong> heavier rainfall. The insurance industry<br />
is already sending price signals in regard to climate change, increasing the price of insuring assets in<br />
high-risk areas and increasing the number of areas deemed “uninsurable.”<br />
An awareness of climate change does not mean fiduciaries should immediately invest large<br />
proportions of their assets in wind farms and solar energy initiatives. Most climate funds lack<br />
diversification and rely too heavily on government subsidies to generate returns. Climate change,<br />
like economic cycles, interest rates and national debt, is a factor. Thought should be given to the<br />
vulnerability of assets to either the financial or the physical risks associated <strong>with</strong> this factor, much<br />
as fiduciaries consider the impact of increased interest rates on bond portfolios, or of decreased<br />
consumer confidence on the stock prices of retail companies. The initial imperative for fiduciaries<br />
is to educate themselves on the issues.<br />
p / 11
STRATEGY TIMING IMPLEMENTATION<br />
Q&A<br />
The evolution of target<br />
date investing<br />
With Josh Cohen, Defined Contribution Practice Leader<br />
Josh Cohen<br />
Target date funds are relatively new. Is there evidence that they are<br />
actually helping participants avoid some of the pitfalls of investing?<br />
Yes. Before the creation of target date funds, many defined contribution (DC) plan<br />
participants struggled <strong>with</strong> poor diversification—many invested too much in company<br />
stock, for example. Participants also struggled <strong>with</strong> making investment choices<br />
appropriate for their ages, such as not taking on enough investment risk in their<br />
younger years. By their design, target date funds automatically resolve the issues of<br />
age-appropriate investing and diversification.<br />
Since the original creation of target date funds, what developments<br />
have you seen in the marketplace?<br />
Target date funds really started as turnkey solutions for DC plan sponsors looking for<br />
diversified default options. After the Pension Protection Act of 2006, many plan sponsors<br />
embraced target date funds as qualified default investment alternatives (QDIAs).<br />
Plan sponsors and target date fund providers have recognized that specialization can<br />
improve outcomes. One development is the rise of “open architecture” funds that<br />
include a mix of best-in-class managers instead of a single proprietary manager. This<br />
approach could also allow some large plan sponsors to take greater control and create<br />
their own target date funds.<br />
Another target date fund development is the desire for broader diversification, including<br />
the addition of products most sponsors would not include as standalone DC plan<br />
options—for example, alternative investments such as commodities or infrastructure<br />
funds. Investors have felt the pain of market ups and downs. Research is showing that<br />
such additional diversification can help lessen fund volatility.<br />
If plans are big enough, we are seeing demand for high levels of target date fund<br />
customization based on unique plan demographics.<br />
What’s driving the continual evolution of target date funds?<br />
Greater awareness that participants are increasingly relying upon DC plans, particularly<br />
the plans’ QDIA, as their primary vehicle for retirement savings. In their desire to serve<br />
as good fiduciaries, plan sponsors are really aiming to choose target date solutions<br />
that fit the participants in their plans—and that desire is driving demand for open<br />
architecture, increased diversification and higher levels of customization.<br />
<strong>Russell</strong> <strong>Investments</strong> // <strong>Russell</strong> Communiqué p / 12
RUSSELL INVESTMENTS<br />
Q&A (continued)<br />
Exhibit 1: The evolution of target date investing<br />
Early stage Current Future<br />
Objective Turnkey solutions Increased<br />
diversification and<br />
customization<br />
New asset classes<br />
U.S. equity,<br />
international<br />
developed equity,<br />
U.S. aggregate bonds<br />
REITS, commodities,<br />
TIPS, emerging<br />
markets,<br />
infrastructure, high<br />
yield, tactical AA<br />
Focus on participant<br />
outcomes and<br />
retirement income<br />
Annuities, longduration<br />
bonds<br />
Managers Proprietary Open architecture Open architecture<br />
Glide paths Off-the-shelf Customization at<br />
plan level<br />
Customization at<br />
participant level<br />
How do you think target date funds will evolve in the future?<br />
I think everyone—plan sponsors, participants and fund providers—will be more focused<br />
on retirement income. Right now, many participants are asking, “What level of assets<br />
am I going to have in retirement?” However, as many of the baby boomers approach and<br />
enter into retirement, they’re starting to ask, “What will my level of income be during<br />
retirement?” It’s a different mind-set.<br />
A focus on retirement income also has implications for product design. If retirees<br />
are looking for regular income, purchasing life annuities could enhance their living<br />
standards relative to a systematic <strong>with</strong>drawal program. Alternatively, long-duration bonds<br />
offer return potential similar to fixed annuities, but <strong>with</strong>out the administrative complexity.<br />
Are there other trends on the way?<br />
Mass customization is also on the horizon. For example, two issues <strong>with</strong> target date funds<br />
are that they give advice based only on the factor of age and they don’t adapt to shifts in the<br />
markets. Using information in a recordkeeper database, providers could create custom target<br />
date strategies for each participant based not only on age, but also on income level, current<br />
savings rates, and coverage in other company-sponsored retirement plans. They could also<br />
adapt asset-allocation strategies in response to market events and changes in contributions.<br />
I believe these trends are ultimately focused on improving the financial security of retirees.<br />
As more people rely on DC plans and default options as the main source of retirement<br />
savings, creating solutions tailored to their needs becomes increasingly important.<br />
p / 13
GREAT MOMENTS IN FINANCIAL HISTORY<br />
The opening of the Lions Gate<br />
By: Aran Murphy, Product Strategist<br />
Aran Murphy<br />
In debates about government power in the economic realm, two oft-used arguments are that,<br />
absent the government, public goods such as roads and bridges will not be constructed; and<br />
that only the government, not the private sector, is in the position to sponsor demand-sustaining<br />
public works projects during recessions. Odd, then, that such an impossibility as the Lions Gate<br />
Bridge exists.<br />
Built in Vancouver, British Columbia during the Great Depression, the Lions Gate Bridge connects<br />
the mostly water-locked downtown of Vancouver to the open land at its north. The bridge<br />
was constructed <strong>with</strong> private funds, <strong>with</strong> the aim of private profits, and was one of the largest<br />
construction projects in the city during that era. What follows is the story of how it came to be.<br />
Vancouver is the primary seaport of Western Canada, economically vital as a gateway to Asia.<br />
Like Manhattan Island in New York, Vancouver Island seats the downtown area and is the heart<br />
of the city. Although not really an island (it is connected to the mainland in the east, and not to be<br />
confused <strong>with</strong> the “real” Vancouver Island to its west), Vancouver was hemmed in by water. These<br />
geographical boundaries limited the city’s growth and made downtown real estate expensive on a<br />
relative level, even as the Great Depression dragged down overall economic activity.<br />
1<br />
All monetary figures<br />
expressed are in<br />
Canadian dollars.<br />
2<br />
Avison Young,<br />
Commercial Report:<br />
North Shore, BC; Fall/<br />
Winter 2009<br />
Sources:<br />
“Legacies: A Brief History<br />
of the Upper Lands,”<br />
British Pacific Properties.<br />
Online at http://www.<br />
britishproperties.com/<br />
about_us,legacies.<br />
“Lions Gate Bridge,”<br />
British Columbia<br />
Networks Association.<br />
Online at http://hp.bccna.<br />
bc.ca/Library/WestVan/<br />
history/Thumbnails/<br />
lions_thumb.htm.<br />
Across the Burrard Inlet to the north stretched an area of mostly forested and undeveloped land<br />
many times larger than that of downtown. Situated along the southmost footprint of the Canadian<br />
Rockies, the land sloped upward from Vancouver Bay to the two Lion Mountains, providing good<br />
terrain and—in real estate developers’ eyes—terrific potential for unobstructed southerly views.<br />
Some of this land was incorporated as the City of North Vancouver, which was then under threat of<br />
bankruptcy, owing to the inability of many landowners to pay their property taxes.<br />
Economic necessity mothered some innovative thinking. An engineer-cum-real-estate promoter,<br />
A.J.T. Taylor, convinced the Guinness family of London to purchase 4,700 acres in the Upper Lands<br />
area of North Vancouver in exchange for $1 million 1 in improvements over the next five years. For<br />
4,000 of those acres $75,000 was exchanged, putting the cost per acre at $18.75. As an additional<br />
condition of the sale, the family was to fund the construction of a bridge to the north shore from<br />
Vancouver’s Stanley Park. It was to be the Lions Gate Bridge.<br />
After a year and a half of construction and just under $6 million, the Lions Gate Bridge was<br />
completed in 1938. Although tolls of $0.25 per car were charged, it was not the tolls but the rapid<br />
increase in land values on the other side that justified the Guinness family investment. Having<br />
realized their real-estate investment aims, the Guinness family sold the bridge in 1955 to the<br />
province of British Columbia—for just under $6 million, less than half of its appraised value.<br />
Today 60,000 to 70,000 cars move daily across the 5,000-foot span of the Lions Gate, uniting<br />
mainly residential North Shore <strong>with</strong> Vancouver’s bustling downtown. One relatively recent<br />
commercial real estate report 2 puts North Shore industrial land prices at an average of $2 million<br />
per acre.<br />
In today’s era of collapsing public finances, high unemployment rates and the growing necessity<br />
for infrastructure investments, we can look back to the Lions Gate Bridge opening as having been<br />
truly a great moment.<br />
<strong>Russell</strong> <strong>Investments</strong> // <strong>Russell</strong> Communiqué p / 14
RUSSELL INVESTMENTS<br />
Nothing contained in this material is intended to constitute legal, tax, securities or investment advice, nor an opinion regarding the<br />
appropriateness of any investment, nor a solicitation of any type. The general information contained in this publication should not be<br />
acted upon <strong>with</strong>out obtaining specific legal, tax and investment advice from a licensed professional.<br />
These views are subject to change at any time based upon market or other conditions and are current as of the date at the beginning of<br />
the document.<br />
Where noted, the opinions expressed in this material are not necessarily those held by <strong>Russell</strong> Investment Group, its affiliates or<br />
subsidiaries. While all material is deemed to be reliable, accuracy and completeness cannot be guaranteed. The information, analysis and<br />
opinions expressed herein are for general information only and are not intended to provide specific advice or recommendations for any<br />
individual or entity.<br />
Please remember that all investments carry some level of risk, including the potential loss of principal invested. They do not typically<br />
grow at an even rate of return and may experience negative growth. As <strong>with</strong> any type of portfolio structuring, attempting to reduce risk<br />
and increase return could, at certain times, unintentionally reduce returns. Although steps can be taken to help reduce risk it cannot be<br />
completely removed.<br />
Diversification does not assure a profit and does not protect against loss in declining markets.<br />
Target date funds are not intended to be a complete solution to investors retirement income needs. Investors must weigh many factors<br />
when considering to invest in these funds, including how much an investor will need, how long will the investor need it for, what other<br />
sources the investor will have and, if the investor is purchasing shares in an IRA account, whether the fund’s target distributions will<br />
meet IRS minimum distribution requirements once age 70 1/2 is reached. Indexes are unmanaged and cannot be invested in directly.<br />
Returns represent past performance, are not a guarantee of future performance and are not indicative of any specific investment.<br />
The trademarks, service marks and copyrights related to the <strong>Russell</strong> indexes and other materials as noted are the property of their<br />
respective owners.<br />
Copyright © <strong>Russell</strong> <strong>Investments</strong> 2011. All rights reserved. This material is proprietary and may not be reproduced, transferred or<br />
distributed in any form <strong>with</strong>out prior written permission from <strong>Russell</strong> <strong>Investments</strong>. It is delivered on an “as is” basis <strong>with</strong>out warranty.<br />
<strong>Russell</strong> Investment Group is a Washington USA corporation which operates through subsidiaries worldwide, including <strong>Russell</strong><br />
<strong>Investments</strong>, and is a subsidiary of The Northwestern Mutual Life Insurance Company.<br />
The <strong>Russell</strong> logo and Conscious Currency are trademarks and service marks of <strong>Russell</strong> <strong>Investments</strong>.<br />
Date of first use: October 2011<br />
p / 15
<strong>Russell</strong> Communiqué<br />
www.russell.com/institutional<br />
www.russell.com/ca/institutional<br />
U.S. West Coast contact<br />
U.S. East Coast contact<br />
David Rothenberg<br />
Managing Director<br />
U.S. Institutional—Large Market<br />
800-455-3782<br />
drothenberg@russell.com<br />
To learn more about<br />
our services for<br />
institutional investors<br />
or topics in this issue<br />
of Communiqué,<br />
contact your <strong>Russell</strong><br />
representative or one<br />
of these associates.<br />
Gerard W. Lillis<br />
Director, Relationship Management<br />
Americas Institutional<br />
800-541-0556<br />
glillis@russell.com<br />
Canadian contact<br />
Dexton Blackstock<br />
Head of Institutional Business Development<br />
Institutional Investment Solutions<br />
416-640-6202<br />
dblackstock@russell.com<br />
USI-10907-10 26-22-018 (1 07/11)<br />
PRINT AS PMS 425