2012 Annual Report - Prometic - Life Science, Inc.
2012 Annual Report - Prometic - Life Science, Inc.
2012 Annual Report - Prometic - Life Science, Inc.

Create successful ePaper yourself
Turn your PDF publications into a flip-book with our unique Google optimized e-Paper software.
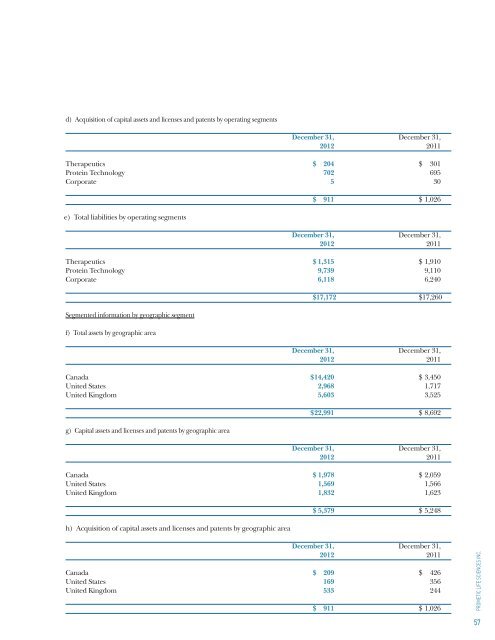
d) Acquisition of capital assets and licenses and patents by operating segments<br />
December 31, December 31,<br />
<strong>2012</strong> 2011<br />
Therapeutics $ 204 $ 301<br />
Protein Technology 702 695<br />
Corporate 5 30<br />
e) Total liabilities by operating segments<br />
$ 911 $ 1,026<br />
December 31, December 31,<br />
<strong>2012</strong> 2011<br />
Therapeutics $ 1,315 $ 1,910<br />
Protein Technology 9,739 9,110<br />
Corporate 6,118 6,240<br />
Segmented information by geographic segment<br />
f) Total assets by geographic area<br />
$17,172 $17,260<br />
December 31, December 31,<br />
<strong>2012</strong> 2011<br />
Canada $ 14,420 $ 3,450<br />
United States 2,968 1,717<br />
United Kingdom 5,603 3,525<br />
g) Capital assets and licenses and patents by geographic area<br />
$ 22,991 $ 8,692<br />
December 31, December 31,<br />
<strong>2012</strong> 2011<br />
Canada $ 1,978 $ 2,059<br />
United States 1,569 1,566<br />
United Kingdom 1,832 1,623<br />
h) Acquisition of capital assets and licenses and patents by geographic area<br />
$ 5,379 $ 5,248<br />
December 31, December 31,<br />
<strong>2012</strong> 2011<br />
Canada $ 209 $ 426<br />
United States 169 356<br />
United Kingdom 533 244<br />
$ 911 $ 1,026<br />
PROMETIC LIFE SCIENCES INC.<br />
57