doppler evaluation of valvular stenosis #3 - Echo in Context
doppler evaluation of valvular stenosis #3 - Echo in Context
doppler evaluation of valvular stenosis #3 - Echo in Context

Create successful ePaper yourself
Turn your PDF publications into a flip-book with our unique Google optimized e-Paper software.
patients with significant aortic <strong>stenosis</strong>, particularly <strong>in</strong> the elderly. A perfectly normal Doppler<br />
exam<strong>in</strong>ation, when aortic <strong>stenosis</strong> is cl<strong>in</strong>ically suspected, has been <strong>of</strong> extreme help <strong>in</strong> avoid<strong>in</strong>g<br />
unnecessary cardiac catheterization <strong>in</strong> these <strong>in</strong>dividuals.<br />
However, it is important for the beg<strong>in</strong>ner to appreciate that difficult patients do occur and<br />
considerable experience is required to perform these procedures properly. When record<strong>in</strong>gs <strong>of</strong> poor<br />
quality are seen, they should be disregarded s<strong>in</strong>ce they will generally underestimate the severity <strong>of</strong><br />
the gradient. Even when good traces are obta<strong>in</strong>ed, it is possible to record falsely high gradients by<br />
Doppler, especially <strong>in</strong> the sett<strong>in</strong>g <strong>of</strong> aortic <strong>in</strong>sufficiency. We have found that it takes most<br />
beg<strong>in</strong>ners a year <strong>of</strong> experience <strong>of</strong> exam<strong>in</strong><strong>in</strong>g reasonable numbers <strong>of</strong> patients to obta<strong>in</strong> reliable<br />
results.<br />
Mitral Gradient <strong>in</strong> Mitral Stenosis<br />
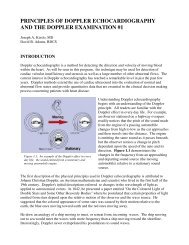
Figure 3. 37 PW Doppler spectral record<strong>in</strong>g from the<br />
mitral orifice taken from the apical w<strong>in</strong>dow. Early<br />
diastolic flow is high (closed arrow), followed by a<br />
rapid descent and then peaks aga<strong>in</strong> after atrial<br />
contraction (open arrow) (Scale marks = 20cm/s)<br />
The best w<strong>in</strong>dow for exam<strong>in</strong>ation <strong>of</strong> mitral<br />
valve diastolic flow is <strong>in</strong>variably apical. With<br />
the transducer at the cardiac apex, the<br />
ultrasound beam should be directed posteriorly<br />
and slightly laterally to <strong>in</strong>tercept mitral valve<br />
flow. In normal <strong>in</strong>dividuals, PW Doppler is<br />
adequate for record<strong>in</strong>g mitral valve diastolic<br />
flow. Mitral flow is typically lam<strong>in</strong>ar and<br />
biphasic (Fig. 3.37), peak<strong>in</strong>g <strong>in</strong> early diastole<br />
(closed arrow) and ris<strong>in</strong>g aga<strong>in</strong> with atrial<br />
contraction <strong>in</strong> late diastole (open arrow).<br />
The exam<strong>in</strong>ation for mitral <strong>stenosis</strong> is usually<br />
much easier and more straightforward than that<br />
for aortic <strong>stenosis</strong>. The typical CW spectral<br />
record<strong>in</strong>g <strong>of</strong> mitral <strong>stenosis</strong> demonstrates<br />
spectral broaden<strong>in</strong>g <strong>in</strong> diastole, with peak flow<br />
<strong>in</strong> early diastole and a progressive but slowed<br />
diastole descent (Fig. 3.38).<br />
The secondary <strong>in</strong>crease <strong>in</strong> diastolic velocity<br />
due to atrial contraction is absent <strong>in</strong> patients<br />
with atrial fibrillation.<br />
Figure 3. 38 Typical CW spectral velocity record<strong>in</strong>g<br />
from a patient with mitral <strong>stenosis</strong> and <strong>in</strong>sufficiency.<br />
From the apex, the diastolic flow <strong>of</strong> mitral <strong>stenosis</strong> is<br />
toward the transducer. There is a rise <strong>in</strong> velocity <strong>in</strong><br />
early diastole followed by a slow diastolic descent.<br />
A mitral valve gradient is calculated us<strong>in</strong>g the<br />
modified Bernoulli equation, discussed<br />
previously. The spectral record<strong>in</strong>g <strong>in</strong> Figure<br />
3.39 shows a peak diastolic velocity <strong>of</strong> 2 m/s<br />
that is equivalent to a 16mmHg peak<br />
transmittal pressure gradient. As with aortic<br />
<strong>stenosis</strong>, the transmitral pressure gradient may<br />
be reported <strong>in</strong> several ways. Catheterization<br />
laboratories usually report the mean gradient.<br />
In order to compute a comparable mean<br />
gradient for Doppler data, multiple<br />
<strong>in</strong>stantaneous peak gradients must be measured<br />
dur<strong>in</strong>g diastole (such as 40-100 ms <strong>in</strong>tervals)<br />
and the values averaged. At least 10 well