doppler evaluation of valvular stenosis #3 - Echo in Context
doppler evaluation of valvular stenosis #3 - Echo in Context
doppler evaluation of valvular stenosis #3 - Echo in Context

Create successful ePaper yourself
Turn your PDF publications into a flip-book with our unique Google optimized e-Paper software.
difficult to determ<strong>in</strong>e the presence <strong>of</strong> mild pulmonic <strong>stenosis</strong>.<br />
OTHER OBSTRUCTIVE LESIONS AND GRADIENTS<br />
Coarctation <strong>of</strong> the Aorta<br />
These basic pr<strong>in</strong>ciples may be applied to almost<br />
any situation where pressure-gradient<br />
<strong>in</strong>formation is desired. Coarctation <strong>of</strong> the aorta<br />
may be readily identified with the transducer <strong>in</strong><br />
the suprasternal notch and the Doppler beam<br />
angled slightly anteriorly and to the patient’s<br />
right side. Systolic flow from the ascend<strong>in</strong>g<br />
aorta is encountered mov<strong>in</strong>g toward the<br />
transducer us<strong>in</strong>g this w<strong>in</strong>dow (Fig. 3.45). With<br />
angulation <strong>of</strong> the beam slightly posteriorly, the<br />
higher velocity jet through the coarctation <strong>in</strong><br />
the descend<strong>in</strong>g aorta is then encountered<br />
mov<strong>in</strong>g away from the transducer. Doppler<br />
echocardiography has been shown to be a<br />
reliable method for determ<strong>in</strong><strong>in</strong>g the presence <strong>of</strong><br />
this disorder.<br />
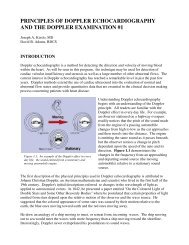
Figure 3. 45 Schematic representation (left) show<strong>in</strong>g<br />
direction <strong>of</strong> the CW beam from the suprasternal<br />
w<strong>in</strong>dow <strong>in</strong>to the ascend<strong>in</strong>g aorta (A) and descend<strong>in</strong>g<br />
aorta (B) <strong>in</strong> a patient with coarctation <strong>of</strong> the aorta.<br />
The result<strong>in</strong>g spectral velocity record<strong>in</strong>g is shown on<br />
the right. (Scale marks = 1m/s)<br />
Hypertrophic Obstructive<br />
Cardiomyopathy<br />
The area <strong>of</strong> obstruction <strong>in</strong> hypertrophic<br />
obstructive cardiomyopathy (also called<br />
idiopathic hypertrophic subaortic <strong>stenosis</strong>) is<br />
thought to occur where the anterior mitral valve<br />
leaflet opposes the <strong>in</strong>terventricular septum.<br />
This is a dynamic, rather than fixed, obstruction<br />
that usually becomes more severe as systole<br />
progresses.<br />
Figure 3. 46 In hypertrophic obstructive<br />
cardiomyopathy, the largest gradient occurs <strong>in</strong> mid-tolate<br />
systole (left panel). This usually shows a late<br />
peak<strong>in</strong>g velocity across the left ventricular outflow<br />
tract (right panel). (Scale marks = 1m/s)<br />
In Figure 3.46 idealized aortic and left<br />
ventricular pressure trac<strong>in</strong>gs <strong>in</strong>dicate that the<br />
peak gradient usually occurs <strong>in</strong> mid to late<br />
systole as a consequence <strong>of</strong> the chang<strong>in</strong>g<br />
relationships between the tip <strong>of</strong> the mitral<br />
leaflet and the septum. On the right is a typical<br />
CW spectral record<strong>in</strong>g from a patient with this<br />
disorder. Note the late peak<strong>in</strong>g <strong>of</strong> the jet as a<br />
result <strong>of</strong> the altered pressure dynamics.<br />
Cont<strong>in</strong>ued cl<strong>in</strong>ical practice <strong>in</strong>dicates that<br />
patients with this disorder may have some <strong>of</strong><br />
the highest velocities encountered by Doppler echocardiography. The peak velocity illustrated <strong>in</strong>