doppler evaluation of valvular stenosis #3 - Echo in Context
doppler evaluation of valvular stenosis #3 - Echo in Context
doppler evaluation of valvular stenosis #3 - Echo in Context

Create successful ePaper yourself
Turn your PDF publications into a flip-book with our unique Google optimized e-Paper software.
detailed descriptions <strong>of</strong> the cont<strong>in</strong>u<strong>in</strong>g<br />
evolution <strong>of</strong> this pr<strong>in</strong>ciple. Many factors must<br />
be taken <strong>in</strong>to account, an important one be<strong>in</strong>g<br />
heart rate. Adult patients with pulmonary<br />
hypertension may have normal heart rates <strong>of</strong><br />
60-70 beats/m<strong>in</strong>, and <strong>in</strong>fants and children >140<br />
beats/m<strong>in</strong>; this may significantly shorten<br />
measurements <strong>of</strong> time to peak velocity or<br />
acceleration times, and affect the reliability <strong>of</strong><br />
these estimates <strong>of</strong> pressure.<br />
Figure 3. 10 Idealized spectral record<strong>in</strong>gs<br />
demonstrat<strong>in</strong>g that time-to-peak velocity is very rapid<br />
<strong>in</strong> patients with pulmonary hypertension.<br />
What is most important is that time to peak<br />
velocity is significantly shortened <strong>in</strong> patients<br />
with pulmonary hypertension. Figure 3.10<br />
demonstrates both normal and rapid time to<br />
peak velocities <strong>in</strong> two idealized spectral<br />
record<strong>in</strong>gs.<br />
ESTIMATION OF THE<br />
SEVERITY OF VALVULAR<br />
STENOSIS<br />
Effect <strong>of</strong> Stenosis on Blood Flow<br />
Figure 3. 11 PW Doppler spectral record<strong>in</strong>g <strong>of</strong> aortic<br />
blood flow (arrow) taken from the apical w<strong>in</strong>dow.<br />
Note the lam<strong>in</strong>ar appearance <strong>of</strong> normal flow. (Scale<br />
marks = 20 cm/s)<br />
Figure 3. 12 Left panel – Without aortic valve<br />
obstruction, systolic pressures are almost the same <strong>in</strong><br />
the ventricle and the aorta. Right panel – When<br />
significant aortic valve obstruction is present, left<br />
ventricular pressure rises much higher than aortic, and<br />
a systolic pressure gradient is present. The size <strong>of</strong> the<br />
arrows represents the magnitude <strong>of</strong> the pressures.<br />
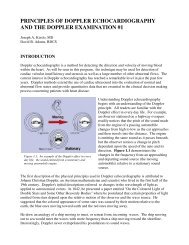
The driv<strong>in</strong>g force for blood to move across any<br />
cardiac valve is the presence <strong>of</strong> a slight<br />
pressure difference normally found between<br />
the chambers (or chamber and great vessel) on<br />
either side <strong>of</strong> the valve. For example, systolic<br />
pressure builds with<strong>in</strong> the left ventricle until it<br />
reaches a po<strong>in</strong>t where it exceeds the pressure<br />
<strong>in</strong> the aorta. The aortic valve is suddenly<br />
thrown open and blood is ejected <strong>in</strong>to the<br />
aorta. In normal <strong>in</strong>dividuals, there is a very<br />
slight (1-2 mmHg) pressure difference between<br />
the left ventricle and aorta that helps drive the<br />
blood across the aortic valve.<br />
Normal aortic valve blood flow is lam<strong>in</strong>ar<br />
(Fig. 3.11) and most <strong>of</strong> the red cells <strong>in</strong> the<br />
aortic root dur<strong>in</strong>g systole are mov<strong>in</strong>g at<br />
approximately the same speed. Graphically,<br />
this translates <strong>in</strong>to a narrow band <strong>of</strong> dark grey<br />
on the pulsed wave (PW) Doppler spectral<br />
record<strong>in</strong>g (Fig. 3 11, arrow). Normal peak<br />
systolic velocity <strong>of</strong> blood flow across the aortic<br />
valve rarely exceeds 1.5 m/s.