Executive Summary - Al Rajhi Capital - الراجØÙŠ الماليه
Executive Summary - Al Rajhi Capital - الراجØÙŠ الماليه
Executive Summary - Al Rajhi Capital - الراجØÙŠ الماليه

Create successful ePaper yourself
Turn your PDF publications into a flip-book with our unique Google optimized e-Paper software.
www.alrajhi-capital.com<br />
Third Quarter 2009<br />
Quarterly Report<br />
Research
Quarterly Corporate Update<br />
Q3 2009
<strong>Executive</strong> <strong>Summary</strong><br />
The financial results of companies listed in the Saudi stock market were negatively affected in Q3 2009 by a combination of many<br />
factors, which resulted from the international financial crisis. The major factors included the sharp decline in oil prices at the end<br />
of 2008 and beginning of 2009, the accelerating deterioration in the prices of goods and the economic recession that hit most of<br />
the global markets. Looking into aggregate net profits, we find that they retreated during the third quarter of the current year by<br />
approximately 27% year-on-year to SR 17.4 billion compared with SR 23.7 billion. Likewise, the net profits of the listed companies<br />
in the Saudi stock market for the first nine months, dropped by about 36% year-on-year to SR 45.9 billion, compared with SR 71.5<br />
billion.<br />
Analysis of the market sectors in terms of growth during the third quarter, shows that the Insurance sector ranked first as its net<br />
profits grew very sharply by 1100% to SR 132.3 billion, followed by the Multi Investment sector with growth of 400% to SR 135.4<br />
billion. On the other hand, the Media & Publishing and Transport sectors headed the losers list as they declined by 74.3 % and<br />
73.9% respectively. For the nine months period, the Hotels & Tourism sector topped the gainers list, rising by 300%, followed by<br />
the Insurance sector which gained by 208%. The top losers’ list was dominated by the Petrochemical Sector, which sank by 80%,<br />
followed closely by the Media and Publishing sector, which fell by 73%.The National Co. for Co-operative Insurance ranked first on<br />
the top gainers list for the third quarter and grew by more than 274% while Medgulf Insurance Co. headed the gainers list for the<br />
nine months period with handsome growth of 833%.<br />
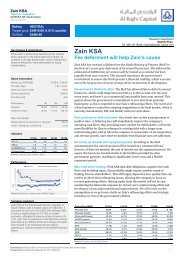
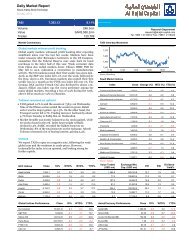
The performance of the Saudi stock market during the third quarter was positive as it gained by about 13% .This performance<br />
was supported by the rise in the oil prices to their highest level in a year. Moreover, the solidity of the Banking sector and its<br />
high creditworthiness helped to reinforce investors’ confidence. We believe that corporate results, particularly in the influential<br />
Petrochemicals sector, will improve when any signs of improvement in the global economy appear in the horizon.<br />
Sector<br />
Q3 (Net Profit, SAR)<br />
%<br />
9months (Net Profit, SAR)<br />
2008 2009 2008 2009<br />
Banks & Financial 6,085,800,000 6,146,200,000 1.00% 19,373,300,000 18,868,400,000.00 -2.60%<br />
Petrochemical Industries 9,357,978,710 3,686,123,334 -60.60% 26,818,736,528 5,410,197,376 -79.80%<br />
Cement 787,053,622 813,831,828 3.40% 3,274,621,842 2,896,770,768 -11.50%<br />
Retail Sector 140,969,743 159,227,950 13.00% 487,621,864 505,906,684 3.70%<br />
Energy & Utilities 1,527,200,000 1,769,100,000 15.80% 1,618,000,000 1,735,400,000 7.30%<br />
Agriculture & Food Industries 515,629,886 669,617,737 29.9% 1,558,443,167 1,588,121,074 1.9%<br />
Telecommunication &<br />
Information Technology<br />
2,902,000,000 2,390,000,000 -17.6% 11,195,000,000 9,843,000,000 -12.1%<br />
Insurance 10,828,197 132,305,137 1121.9% 61,729,853 190,051,113 207.9%<br />
Multi-Investment 27,060,488 135,358,680 400.20% 936,732,959 327,358,306 -65.10%<br />
Industrial Investment 335,347,145 340,011,419 1.40% 487,621,864 505,906,684 -6.60%<br />
Building & Construction 728,190,000 349,001.00 -52.00% 2,102,220,000 1,086,630,000 -48.30%<br />
Real Estate Development 809,850,083 665,428,298 -17.80% 2,119,107,134 1,824,524,043 -13.90%<br />
Transport 334,029,438 87,148,738 -73.90% 698,787,680 372,948,772 -46.60%<br />
Media and Publishing 81,400,000 20,900,000 -74.30% 293,600,000 79,200,000 -73.00%<br />
Hotel & Tourism 34,602,042 14,176,648 -59.00% 91,052,37.0 360,522,274 296.00%<br />
MARKET 23,677,939,354 17,378,430,769 -26.60% 71,538,788,146 45,938,878,845 -35.80%<br />
%
7.000 Volume TASI Index 0.5<br />
6.500<br />
6.000<br />
5.500<br />
5.500<br />
TASI Index Performance<br />
07/01/09 07/22/09 08/12/09 09/08/09 09/30/09<br />
0.4<br />
0.3<br />
0.2<br />
0.1<br />
0<br />
Millions
Banks & Financial Services<br />
Notwithstanding an increase in provisions for bad loans,<br />
the financial results of the Banking sector showed growth in<br />
third quarter profits of 1% to SR 6.14 billion compared with<br />
the corresponding quarter of the previous year, thanks to the<br />
rise in income from basic operations and higher returns on<br />
commissions. Six banks reported growth in their net income,<br />
while four banks reported declines of varying degrees due to<br />
the rise in the provisions for bad loans. The Saudi Investment<br />
Bank ranked first on the gainers list as it achieved the highest<br />
growth rate of above 200% amongst all the banks in the third<br />
quarter as a result of achieving high investment returns,<br />
followed by Riyadh Bank with close to 50% growth rate, mainly<br />
attributable to the rise in the operating profits. In contrast, <strong>Al</strong>-<br />
Bilad Bank reported the highest decline in the seasonal profits<br />
with its third quarter profits plunging by about 96% due to the<br />
conservative policy adopted by the Bank and reflected in higher<br />
loan loss provisions. The largest bank, <strong>Al</strong> <strong>Rajhi</strong> Bank, reported<br />
net profit of SR 1.7 billion, constituting 29.2% of the total<br />
sector’s profits. Samba ranked second on 19.0%, followed by<br />
Riyadh Bank on 12.4%.<br />
The sector’s performance for the first nine months showed a<br />
slight decline in profits of 2.6% year-on-year from SR19.4 billion<br />
to SR 18.9 billion, with six banks witnessing declines in their net<br />
profits and only four banks reporting profits. <strong>Al</strong> <strong>Rajhi</strong> Bank led<br />
the gainers list with 4% growth due to higher customers’ deposits<br />
and the diversification of the Bank’s financing and investment<br />
products to both the retail and corporate segments; however,<br />
the Bank maintained its conservative policy by increasing the<br />
financial provisions. Samba grew by 2.7% due to higher profits<br />
from basic operations and growth in the customers’ deposits.<br />
ARNB and Riyadh Banks staged minor growth rates at 1.1% and<br />
0.4% respectively. It is to be mentioned here that <strong>Al</strong>inma Bank<br />
profits were excluded due to non-existence of a comparable period.<br />
The corporate profit announcements have reflected the general<br />
soundness of the Saudi banking sector, which has not been<br />
greatly affected by the financial crises that shook even many of<br />
the strongest global banks. As evidence of this, it is worth noting<br />
that the sector achieved growth in assets of 2.3%, deposits of<br />
7.0 % and loans of 1.6%. It seems reasonably clear that that the<br />
conservative policies adopted by the Saudi banks have guarded<br />
them against the international credit risks. This is evident from<br />
the increase in the credit risks provisions as the listed banks<br />
(with the exception of the Hollandi and <strong>Al</strong>-bilad banks) allocated<br />
about SR 1.5 billion in the third quarter to meet expected credit<br />
losses, with an increase of more than 330% compared with the<br />
provisions appropriated for this same purpose during the same<br />
quarter of the previous year. It is noteworthy, however, that the<br />
Saudi banks have not revealed their precise exposure to the<br />
heavily indebted and struggling Saudi groups Saud and Ahmad<br />
Hamad <strong>Al</strong>gosaibi.
Company<br />
Q3 (Net Profit, SAR)<br />
%<br />
9months (Net Profit, SAR)<br />
%<br />
EPS(9months)<br />
2008 2009 2008 2009 2008 2009<br />
Riyad Bank 513,000,000 759,000,000 48.0% 2,110,000,000 2,118,000,000.00 0.4% 1.71 1.41<br />
Bank <strong>Al</strong>Jazira 61,000,000 70,000,000 14.8% 314,000,000 293,000,000.00 -6.7% 1.05 0.98<br />
The Saudi Investment<br />
Bank<br />
66,000,000 203,000,000 207.6% 604,000,000 631,000,000.00 4.5% 1.34 1.40<br />
Saudi Hollandi Bank 306,200,000 150,300,000 -50.9% 914,800,000 525,300,000.00 -42.6% 2.77 1.59<br />
Bank Saudi Fransi 728,000,000 714,000,000 -1.9% 2,234,000,000 2,147,000,000.00 -3.9% 3.09 2.97<br />
The Saudi British<br />
Bank<br />
711,000,000 570,000,000 -19.8% 2,263,000,000 2,006,000,000.00 -11.4% 3.02 2.68<br />
Arab National Bank 628,000,000 633,000,000 0.8% 2,052,000,000 2,074,000,000.00 1.1% 3.16 3.19<br />
Samba Financial<br />
Group<br />
1,203,000,000 1,211,000,000 0.7% 3,628,000,000 3,725,000,000.00 2.7% 4.03 4.14<br />
<strong>Al</strong><strong>Rajhi</strong> Bank 1,757,000,000 1,795,000,000 2.2% 5,101,000,000 5,298,000,000.00 3.9% 3.40 3.53<br />
<strong>Al</strong>bilad Bank 44,600,000 1,900,000 -95.7% 152,500,000 51,100,000.00 -66.5% 0.51 0.17<br />
<strong>Al</strong>inma Bank 68,000,000 39,000,000 -42.6% - - - - -<br />
Sector 6,085,800,000 6,146,200,000 1.0% 19,373,300,000 18,868,400,000.00 -2.6% - -
Company<br />
Assets<br />
%<br />
Deposits<br />
%<br />
Loans<br />
2008 2009 2009 2008 2008 2009<br />
Riyad Bank 175,681 145,150 21.0% 119,459 87,660 36.3% 106,062 90,100 17.7%<br />
Bank <strong>Al</strong>Jazira 29,160 23,403 24.6% 22,192 16,859 31.6% 15,599 14,088 10.7%<br />
The Saudi Investment Bank 50,573 54,500 -7.2% 38,415 43,045 -10.8% 30,526 29,874 2.2%<br />
Saudi Hollandi Bank 63,164 61,400 2.9% 47,327 44,505 6.3% 38,949 38,910 0.1%<br />
Bank Saudi Fransi 122,000 121,000 0.8% 90,000 84,000 7.1% 81,000 79,000 2.5%<br />
The Saudi British Bank 123,900 132,600 -6.6% 89,200 95,700 -6.8% 78,800 83,600 -5.7%<br />
Arab National Bank 111,900 115,700 -3.3% 80,500 88,600 -9.1% 68,800 74,500 -7.7%<br />
Samba Financial Group 184,000 187,000 -1.6% 142,000 125,000 13.6% 86,000 96,000 -10.4%<br />
<strong>Al</strong><strong>Rajhi</strong> Bank 165,000 163,000 1.2% 123,000 118,000 4.2% 144,098 136,679 5.4%<br />
<strong>Al</strong>bilad Bank 17,018 15,341 10.9% 12,136 10,537 15.2% 10,565 7,445 41.9%<br />
Sector 1,042,396 1,019,094 2.3% 764,229 713,906 7.0% 660,399 650,196 1.6%<br />
Source: Tadawul Website and the Financial Statement.<br />
Some selected Banking Indicators as in<br />
9/12/2009 (millions)<br />
%
Bank Q3<br />
Riyad Bank<br />
Bank <strong>Al</strong>Jazira<br />
The Saudi Investment Bank<br />
Saudi Hollandi Bank<br />
Bank Saudi Fransi<br />
The Saudi British Bank<br />
Arab National Bank<br />
Samba Financial Group<br />
<strong>Al</strong><strong>Rajhi</strong> Bank<br />
<strong>Al</strong>bilad Bank<br />
Sector<br />
Source: Tadawul Website and the Financial Statement.<br />
Credit Losses Provisions (thousands)<br />
2008 2009<br />
153,589 14,682 946.1%<br />
115,676 -116 -<br />
60,000 5,000 1100.0%<br />
N.A 5,785 -<br />
57,567 -15,286 -<br />
351,537 91,773 283.1%<br />
51,188 9,168 458.3%<br />
76,933 33,167 132.0%<br />
593,967 190,654 211.5%<br />
N.A 3,329 -<br />
1,460,457 338,156 331.9%<br />
%
Petrochemical Industries<br />
Despite the fact that the petrochemicals<br />
sector was badly hit by the global<br />
financial crisis and the accompanying big<br />
decline in the prices of oil derivatives and<br />
petrochemicals, which led some of the<br />
giant local and international companies<br />
to close some of their factories or reduce<br />
their output due to the deteriorating<br />
global demand for those products, the<br />
Saudi Petrochemicals sector has started<br />
to absorb the intensity of the damage<br />
which afflicted it since late last year,<br />
supported by improvement of global oil<br />
prices and the growing demand from the<br />
East Asian consumers.<br />
The performance of the Petrochemicals<br />
sector for the third quarter was better than<br />
its performance for the second quarter<br />
2009 due to the rise of the international<br />
oil prices and the improvement of the<br />
primary petrochemicals. The sector’s<br />
results for the third quarter of this year<br />
showed a decline in its net profits by more<br />
than 60% to SR 3.7 billion, compared with<br />
the same quarter of the previous year.<br />
However, in general, the profits improved<br />
compared with the second quarter<br />
profits. When comparing the sector’s<br />
performance during the first 9 months of<br />
the current year with the corresponding<br />
months of the preceding year, we find<br />
that it has retreated by 80%.<br />
Regarding the individual companies<br />
performance for the third quarter of<br />
the current year, the income data for<br />
the industry’s heavyweight Sabic were<br />
positive when compared with the second<br />
quarter results as its profits doubled to SR<br />
3.6 billion for the current quarter. Sabic<br />
has also maintained its distinguished<br />
operational standards during the first<br />
nine months of this year compared with<br />
the same period of the previous year,<br />
as the total output increased by 4%<br />
whereas the sales went up by 3%.The<br />
Company attributed this improvement<br />
in performance to the gradual increase<br />
in the prices of petrochemicals, plastic<br />
products and metals as a result of<br />
improvement in demand for these<br />
products. On the other hand, the<br />
performance of the Saudi Fertilizers<br />
Co.(Safco) was negatively affected by<br />
the sharp decline in the international<br />
prices of fertilizers ,which did not witness<br />
any noticeable improvement to date. In<br />
contrast, the Saudi Industrial Investment<br />
Group (SIIG) has achieved unprecedented<br />
growth of 537% during the third quarter<br />
of the current year, bringing it on top<br />
of the sector’s companies in terms of<br />
performance. This impressive growth<br />
in profits has resulted from the rise<br />
in the prices of styrene, SIIG’s main<br />
product, which recorded its highest<br />
price for the year during last August at<br />
$ 1,150 per ton after which it declined<br />
sharply to hit below $ 950 per ton by<br />
the end of September.<br />
When comparing the nine months period,<br />
we find that the net profit for SIIG has<br />
declined by 39.4%, to about SR 160 million.<br />
The Company attributed this decline to<br />
the rise of Zakat allocation by SR 76.5<br />
million. The National Industrialization<br />
Co. surprised investors in the Saudi<br />
market when it announced record profits<br />
for the third quarter that exceeded SR<br />
237 million, with a percent age growth<br />
of 58% compared with the same period<br />
of 2008 and by 158% compared with the<br />
preceding quarter of the current year.<br />
The Company attributed this increase<br />
to the increase in its revenues resulting<br />
from the sales of the Saudi Ethylene<br />
and Polyethylene Co. (SEPC), which<br />
commenced commercial operation on<br />
1/6/2009. However, the Company’s profits<br />
for the nine months period declined by<br />
41.5% due to the drop in production and<br />
prices of some products in the first and<br />
second quarters of the current year.<br />
The sector’s profitability is expected to<br />
rebound and gain a momentum due to<br />
a host of reasons including the expected<br />
improvement in the crude oil prices<br />
and global demand for oil derivatives,<br />
particularly from Asian countries, in<br />
the fourth quarter and the beginning<br />
of next year. Other positive factors<br />
include the current expansion witnessed<br />
by this sector in the Kingdom and the<br />
start of experimental operation by some<br />
of the new companies such as Yanbu<br />
National Petrochemical Co.( Yansab),<br />
Petro Rabigh and Methanol Chemical<br />
Co.( Chemanol).
Company<br />
Q3 (Net Profit, SAR)<br />
%<br />
9months (Net Profit, SAR)<br />
%<br />
EPS(9months)<br />
2008 2009 2008 2009 2008 2009<br />
CHEMANOL 13,200,000 5,700,000 %56.8- 28,700,000 16,300,000 -43.2% 0.43 0.14<br />
Petrochem 5,400,000 )19,200,000) - 9,500,000 )39,400,000) - 0.04 )0.14)<br />
SABIC 7,200,000,000 3,600,000,000 -50.0% 21,700,000,000 4,500,000,000 -79.3% 7.24 1.49<br />
SAFCO 1,830,000,000 464,000,000 -74.6% 3,744,000,000 1,469,000,000 -60.8% 14.98 5.88<br />
Industrialization 149,900,000 237,300,000 58.3% 518,900,000 303,500,000 -41.5% 1.32 0.66<br />
<strong>Al</strong>ujain )10,171,290) )9,936,666) -2.3% )34,883,472) )29,802,624) -14.6% )0.50) )0.43)<br />
Nama Chemicals 6,100,000 7,400,000 21.3% 23,600,000 )28,400,000) - 0.29 )0.22)<br />
Saudi Group )31,200,000) 136,500,000 - 263,700,000 159,900,000 -39.4% 0.68 0.35<br />
Sahara Petrochemical )16,150,000) 44,260,000 - )31,580,000) 24,100,000 - )0.17) 0.12<br />
YANSAB )4,900,000) )7,000,000) -42.9% )18,000,000) )21,900,000) -21.7% )0.03) )0.04)<br />
Sipchem 136,700,000 54,700,000 -60.0% 502,000,000 84,300,000 -83.2% 1.57 0.25<br />
Advanced<br />
Polypropylene<br />
Company<br />
210,400,000 20,300,000 -90.1% 286,300,000 98,400,000 -65.6% 2.03 0.70<br />
Saudi Kayan 24,600,000 )3,700,000) - 179,900,000 )16,500,000) - 0.12 )0.01)<br />
Petro Rabigh )155,900,000) )844,700,000) -441.8% )353,400,000) )1,109,300,000) -213.9% )0.41) )1.27)<br />
Sector 9,357,978,710 3,686,123,334 -60.6% 26,818,736,528 5,410,197,376 -79.8% - -
Cement<br />
The Cement sector is still affected by the ongoing export ban,<br />
which has impacted on the growth of most of the companies,<br />
in addition to the entrance of new competitors that caused<br />
a reduction in profit margins. The sector’s results show that<br />
it achieved slight growth of about 3.4% in Q3, bringing the<br />
sector’s net profit to SR 814 million compared with SR 787<br />
million for the corresponding period of the previous year. The<br />
9 months period data reveal that the sector’s profits retreated<br />
by more than 11% to SR 2.9 billion, from SR 3.3 billion for the<br />
corresponding period of the previous year. The main reason<br />
behind the decline in profits was the diminishing volumes of<br />
sales as the cement companies used to rely on exports because<br />
of the excess supply over the local demand. This situation<br />
has created more production surpluses for these companies<br />
and consequently forced the majority to stop some of their<br />
production lines.<br />
However, some companies managed to achieve good growth<br />
rates for the third quarter topped by the Eastern Province<br />
Cement Co., which ranked top on the gainers’ list for the<br />
quarter with its net income jumping by more than 60% year-<br />
on-year, to reach SR 101 million. The Yamama Cement Co.<br />
ranked second with a handsome growth rate of 24% during<br />
the third quarter raising its net profits to SR 125 million. In<br />
contrast, the Saudi Cement, Southern Region Cement and<br />
Yanbu Cement companies retreated by various degrees during<br />
the third quarter. As regards profit growth rates for the nine<br />
months period, only Qassim Cement Company posted growth<br />
in its profits by less than 1% that is reflected on its EPS that rose<br />
to SR 9.52.<br />
Finally, it seems that the sector will start improving at the<br />
beginning of the coming year 2010 , especially now that<br />
approval has been issued for export of cement manufactured<br />
products whereas the export of raw cement is left subject to<br />
the conditions set by the authorized bodies. Another fact which<br />
augurs well for the sector, is that the Kingdom is expected to<br />
launch huge infrastructure projects. Moreover, some of the<br />
contracts that were on hold for some time, due to the global<br />
economic crisis that considerably influenced the Real Estate<br />
sector (the driving force of demand for the cement sector), now<br />
look set to be implemented.
Company<br />
Q3 (Net Profit, SAR)<br />
%<br />
9months (Net Profit, SAR)<br />
%<br />
EPS(9months)<br />
2008 2009 2008 2009 2008 2009<br />
Arab Cement 71,800,000 72,800,000 1.4% 277,400,000 259,200,000 -6.6% 3.47 3.24<br />
Yamamah Cement 100,500,000 125,300,000 24.7% 525,800,000 416,600,000 -20.8% 3.89 3.09<br />
Saudi Cement 144,700,000 123,100,000 -14.9% 489,600,000 442,800,000 -9.6% 4.80 4.34<br />
Qassim Cement 113,486,199 128,768,317 13.5% 425,652,636 428,517,602 0.7% 9.46 9.52<br />
South Cement 149,000,000 141,000,000 -5.4% 615,000,000 553,000,000 -10.1% 4.39 3.95<br />
Yanbu Cement 121,667,423 97,623,511 -19.8% 439,489,206 400,473,166 -8.9% 4.19 3.81<br />
East Cement 63,000,000 101,000,000 60.3% 359,400,000 300,600,000 -16.4% 4.18 3.50<br />
Tabuk Cement 22,900,000 24,240,000 5.9% 142,280,000 95,580,000 -32.8% 1.58 1.06<br />
Sector 787,053,622 813,831,828 3.4% 3,274,621,842 2,896,770,768 -11.5% - -
Retail<br />
The preliminary financial results of the Retail Sector, for the<br />
third quarter 2009, indicate healthy growth of 13% with net<br />
profits reaching SR 159 million, compared to SR 141 million for<br />
the corresponding period of the previous year. On a quarter-onquarter<br />
basis, the annual holiday season and the holy month of<br />
Ramadan helped this sector’s companies to increase their sales.<br />
On the other hand, the sector reported net profits that stood at<br />
SR 505.9 million for the 9 months period ending 30/9/2009, with<br />
an estimated percentage growth of about 4% compared with<br />
the same period of the preceding year.<br />
Four out of the nine companies in the sector achieved good<br />
growth. The National Agricultural Marketing Co. (Thimmar)<br />
continued its negative performance as its profits fell similar to<br />
last year. The Co. attributed this performance to the rise in the<br />
prices of agricultural crops and livestock. In contrast, <strong>Al</strong>othaim<br />
Markets Co. gained the most during the third quarter, with its<br />
net profits rising by 77.5% to SR 25 million (YOY) and by 17,3%<br />
during the first 9 months of this year, thanks to revenues growth<br />
caused by a higher number of branches and improved profit<br />
margins. <strong>Al</strong>drees Co. ranked second in terms of gains during the<br />
third quarter with a percentage increase of 31% over the same<br />
period of the previous year, to SR 18 million, due to the increase<br />
in sales. Likewise, Jarir Co., the biggest in the sector in terms<br />
of market capitalization and its contribution to the sector’s<br />
profits, maintained its growth, in the quarter as well as during<br />
the nine months period, and managed to generate profits to<br />
the tune of SR 90.6 million during the 9 months period, rising<br />
by 2.5%.The EPS stood at about SR 6.8. It is to be noted here<br />
that the profits of <strong>Al</strong>hokair Co. were not included in the sector’s<br />
profits because its period of comparison is different from the<br />
other companies in the sector.
Company<br />
Q3 (Net Profit, SAR)<br />
%<br />
9months (Net Profit, SAR)<br />
%<br />
EPS(9months)<br />
2008 2009 2008 2009 2008 2009<br />
A.Othaim Market 14,200,000 25,200,000 77.5% 52,100,000 61,100,000 17.3% 2.32 2.71<br />
Mouwasat 20,500,000 21,900,000 6.8% 73,000,000 82,500,000 13.0% 2.92 3.30<br />
SASCO 9,000,000 3,300,000 -63.3% 27,400,000 18,500,000 -32.5% 0.6 0.41<br />
Thim'ar )3,700,000) )2,200,000) -40.5% )2,500,000) )8,000,000) -220.0% )0.25) )0.80)<br />
Fitaihi 2,700,000 1,590,000 -41.1% 25,400,000 12,800,000 -49.6% 0.51 0.26<br />
Jarir 88,400,000 90,600,000 2.5% 252,600,000 270,500,000 7.1% 6.31 6.76<br />
<strong>Al</strong>drees 13,800,000 18,100,000 31.2% 41,800,000 51,500,000 23.2% 1.67 2.06<br />
<strong>Al</strong>khaleej Trng )3,930,257) 737,950 - 17,821,864 17,006,684 -4.6% 1.19 1.13<br />
Sector 140,969,743 159,227,950 13.0% 487,621,864 505,906,684 3.7% - -
Energy & Utilities<br />
The financial results of the Energy<br />
sector showed that the sector has<br />
achieved good growth during the third<br />
quarter of the current year of 15.8% over<br />
the same period of the previous year<br />
raising its profits to SR 1.8 billion. For<br />
the nine months period, the sector also<br />
managed to make a growth of 7.3%. The<br />
Saudi Electricity Co.(SEC), the biggest<br />
company in the sector, reported growth<br />
during the third quarter of 15.4% and<br />
pushed its net profits up to SR 1.7<br />
billion, compared with SR 1.5 billion<br />
for the corresponding period of the<br />
previous year. It also grew during the<br />
first nine months of this year by 10.9%<br />
to SR SR 1.7 billion compared with the<br />
same period of the previous year. The<br />
Company attributed this growth to the<br />
rise in the operating revenues of 7%<br />
and the slowdown of growth in the<br />
operating and maintenance expenses.<br />
It is to be noted here that SEC’s profits<br />
are seasonal as it achieves good profits<br />
during the second and third quarters<br />
(summer season), and incurs losses in<br />
the other two quarters. The National<br />
Gas and Industrialization Co., witnessed<br />
growth in its profits in the third quarter<br />
of more than 40% to SR 38 million,<br />
compared to SR 27 million for the<br />
same period of the previous year due<br />
to an increase in the operating profits,<br />
supported by an increase in sales. The<br />
Company’s performance during the<br />
first nine months of the current year<br />
reveals that its net profits contracted by<br />
more than 43% to SR 61.4 million, from<br />
SR 108 million for the corresponding<br />
period of the previous year because the<br />
previous year’s results had included<br />
investment profits.
Company<br />
Q3 (Net Profit, SAR)<br />
%<br />
9months (Net Profit, SAR)<br />
%<br />
EPS(9months)<br />
2008 2009 2008 2009 2008 2009<br />
NATL. GAS & IND 27,200,000 38,100,000 40.1% 108,000,000 61,400,000 -43.1% 1.44 0.82<br />
Saudi Electric 1,500,000,000 1,731,000,000 15.4% 1,510,000,000 1,674,000,000 10.9% 0.36 0.4<br />
Sector 1,527,200,000 1,769,100,000 15.8% 1,618,000,000 1,735,400,000 7.3% - -
Agriculture & Food Industries<br />
The preliminary financial results for<br />
the third quarter 2003 showed that the<br />
net profits for the Agriculture & Food<br />
Industries sector reached SR 669,6<br />
million compared to SR 516 million for the<br />
same period of last year, rising by 30%.<br />
The sector’s first nine months profits grew<br />
by approximately 2% y-o-y. This increase<br />
was driven by the handsome growth<br />
attained by the biggest listed companies<br />
in this sector, namely <strong>Al</strong>marai and Savola<br />
whose contribution to the sector’s profits<br />
constituted more than 70%.<br />
<strong>Al</strong>marai Co. attained net profits during<br />
the third quarter of SR 363 million with<br />
a percentage increase of 24%. The first<br />
nine months profits increased by 22.7%<br />
to SR 875 million. The Co. stated that<br />
this growth is attributed to its polices<br />
and investment & development plans<br />
aiming to meet the need of its products<br />
consumers. An important development<br />
on <strong>Al</strong>marai’s front is that it has acquired<br />
completely Hail Agriculture Co., which<br />
will reinforce its leading role in this<br />
sector. As regards Savola Co., its financial<br />
data show net profits to the tune of SR 278<br />
million during the third quarter, with a<br />
per cent age increase of more than 75%<br />
compared with the same period of the<br />
previous year, the highest increase for<br />
this quarter among all the companies<br />
operating in this sector. The Company<br />
also made growth in its profits during the<br />
first nine months of 2.6% to SR 638 million<br />
resulting from an increase in sales by 28%<br />
The Company has forecasted achieving<br />
net profits to the tune of SR 190 million<br />
during the fourth quarter 2009 regardless<br />
of the capital gains that have been or will<br />
be generated.<br />
On the other hand, barring <strong>Al</strong>-jouf<br />
Agriculture Co., all the companies<br />
operating in agriculture activities (Qassim<br />
Agri., Tabuk Agri. Dev. Co., Ash-Sharqiyah<br />
Dev.Co. incurred losses during the third<br />
quarter due to continuing operational<br />
inefficiency. It should be noted here that<br />
Hail Agri. Dev. Co. has been excluded<br />
due to its acquisition by <strong>Al</strong>marai Co., and<br />
Sadafco was excluded too because its<br />
fiscal year is different.<br />
Finally, it can be added that, with<br />
the increasing need for food, the<br />
companies operating in this sector<br />
seem to have good growth potentials,<br />
especially in the area of grain<br />
and dates. However, this will essentially<br />
depend on raising the productivity<br />
efficiency and increasing the marketing<br />
outlets.
Company<br />
Q3 (Net Profit, SAR)<br />
%<br />
9months (Net Profit, SAR)<br />
%<br />
EPS(9months)<br />
2008 2009 2008 2009 2008 2009<br />
SAVOLA Group 158,000,000 277,800,000 75.8% 666,000,000 683,000,000 2.6% 1.33 1.37<br />
Food 7,419,973 1,567,481 -78.9% 14,578,861 6,205,538 -57.4% 0.73 0.31<br />
<strong>Al</strong>marai 293,700,000 363,400,000 23.7% 691,100,000 847,900,000 22.7% 6.34 7.78<br />
Anaam Holding 720,000 914,000 26.9% 6,200,000 )1,200,000) - 0.57 )0.11)<br />
Halwani Bros 10,200,000 9,900,000 -2.9% 50,800,000 34,300,000 -32.5% 2.27 1.20<br />
NADEC 31,600,000 11,300,000 -64.2% 73,500,000 )9,900,000) - 1.23 )0.16)<br />
Qassim Agriculture 1,300,000 )1,800,000) - 1,520,000 )4,750,000) - 0.03 )0.10)<br />
Tabuk Agriculture )3,200,000) )1,600,000) -50.0% 19,000,000 8,300,000 -56.3% 0.95 0.42<br />
Saudi Fisheries )8,620,000) )7,430,000) -13.8% )18,370,000) )16,400,000) -10.7% )0.92) )0.82)<br />
Sharqiyah Agriculture )276,585) )1,968,639) -611.8% )3,202,357) )2,869,094) -10.4% )0.43) )0.38)<br />
Jouff Agriculture 13,600,516 16,835,620 23.8% 33,712,452 42,039,925 24.7% 1.69 2.10<br />
Jazan Development 11,185,982 699,275 -93.7% 23,604,211 1,494,705 -93.7% 0.47 0.03<br />
Sector * 515,629,886 669,617,737 29.9% 1,558,443,167 1,588,121,074 1.9% - -<br />
* Dose not include Sdafco profits.
Telecommunication & Information Technology<br />
The financial data for the Telecom and<br />
Information Technology sector shows<br />
that the sector’s net profits for the third<br />
quarter of the current year retreated by<br />
17.6 % YOY and stood at SR 2.4 billion.<br />
Similarly, the first nine months data also<br />
revealed a drop in net profits of 12.1%<br />
from SR11.2 billion to SR 9.8 billion.<br />
The sector’s companies performance<br />
shows that Saudi Telecom. (STC), the<br />
second largest listed company in the<br />
Saudi Stock Market, in terms of market<br />
cap., witnessed a drop in its net profits<br />
during the third quarter of 20% year-onyear<br />
to SR 2.4 billion. Moreover, its profits<br />
for the nine months period dropped by<br />
the same percentage to SR 7.9 billion.<br />
The Company attributed these declines<br />
to the capital investments carried out by<br />
its subsidiaries aiming at increasing their<br />
market shares in the countries where<br />
these companies have investments.<br />
STC’s explanation says nothing about<br />
why revenues in Q3 declined by 4.5%<br />
y-o-y Q3 after growth of 5.4% y-o-y in Q2<br />
– a result which continues to perplex us.<br />
STC announced that the number of its<br />
subscribers increased by 7% whereas the<br />
number of the broadband subscribers<br />
jumped by 38%. In addition, the number<br />
of third generation internet subscribers<br />
reached more than one million.<br />
Consequently, the total number of the<br />
broadband subscribers, both in the<br />
fixed-line wire and wireless categories,<br />
exceeded 2.3 million while the total<br />
number of active customers in the<br />
mobile segment exceeded 20 million.<br />
On the other hand, the financial data of<br />
the second mobile and internet operator,<br />
Etihad Etisalat Co. (Mobily), were better<br />
than expected as the Company managed<br />
to record strong growth in profits for the<br />
third quarter and growth for the first nine<br />
months of 50%. Mobily attributed this<br />
increase to the continuing rapid growth<br />
in the number of post-paid subscriptions<br />
and expansion in the coverage of the<br />
third generation service through the<br />
addition of new cities, which contributed<br />
significantly to increasing the number<br />
of mobile broadband and data services<br />
subscribers.<br />
The third service provider, Zain Co.,<br />
also incurred losses in the third quarter<br />
of the current year that exceeded its<br />
losses for the previous year by more<br />
than 26%, mainly caused by the growing<br />
operational expenses. The Company’s<br />
results for the nine months period have<br />
been excluded because there are no<br />
comparable periods.<br />
The sector’s growth rates and profit<br />
margins may be negatively affected<br />
now that reported mobile penetration<br />
has exceeded 150%. Therefore, STC<br />
is looking to achieve growth outside<br />
Saudi Arabia, while Mobily and Zain<br />
are hoping for further expansion in the<br />
mobile data segment in particular in<br />
order to maintain future growth.
Company<br />
Q3 (Net Profit, SAR)<br />
%<br />
9months (Net Profit, SAR)<br />
%<br />
EPS(9months)<br />
2008 2009 2008 2009 2008 2009<br />
SAUDI TELECOM CO 3,012,000,000 2,403,000,000 -20.2% 9,881,000,000 7,881,000,000 -20.2% 4.94 3.94<br />
ETIHAD ETISALAT 539,000,000 807,000,000 49.7% 1,314,000,000 1,962,000,000 49.7% 2.63 2.80<br />
ZAIN KSA )649,000,000) )820,000,000) -26.3% - - - - -<br />
Sector 2,902,000,000 2,390,000,000 -17.6% 11,195,000,000 9,843,000,000 -12.1% - -
Insurance<br />
Some of the listed insurance companies<br />
did not disclose their financial results<br />
for the third quarter, whereas others<br />
have no comparable data as they were<br />
recently established and listed. Out of<br />
25 listed companies, only 15 companies<br />
announced their quarterly results .These<br />
companies showed sharp increases in<br />
earnings, with aggregate Q3 net profit<br />
increasing more than 12 times yearon-year,<br />
bringing the sector’s total net<br />
profits to SR 132.3 million compared<br />
to SR 10.8 million. This in turn led to<br />
improvement in the sector’s nine months<br />
net profits which jumped by over 200%,<br />
to SR 190 million against SR 61.7 million<br />
in 2008.<br />
The big jump in the sector’s profits can<br />
be attributed to Tawuniya Co. (NCCI},<br />
the biggest listed company in this sector<br />
and the first to be licensed to carryon<br />
the insurance business in the Kingdom,<br />
whose profits leaped by about 275% yearon-year<br />
in the third quarter and by more<br />
than 91% for the nine months period,<br />
due to the big improvement in the<br />
investment returns. In addition, some of<br />
the newly established companies have<br />
reported some growth in their quarterly<br />
profits as they started achieving<br />
operating revenues after launching their<br />
business. For instance, Malath, Medgulf,<br />
Salama and Arabian Shield were able to<br />
grew by varying degrees. On the other<br />
hand, other insurance companies, such<br />
as the Saudi Indian Ins. Co., Gulf Union<br />
and <strong>Al</strong>-Ahlia, incurred losses due to a<br />
rise in the pre-operating expenses
Company<br />
Q3 (Net Profit, SAR)<br />
%<br />
9months (Net Profit, SAR)<br />
%<br />
EPS(9months)<br />
2008 2009 2008 2009 2008 2009<br />
NCCI 33,496,000 125,582,000 274.9% 101,856,000 194,845,000 91.3% 2.04 3.9<br />
MALATH )7,785,000) 1,005,000 - )13,170,000) 5,441,000 - )0.44) 0.18<br />
MEDGULF 3,295,000 36,284,000 100.2% 9,399,000 87,684,000 832.9% 0.12 1.1<br />
ALLIANZ SF )2,638,000) )3,251,000) -23.2% )12,220,000) )11,705,000) -4.2% )1.22) )1.17)<br />
SALAMA )786,000) 4,582,000 - 11,468,000 9,622,000 -16.1% 1.14 0.96<br />
WALAA INS )540,000) )2,309,000) -327.6% )2,111,000) )11,714,000) -454.9% )0.11) )0.59)<br />
ARABIAN SHIELD 1,542,000 2,389,000 54.9% 4,437,000 6,470,000 45.8% 0.22 0.32<br />
SABB TAKAFUL 368,000 )2,674,000) - )4,923,000) )13,442,000) -173.0% )0.23) )61)<br />
SANAD )4,123,803) )3,744,863) -9.2% )8,230,147) )11,471,887) -39.4% )0.49) )0.60)<br />
SAICO )1,804,000) )3,429,000) -90.1% )3,557,000) )7,421,000) -108.6% )0.36) )0.74)<br />
SAUDI INDIAN )2,530,000) )5,192,000) -105.2% )4,510,000) )15,817,000) -250.7% )0.45) )1.60)<br />
GULF UNION 963,000 )560,000) - 1,300,000 )1,115,000) - 0.06 )0.05)<br />
ALAHLI TAKAFUL )1,999,000) )1,599,000) -20.0% )4,870,000) )2,548,000) -47.7% )0.49) )0.25)<br />
AL AHLIA )979,000) )9,603,000) -880.9% )2,677,000) )21,222,000) -692.8% )0.27) )2.12)<br />
ACIG )5,651,000) )5,175,000) -8.4% )10,462,000) )17,555,000) -67.8% )1.05) )1.76)<br />
Sector 10,828,197 132,305,137 1121.9% 61,729,853 190,051,113 207.9% - -
Multi- Investment<br />
The financial announcements of the third quarter results for the Multi Investment Sector companies showed that the sector’s<br />
aggregate net profits increased fourfold year-on-year, raising the aggregate net profit to SR 135 million. However, the nine months<br />
period financial results exhibited a sharp decline of 65% in profits.<br />
There is no doubt that the improvement in the quarter results is mainly due to Asser Trading, Tourism & Manufacturing Co. (Assir)<br />
which turned to generate profits after incurring losses of SR 160 million in Q3 2008 due to investment losses. During Q3 of the current<br />
year, the Company managed to generate profits to the tune of SR 15 million. Similarly, the Saudi Advanced Industries Co. (Saudi<br />
Advanced) recorded strong growth in its 9 months profits of more than 120% resulting from the increase in the revenues of companies<br />
invested in. The Saudi Advanced is the only company in the sector that reported net profit growth for the third quarter.<br />
For the nine months period, the sharp decline in the profits of the Kingdom Holding Company (Kingdom), which contracted by 77%,<br />
negatively affected the overall sector’s results. The Company is still suffering from the low dividend distributions from its investments,<br />
in addition to the declining operational revenues from the Hotels segment.<br />
It is difficult to predict the outlook for the Multi Investment Sector companies as their activities vary from one company to another,<br />
and consequently the factors influencing these companies differ. However, in general, it can be stated that, any improvement in the<br />
sector’s results will be dependent on the results to be achieved by Kingdom Holding, considering its heavy weight and its influence,<br />
not only on the Multi-Investment sector, but also on the overall market.
Company<br />
Q3 (Net Profit, SAR)<br />
%<br />
9months (Net Profit, SAR)<br />
%<br />
EPS(9months)<br />
2008 2009 2008 2009 2008 2009<br />
SARCO )379,776) 632,528 - 106,824,629 1,008,245 -99.1% 7.12 0.07<br />
Saudi Advanced 4,746,146 10,457,013 120.3% 17,488,959 28,613,623 63.6% 0.4 0.66<br />
<strong>Al</strong> Ahsa for Dev. )44,300,000) 4,600,000 - )30,500,000) 5,800,000 - )0.62) 0.12<br />
SISCO 1,036,455 783,732 -24.4% 1,672,990 )514,997) - 0.04 )0.008)<br />
Assir )159,000,000) 15,000,000 - )219,000,000) 49,000,000 - )1.73) 0.39<br />
<strong>Al</strong> Baha )1,542,337) )914,593) -40.7% )4,753,619) )3,648,565) -23.2% )0.32) )0.24)<br />
Kingdom 226,500,000 104,800,000 -53.7% 1,065,000,000 247,100,000 -76.8% 0.17 0.04<br />
Sector 27,060,488 135,358,680 400.2% 936,732,959 327,358,306 -65.1% - -
Industrial Investment<br />
The third quarter 2009 preliminary results, for the Industrial<br />
Investment sector, revealed growth in its net profits of 1.4%<br />
over the same period of the previous year to SR 340 million.<br />
However, for the nine months period, it recorded a decline<br />
of 6.6%, dragging the sector’s net profits to SR 487.6 million,<br />
from SR 505.9 million in the previous year.<br />
The third quarter financial data for the Saudi Chemical<br />
Company showed a significant growth in its profits by more<br />
than 133% compared with the same period of the previous<br />
year. The Company also achieved a growth in its profits of<br />
67.4% for the first nine months of the year to SR 236 million.<br />
It worth mentioning here that the Co. has recorded nonoperational<br />
profits to the tune of SR 48 million resulting<br />
from the settlement of terminating the Panadol Dist<br />
.Agreement with its subsidiary SITCO Pharma. The Saudi<br />
Paper Manufacturing Company ranked second in terms of<br />
quarterly profit growth as it staged growth in its net profit<br />
of nearly 50% due to improvement in its sales. However, its<br />
profits for the nine months period declined by about 6% as a<br />
consequence of an increase in the administrative, marketing<br />
and financing expenses. On the other hand, the National<br />
Metal Manufacturing & Casting Co.(Maadaniyah), topped the<br />
companies with falling quarterly profits as its net profits for<br />
the third quarter dipped by more than 67% whereas its nine<br />
months period profits declined by about 85%, mainly due to<br />
the fall in sales. The Saudi Industrial Export Co. followed suit<br />
and incurred losses in this quarter as well as during the nine<br />
months period, being the only company to record losses in the<br />
sector. Its losses are mainly due to the decline in sales resulting<br />
from the sharp fall in the prices of some products such as iron,<br />
fertilizers and chemical & manufacturing products, especially<br />
in the Chinese and Indian markets where the Company was<br />
not awarded any contracts during this year.
Company<br />
Q3 (Net Profit, SAR)<br />
%<br />
9months (Net Profit, SAR)<br />
%<br />
EPS(9months)<br />
2008 2009 2008 2009 2008 2009<br />
BCI 10,817,145 14,851,419 37.3% 29,435,882 43,868,435 49.0% 1.07 1.59<br />
MA’ADEN 64,000,000 49,000,000 -23.4% 82,000,000 61,000,000 -25.6% 0.14 0.07<br />
Astra Indust 53,900,000 54,200,000 0.6% 160,100,000 154,200,000 -3.7% 2.5 2.1<br />
Pharmaceutical 15,600,000 15,800,000 1.3% 90,800,000 96,300,000 6.1% 1.5 1.6<br />
Glass 22,100,000 9,900,000 -55.2% 67,200,000 40,900,000 -39.1% 2.69 1.64<br />
FIPCO 6,900,000 4,020,000 -41.7% 15,300,000 15,300,000 0.0% 2.23 2.23<br />
Maadaniyah 21,300,000 6,990,000 -67.2% 67,180,000 10,210,000 -84.8% 2.63 0.4<br />
Saudi Chemical 45,000,000 105,000,000 133.3% 141,000,000 236,000,000 67.4% 2.24 3.73<br />
Saudi Paper 16,500,000 24,670,000 49.5% 62,570,000 66,450,000 6.2% 2.09 2.21<br />
<strong>Al</strong>Abdullatif 71,630,000 57,080,000 -20.3% 173,250,000 128,920,000 -25.6% 2.13 1.59<br />
Saudi Export 7,600,000 )1,500,000) - 21,000,000 )3,300,000) - 1.95 )0.31)<br />
Sector 335,347,145 340,011,419 1.4% 487,621,864 505,906,684 -6.6% - -
Building & Construction<br />
The third quarter results showed that net profits for the Building<br />
and Construction Sector’s companies plunged by 52% year-onyear<br />
in Q3, while net profits for the first nine months dipped by<br />
more than 48%.<br />
It is to be noted here that, although none of the sector’s<br />
companies reported quarterly losses, the majority of companies<br />
registered noticeable decline in realized profits. Mohammed<br />
<strong>Al</strong> Mojil Group Company (MMG) saw the biggest decline, as its<br />
profits for the third quarter tumbled by more than 93%, while<br />
its 9 months profits dropped by a similar percentage (YOY), due<br />
to the decline in the contracts revenues and the increase in the<br />
amounts of the doubtful claims. Saudi Cable Company (Cables)<br />
followed MMG with a decline in its profits for the third quarter<br />
and the nine months period of 78% and 57% respectively due<br />
to a drop in sales and contracts revenues. In contrast, the Saudi<br />
Ceramic Co. reported net profits growth in the third quarter and<br />
the first nine months of 6% and 4% respectively, thanks to the<br />
improvement in the Company’s sales and production. Similarly,<br />
the financials of Saudi Industrial Dev. Co. (Saudi Industrial),<br />
improved as it shifted to registering profits in the third quarter<br />
against realized losses in the same quarter of the previous<br />
year, which helped to reduce the 9 months losses by more than<br />
82% compared with the same period of 2008. This is due to the<br />
improvement in the profits margin in addition to the fact that<br />
the preceding year’s results contained investment losses.
Company<br />
Q3 (Net Profit, SAR)<br />
%<br />
9months (Net Profit, SAR)<br />
%<br />
EPS(9months)<br />
2008 2009 2008 2009 2008 2009<br />
MMG 203,800,000 13,900,000 -93.2% 534,000,000 30,800,000 -94.2% 4.27 0.25<br />
Saudi Steel Pipe 41,500,000 28,200,000 -32.0% 126,900,000 92,200,000 -27.3% 3.63 2.29<br />
Ceramic 49,800,000 52,800,000 6.0% 139,900,000 146,000,000 4.4% 5.60 5.84<br />
Gypsum 29,000,000 23,530,000 -19.5% 89,990,000 76,260,000 -15.3% 2.84 2.41<br />
Cables 92,300,000 20,100,000 -78.2% 263,200,000 113,600,000 -56.8% 3.46 1.94<br />
Saudi Industrial )4,900,000) 131,000 - )9,240,000) )1,650,000) -82.1% )0.23) )0.04)<br />
Amiantit 98,100,000 72,400,000 -26.2% 214,800,000 160,900,000 -25.1% 1.86 1.39<br />
Pipes 27,000,000 8,000,000 -70.4% 107,410,000 24,430,000 -77.3% 3.41 0.78<br />
Zamil Industrial 81,700,000 53,800,000 -34.1% 205,100,000 166,100,000 -19.0% 4.56 3.69<br />
AL Babtain 28,200,000 28,500,000 1.1% 101,000,000 84,100,000 -16.7% 2.49 2.08<br />
Saudi vitrified clay<br />
pipes<br />
11,100,000 10,200,000 -8.1% 34,700,000 23,800,000 -31.4% 2.32 1.58<br />
MESC 21,400,000 13,200,000 -38.3% 121,700,000 69,300,000 -43.1% 3.04 1.73<br />
Red Sea 49,190,000 24,420,000 -50.4% 172,760,000 100,790,000 -41.7% 5.76 3.36<br />
Sector 728,190,000 349,001.000 -52.0% 2,102,220,000 1,086,630,000 -48.3% - -
Real Estate Development<br />
The decline in Dar <strong>Al</strong> Arkan Company’s profits for the third<br />
quarter negatively affected the aggregate profits for the<br />
Real Estate development sector. Consequently, net profits<br />
over Q3 and the first nine months dropped by 18% and 14%<br />
respectively due to the recession in the real estate activity<br />
that dominated throughout the year.<br />
At the individual companies’ level, Dar <strong>Al</strong>-Arkan Co., the<br />
biggest company in this sector, witnessed a yea-on-year<br />
decline in its third quarter and first nine months profits of<br />
14% and 11% respectively, adversely affected by the state<br />
of uncertainty that prevailed in the previous period. Profit<br />
for the other real estate companies retreated by varying<br />
degrees, except Arriyadh Development Co. which reported<br />
profit growth of 10% year-on-year for the third quarter as<br />
well as the first nine months as a result of the growth in the<br />
Company’s operation and leasing segment.<br />
The Real Estate Sector is now aspiring to be re-organized<br />
through the new regulations (governing Real Estate<br />
Mortgage, Real Estate Financing and Lease Financing) which<br />
are expected to be approved in the near future and which<br />
are anticipated to be a positive development, both at the<br />
legislation level as well as at the level of linking the real estate<br />
market to the banking system. This new arrangement will<br />
create new systems that will allow the investors to enter the<br />
real estate market efficiently. Moreover, this will represent a<br />
good mechanism that will help to achieve growth in supply<br />
and demand and provide wider chances to real estate dealers<br />
to find financing channels.
Company<br />
Q3 (Net Profit, SAR)<br />
%<br />
9months (Net Profit, SAR)<br />
%<br />
EPS(9months)<br />
2008 2009 2008 2009 2008 2009<br />
Real Estate 31,400,000 19,700,000 -37.3% 104,700,000 72,000,000 -31.2% 0.87 0.6<br />
Taiba 29,431,870 15,191,823 -48.4% 128,148,658 46,363,018 -63.8% 0.85 0.31<br />
Arriyadh<br />
Development<br />
21,800,000 24,000,000 10.1% 61,000,000 69,000,000 13.1% 0.61 0.69<br />
Emaar E .C )181,787) )63,525) -65.1% )241,524) )238,975) -1.1% )0.28) )0.28)<br />
Jabal Omar 7,900,000 )9,600,000) - )34,300,000) )21,500,000) -37.3% )5.1) )3.2)<br />
Dar <strong>Al</strong> Arkan 719,500,000 616,200,000 -14.4% 1,859,800,000 1,658,900,000 -10.8% 1.72 1.54<br />
Sector 809,850,083 665,428,298 -17.8% 2,119,107,134 1,824,524,043 -13.9% - -
Transport<br />
The third quarter preliminary financial results for the Transport<br />
sector showed that the sector’s net profits retreated by about<br />
74% to SR 87 million, compared with SR 334 million in Q3<br />
2008. Likewise, the sector’s net profits for the first nine months<br />
declined by more than 46% to SR 373 million from SR 699 million<br />
in the previous year. This retreat is due to the sharp drop in<br />
the profits of the National Shipping Company of Saudi Arabia<br />
(NSCSA), which constitute the biggest percentage of the sector’s<br />
overall profits.<br />
Viewing NSCSA’s profits shows that net profits declined by more<br />
than 80% during the third quarter and by 52% during the first<br />
nine months. The Company attributed these declines to the<br />
low crude oil transport rates in the spot market which in turn<br />
were affected by many factors, such as the decline in the global<br />
demand for oil, the increase in the tonnage capacity due to the<br />
entrance of new oil tankers to the market, and the decline in<br />
the prices and volumes of general goods as a consequence of<br />
the decline in the world trade activity. However, the Company’s<br />
share of profits in Better Deck (30.3% owned) grew in the first nine<br />
months because of improvement in the liquid gas trade markets.<br />
Moreover, the chemicals transport segment, represented in<br />
the National Chemical Carrier (80% shareholding), witnessed<br />
positive improvement due to capital gains.<br />
It worth mentioning the company’s announcement that it<br />
has already received six very large crude carriers (VLCC)<br />
which were contracted in 2006, raising NSCSA’s fleet to 17<br />
crude carriers, placing the company amongst the top VLCC<br />
owners in the world. This should reinforce the company’s<br />
competitive strength in the markets and help it to benefit<br />
from the improvement in prices when the world economy<br />
recovers.<br />
Saudi Transport and Investment Co. (Mubarrad) was the<br />
only one of the sector’s companies to record growth during<br />
the third quarter, of 41.7%, due to the upturn in its core<br />
business revenues and the generation of investment<br />
revenues. However, the company’s financial results for the<br />
nine months period showed a 50% drop in net income. Net<br />
profit for the Saudi Public Transport Co. (Saptco) plunged by<br />
75% for the third quarter because the company’s business<br />
had been adversely affected by the spread of H1N1 Flu, in<br />
addition to the fact that the previous year results contained<br />
investment profits. Finally, the net profits for the United<br />
International Transportation Co. ( Budget Saudi) declined<br />
by 12% for the third quarter and by 2% for the nine months<br />
period as a consequence of the drop in the operational<br />
revenues.
Company<br />
Q3 (Net Profit, SAR)<br />
%<br />
9months (Net Profit, SAR)<br />
%<br />
EPS(9months)<br />
2008 2009 2008 2009 2008 2009<br />
Shipping 282,200,000 56,000,000 -80.2% 653,900,000 314,700,000 -51.9% 2.08 1.0<br />
SAPTCO 24,600,000 6,000,000 -75.6% )29,900,000) )10,100,000) -66.2% )0.24) )0.08)<br />
Mubarrad 2,280,000 3,230,000 41.7% 10,040,000 5,040,000 -49.8% 0.56 0.28<br />
Budget Saudi 24,949,438 21,918,738 -12.1% 64,747,680 63,308,772 -2.2% 3.54 3.46<br />
Sector 334,029,438 87,148,738 -73.9% 698,787,680 372,948,772 -46.6% - -
Media & Publishing<br />
The Media & Publishing sector has been affected by the international economic crisis, which has driven a contraction of the advertising<br />
activity. Hence the 74.3% drop in the sector’s profits in the third quarter to SR 20.9 million. Consequently, the sector’s net profit for the<br />
first nine months dropped by more than 73%.<br />
The Saudi Research and Marketing Group (SRMG) topped the sector’s companies in terms of the decline in seasonal profits as its<br />
net profit dipped by more than 90% due to a host of factors including declining advertising revenues, non-recurring expenses and<br />
the decline in profits of the Saudi Printing and Packaging Co, in which SRMG holds a 42% stake. For the nine months period, the<br />
Company’s profits dropped by more than 80%. Profitability is generally expected to improve during the last quarter of the year due to<br />
the award of printing contracts for school books.<br />
Other companies in the sector also saw earnings decline as the Q3 profits for Tihama Advertising & Public Relations Co. and the Saudi<br />
Printing and Packaging Co. fell by 52% and 61% respectively. It is to be noted here that the fiscal year for Tihama Co. ends on March 31,<br />
therefore it was excluded from the total, as it does not fit for comparison.
Company<br />
Q3 (Net Profit, SAR)<br />
%<br />
9months (Net Profit, SAR)<br />
%<br />
EPS(9months)<br />
2008 2009 2008 2009 2008 2009<br />
Tihama* 8,500,000 4,100,000 -51.8% - - - 0.96 0.49<br />
SRMG 35,900,000 3,300,000 -90.8% 181,700,000 34,500,000 -81.0% 2.27 0.43<br />
SPPC 45,500,000 17,600,000 -61.3% 111,900,000 44,700,000 -60.1% 1.86 0.74<br />
Sector ** 81,400,000 20,900,000 -74.3% 293,600,000 79,200,000 -73.0% - -<br />
* Represents the net profits for the 2nd ending Sep.30<br />
** Does not include Tihama profits.
Hotel & Tourism<br />
The third quarter profits for the current year for the Hotels & Tourism sector dipped by 59% to SR 14.2 million, compared to SR<br />
34.6 million for the corresponding quarter of 2008. This decline is attributable mainly to a decrease of over 50% in the profits<br />
of the Saudi Hotels& Resort Areas Co., to SR 14.6 million. The Company explained the decline as resulting from a drop in Umrah<br />
season revenues due to the spread of H1N1 flu, plus renovation works and refurbishment of some of its hotels. The Tourism<br />
Enterprises Co. continued its losses and lost by more than SR 400, 000.<br />
Viewing the sector’s performance during the first nine month of this year, reveals that it achieved net profits of SR 360.5 million,<br />
up by 296% from SR91.1 million in the corresponding period of the previous year. The growth in the sector’s profits was driven<br />
mainly by the Hotels Co. which witnessed a threefold leap in its profits for the 9 months period to SR 361 million. However,<br />
these profits resulted partly from non-operating capital gains of SR291 million arising in the second quarter from the sale of the<br />
Company’s stake in <strong>Al</strong>khalej Village. When we exclude these capital gains, profits for the nine months for the company would<br />
have fallen by 22%.<br />
Despite these bad results, this sector has good growth prospects, especially after the organizational and supervisory<br />
development extended to it by the Supreme Tourism Authority and the offering of loans to the tourism projects by the government<br />
lending funds.
Company<br />
Q3 (Net Profit, SAR)<br />
%<br />
9months (Net Profit, SAR)<br />
%<br />
EPS(9months)<br />
2008 2009 2008 2009 2008 2009<br />
Hotels 33,700,000 14,600,000 -56.7% 89,600,000 360,900,000 302.8% 1.3 5.23<br />
Shams 902,042 )423,352) - 1,451,237 )377,726) - 0.14 )0.04)<br />
Sector 34,602,042 14,176,648 -59.0% 91,052,37.0 360,522,274 296.0% - -
Contact Details<br />
Hesham AL-Muhanna<br />
Investment Analyst<br />
muhannahm@alrajhi-capital.com<br />
Tel:+966 1 2119271<br />
Dr. Saleh <strong>Al</strong>suhaibani<br />
Head of Research<br />
alsuhaibanis@alrajhi-capital.com<br />
Tel: No.: +966 1 2119434<br />
<strong>Al</strong> <strong>Rajhi</strong> <strong>Capital</strong>.<br />
Research Dept<br />
P.O. Box 5561, Riyadh 11432,<br />
Saudi Arabia<br />
Tel:+966 1 2119271<br />
Fax: +966 1 2119308<br />
research@alrajhi-capital.com<br />
Disclaimer<br />
Information and views expressed in this report are subject to change without notice. While proper care has been taken<br />
in the preparation of this report, we do not represent that the information contained herein is accurate, complete or<br />
free of any errors. As such, <strong>Al</strong> <strong>Rajhi</strong> <strong>Capital</strong> or its employees cannot be held liable for any losses arising from the use of<br />
this document. This report is prepared for your information from the sources believed to be reliable and is not an offer<br />
to buy or sell security or enter into any agreement. <strong>Al</strong> <strong>Rajhi</strong> <strong>Capital</strong>, its affiliates, subsidiaries and employees may have<br />
a position in the financial instruments mentioned in this report. This document or its content is not to be distributed<br />
in jurisdictions outside the Kingdom of Saudi Arabia where its distribution is restricted by law.<br />
<strong>Al</strong> <strong>Rajhi</strong> <strong>Capital</strong>. is licensed by the Saudi Arabian <strong>Capital</strong> Market Authority #7068/ 37
www.alrajhi-capital.com