<strong>Executive</strong> <strong>Summary</strong> The financial results of companies listed in the Saudi stock market were negatively affected in Q3 2009 by a combination of many factors, which resulted from the international financial crisis. The major factors included the sharp decline in oil prices at the end of 2008 and beginning of 2009, the accelerating deterioration in the prices of goods and the economic recession that hit most of the global markets. Looking into aggregate net profits, we find that they retreated during the third quarter of the current year by approximately 27% year-on-year to SR 17.4 billion compared with SR 23.7 billion. Likewise, the net profits of the listed companies in the Saudi stock market for the first nine months, dropped by about 36% year-on-year to SR 45.9 billion, compared with SR 71.5 billion. Analysis of the market sectors in terms of growth during the third quarter, shows that the Insurance sector ranked first as its net profits grew very sharply by 1100% to SR 132.3 billion, followed by the Multi Investment sector with growth of 400% to SR 135.4 billion. On the other hand, the Media & Publishing and Transport sectors headed the losers list as they declined by 74.3 % and 73.9% respectively. For the nine months period, the Hotels & Tourism sector topped the gainers list, rising by 300%, followed by the Insurance sector which gained by 208%. The top losers’ list was dominated by the Petrochemical Sector, which sank by 80%, followed closely by the Media and Publishing sector, which fell by 73%.The National Co. for Co-operative Insurance ranked first on the top gainers list for the third quarter and grew by more than 274% while Medgulf Insurance Co. headed the gainers list for the nine months period with handsome growth of 833%. The performance of the Saudi stock market during the third quarter was positive as it gained by about 13% .This performance was supported by the rise in the oil prices to their highest level in a year. Moreover, the solidity of the Banking sector and its high creditworthiness helped to reinforce investors’ confidence. We believe that corporate results, particularly in the influential Petrochemicals sector, will improve when any signs of improvement in the global economy appear in the horizon. Sector Q3 (Net Profit, SAR) % 9months (Net Profit, SAR) 2008 2009 2008 2009 Banks & Financial 6,085,800,000 6,146,200,000 1.00% 19,373,300,000 18,868,400,000.00 -2.60% Petrochemical Industries 9,357,978,710 3,686,123,334 -60.60% 26,818,736,528 5,410,197,376 -79.80% Cement 787,053,622 813,831,828 3.40% 3,274,621,842 2,896,770,768 -11.50% Retail Sector 140,969,743 159,227,950 13.00% 487,621,864 505,906,684 3.70% Energy & Utilities 1,527,200,000 1,769,100,000 15.80% 1,618,000,000 1,735,400,000 7.30% Agriculture & Food Industries 515,629,886 669,617,737 29.9% 1,558,443,167 1,588,121,074 1.9% Telecommunication & Information Technology 2,902,000,000 2,390,000,000 -17.6% 11,195,000,000 9,843,000,000 -12.1% Insurance 10,828,197 132,305,137 1121.9% 61,729,853 190,051,113 207.9% Multi-Investment 27,060,488 135,358,680 400.20% 936,732,959 327,358,306 -65.10% Industrial Investment 335,347,145 340,011,419 1.40% 487,621,864 505,906,684 -6.60% Building & Construction 728,190,000 349,001.00 -52.00% 2,102,220,000 1,086,630,000 -48.30% Real Estate Development 809,850,083 665,428,298 -17.80% 2,119,107,134 1,824,524,043 -13.90% Transport 334,029,438 87,148,738 -73.90% 698,787,680 372,948,772 -46.60% Media and Publishing 81,400,000 20,900,000 -74.30% 293,600,000 79,200,000 -73.00% Hotel & Tourism 34,602,042 14,176,648 -59.00% 91,052,37.0 360,522,274 296.00% MARKET 23,677,939,354 17,378,430,769 -26.60% 71,538,788,146 45,938,878,845 -35.80% %
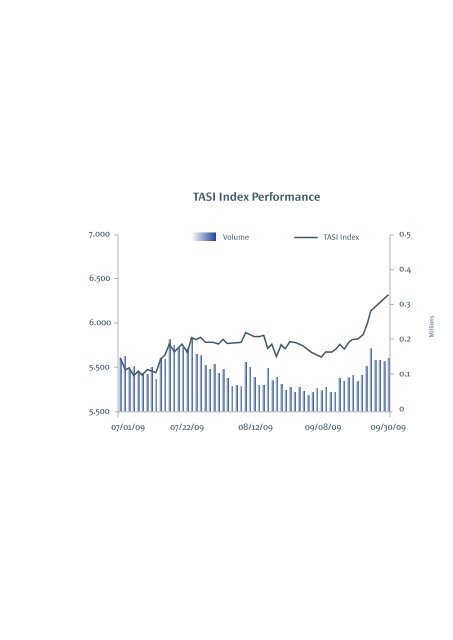
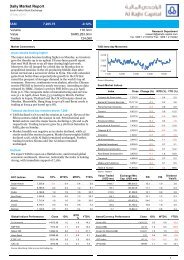
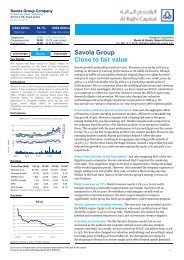
7.000 Volume TASI Index 0.5 6.500 6.000 5.500 5.500 TASI Index Performance 07/01/09 07/22/09 08/12/09 09/08/09 09/30/09 0.4 0.3 0.2 0.1 0 Millions