Executive Summary - Al Rajhi Capital - الراجØÙŠ الماليه
Executive Summary - Al Rajhi Capital - الراجØÙŠ الماليه
Executive Summary - Al Rajhi Capital - الراجØÙŠ الماليه

You also want an ePaper? Increase the reach of your titles
YUMPU automatically turns print PDFs into web optimized ePapers that Google loves.
<strong>Executive</strong> <strong>Summary</strong><br />
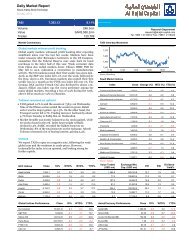
The financial results of companies listed in the Saudi stock market were negatively affected in Q3 2009 by a combination of many<br />
factors, which resulted from the international financial crisis. The major factors included the sharp decline in oil prices at the end<br />
of 2008 and beginning of 2009, the accelerating deterioration in the prices of goods and the economic recession that hit most of<br />
the global markets. Looking into aggregate net profits, we find that they retreated during the third quarter of the current year by<br />
approximately 27% year-on-year to SR 17.4 billion compared with SR 23.7 billion. Likewise, the net profits of the listed companies<br />
in the Saudi stock market for the first nine months, dropped by about 36% year-on-year to SR 45.9 billion, compared with SR 71.5<br />
billion.<br />
Analysis of the market sectors in terms of growth during the third quarter, shows that the Insurance sector ranked first as its net<br />
profits grew very sharply by 1100% to SR 132.3 billion, followed by the Multi Investment sector with growth of 400% to SR 135.4<br />
billion. On the other hand, the Media & Publishing and Transport sectors headed the losers list as they declined by 74.3 % and<br />
73.9% respectively. For the nine months period, the Hotels & Tourism sector topped the gainers list, rising by 300%, followed by<br />
the Insurance sector which gained by 208%. The top losers’ list was dominated by the Petrochemical Sector, which sank by 80%,<br />
followed closely by the Media and Publishing sector, which fell by 73%.The National Co. for Co-operative Insurance ranked first on<br />
the top gainers list for the third quarter and grew by more than 274% while Medgulf Insurance Co. headed the gainers list for the<br />
nine months period with handsome growth of 833%.<br />
The performance of the Saudi stock market during the third quarter was positive as it gained by about 13% .This performance<br />
was supported by the rise in the oil prices to their highest level in a year. Moreover, the solidity of the Banking sector and its<br />
high creditworthiness helped to reinforce investors’ confidence. We believe that corporate results, particularly in the influential<br />
Petrochemicals sector, will improve when any signs of improvement in the global economy appear in the horizon.<br />
Sector<br />
Q3 (Net Profit, SAR)<br />
%<br />
9months (Net Profit, SAR)<br />
2008 2009 2008 2009<br />
Banks & Financial 6,085,800,000 6,146,200,000 1.00% 19,373,300,000 18,868,400,000.00 -2.60%<br />
Petrochemical Industries 9,357,978,710 3,686,123,334 -60.60% 26,818,736,528 5,410,197,376 -79.80%<br />
Cement 787,053,622 813,831,828 3.40% 3,274,621,842 2,896,770,768 -11.50%<br />
Retail Sector 140,969,743 159,227,950 13.00% 487,621,864 505,906,684 3.70%<br />
Energy & Utilities 1,527,200,000 1,769,100,000 15.80% 1,618,000,000 1,735,400,000 7.30%<br />
Agriculture & Food Industries 515,629,886 669,617,737 29.9% 1,558,443,167 1,588,121,074 1.9%<br />
Telecommunication &<br />
Information Technology<br />
2,902,000,000 2,390,000,000 -17.6% 11,195,000,000 9,843,000,000 -12.1%<br />
Insurance 10,828,197 132,305,137 1121.9% 61,729,853 190,051,113 207.9%<br />
Multi-Investment 27,060,488 135,358,680 400.20% 936,732,959 327,358,306 -65.10%<br />
Industrial Investment 335,347,145 340,011,419 1.40% 487,621,864 505,906,684 -6.60%<br />
Building & Construction 728,190,000 349,001.00 -52.00% 2,102,220,000 1,086,630,000 -48.30%<br />
Real Estate Development 809,850,083 665,428,298 -17.80% 2,119,107,134 1,824,524,043 -13.90%<br />
Transport 334,029,438 87,148,738 -73.90% 698,787,680 372,948,772 -46.60%<br />
Media and Publishing 81,400,000 20,900,000 -74.30% 293,600,000 79,200,000 -73.00%<br />
Hotel & Tourism 34,602,042 14,176,648 -59.00% 91,052,37.0 360,522,274 296.00%<br />
MARKET 23,677,939,354 17,378,430,769 -26.60% 71,538,788,146 45,938,878,845 -35.80%<br />
%