A systematic approach to quality function deployment with a full ...
A systematic approach to quality function deployment with a full ...
A systematic approach to quality function deployment with a full ...

You also want an ePaper? Increase the reach of your titles
YUMPU automatically turns print PDFs into web optimized ePapers that Google loves.
Available online at www.sciencedirect.com<br />
Omega 33 (2005) 119 – 139<br />
www.elsevier.com/locate/dsw<br />
A <strong>systematic</strong> <strong>approach</strong> <strong>to</strong> <strong>quality</strong> <strong>function</strong> <strong>deployment</strong> <strong>with</strong> a<br />
<strong>full</strong> illustrative example<br />
Lai-Kow Chan ∗ , Ming-LuWu<br />
Department of Management Sciences, City University of Hong Kong, 83 Tat Chee Avenue, Kowloon, Hong Kong<br />
Received 22 June 2001; accepted 23 March 2004<br />
Abstract<br />
This paper presents a <strong>systematic</strong> and operational <strong>approach</strong> <strong>to</strong> <strong>quality</strong> <strong>function</strong> <strong>deployment</strong> (QFD), a cus<strong>to</strong>mer-driven<br />
<strong>quality</strong> management system for product development. After a comprehensive description of the relevant elements in house<br />
of <strong>quality</strong> (HOQ), the rst and most in uential phase of the QFD system, a 9-step model is proposed <strong>to</strong> help build such<br />
an HOQ. A number of 9-point scales are developed whose uses could help unify the various measurements in HOQ <strong>to</strong><br />
avoid arbitrariness. Special attention is paid <strong>to</strong> the various subjective assessments in the HOQ process, and symmetrical<br />
triangular fuzzy numbers (STFNs) are suggested for use <strong>to</strong> capture the vagueness in people’s linguistic assessments. Instead<br />
of using the quite subjective sales-point concept, entropy method is introduced <strong>to</strong> conduct competitive analysis and derive<br />
competitive priority ratings. A thorough explanation is given <strong>to</strong> address the concepts, computations and implementations<br />
in the proposed HOQ model, followed by a <strong>full</strong> example for a fried Chinese vegetable <strong>to</strong> illustrate step by step all the<br />
relevant details <strong>with</strong> the purpose of facilitating the understanding and application of the QFD process. Two di cult parts<br />
omitted from our model, especially the correlation matrices, are discussed in some detail nally, and possible <strong>approach</strong>es<br />
are also suggested <strong>to</strong> deal <strong>with</strong> them in a potentially more complete HOQ model.<br />
? 2004 Elsevier Ltd. All rights reserved.<br />
Keywords: Quality <strong>function</strong> <strong>deployment</strong>; House of <strong>quality</strong>; Measurement scale; Symmetrical triangular fuzzy number; Entropy<br />
1. Introduction<br />
Quality <strong>function</strong> <strong>deployment</strong> (QFD) is “a system <strong>to</strong> assure that cus<strong>to</strong>mer needs drive the product design and production<br />
process” (Ref. [1]). Typically, a QFD system can be broken down in<strong>to</strong> four inter-linked phases <strong>to</strong> <strong>full</strong>y deploy the cus<strong>to</strong>mer<br />
needs phase by phase (Refs. [1–5]). In QFD, each phase’s important outputs (HOWs), generated from the phase’s inputs<br />
(WHATs), are converted in<strong>to</strong> the next phase as its inputs (new WHATs). So each phase can be described by a matrix<br />
of “WHATs” and “HOWs”, which is easy and convenient <strong>to</strong> deal <strong>with</strong> in practice. The four QFD phases include: Phase<br />
I <strong>to</strong> translate cus<strong>to</strong>mer needs in<strong>to</strong> product design attributes which we will call technical measures; Phase II <strong>to</strong> translate<br />
important technical measures in<strong>to</strong> parts characteristics; Phase III <strong>to</strong> translate important parts characteristics in<strong>to</strong> process<br />
operations; and Phase IV <strong>to</strong> translate key process operations in<strong>to</strong> day <strong>to</strong> day production requirements.<br />
The rst phase of QFD, usually called house of <strong>quality</strong> (HOQ), is of fundamental and strategic importance in the QFD<br />
system, since it is in this phase that the cus<strong>to</strong>mer needs for the product are identi ed and then, incorporating the producing<br />
company’s competitive priorities, converted in<strong>to</strong> appropriate technical measures <strong>to</strong> ful ll the needs. In other words, HOQ<br />
∗ Corresponding author. Tel.: +852-2788-8550; fax: +852-2788-9891.<br />
E-mail address: fblkchan@cityu.edu.hk (L.-K. Chan).<br />
0305-0483/$ - see front matter ? 2004 Elsevier Ltd. All rights reserved.<br />
doi:10.1016/j.omega.2004.03.010
120 L.-K. Chan, M.-L. Wu / Omega 33 (2005) 119 – 139<br />
links the “voice of the cus<strong>to</strong>mer” <strong>to</strong> the “voice of the technician” through which process and production plans can be<br />
developed in the other phases of the QFD system. The structures and analyzing methods of the other three QFD phases<br />
are essentially the same as the rst one, so we will study the HOQ phase only. In fact, most QFD studies focus mainly<br />
on its rst phase (for exceptions, see Refs. [1,3,5]).<br />
A house of <strong>quality</strong> (HOQ) involves the collection and analysis of the “voice of the cus<strong>to</strong>mer” which includes the<br />
cus<strong>to</strong>mer needs for a product, cus<strong>to</strong>mers’ perceptions on the relative importance of these needs and the relative performance<br />
of the producing company and its main competi<strong>to</strong>rs on the needs. It also requires the generation and analysis of the “voice<br />
of the technician” which includes the technical measures converted from the cus<strong>to</strong>mer needs, technicians’ evaluations on<br />
the relationship between each cus<strong>to</strong>mer need and each technical measure, and the performance of the relevant companies<br />
in terms of these technical measures. With such a large amount of information <strong>to</strong> be collected and processed, building<br />
an HOQ may be <strong>to</strong>o complex <strong>to</strong> be complete and comparable. Systematization of the HOQ process is thus a necessity.<br />
Many studies have been done (Refs. [1–9]) and a number of QFD information systems have also been proposed (e.g.,<br />
Refs. [10,11]) <strong>to</strong>wards this purpose. However, most of these works are incomplete in the sense that either they do not<br />
contain all the important elements of HOQ or their quanti cations are not very satisfac<strong>to</strong>ry.<br />
On the other hand, most information involved in the HOQ process is generated from human beings’ perceptions and<br />
linguistic assessments that are quite subjective and vague. Both the “voice of the cus<strong>to</strong>mer” and the “voice of the<br />
technician” contain ambiguity and multiplicity of meaning. “Cus<strong>to</strong>mer need #1 is very important”, “technical measure<br />
#2 has weak relationship <strong>with</strong> cus<strong>to</strong>mer need #3” and “company #4 performs well on cus<strong>to</strong>mer need #5” are examples<br />
of these “voices” which are imprecise in terms of breadth of meaning. E orts should therefore be made <strong>to</strong> deal <strong>with</strong><br />
the vagueness in these “voices” involved in the HOQ process. Among a few studies in this aspect, Khoo and Ho [12]<br />
provide a fuzzy QFD framework <strong>to</strong> perform QFD analysis using symmetrical triangular fuzzy numbers (STFNs). However,<br />
they exclude competitive analysis from their framework. Chan et al. [13] also use STFNs <strong>to</strong> analyze the “voice of the<br />
cus<strong>to</strong>mer”, but their study does not involve the “voice of the technician”.<br />
This paper presents a <strong>systematic</strong> and operational <strong>approach</strong> <strong>to</strong> the QFD process. After a detailed description and analysis<br />
of the HOQ elements, we provide a 9-step process <strong>to</strong> build an HOQ. Then, we suggest some feasible methods on how<br />
<strong>to</strong> collect and analyze the information from both the cus<strong>to</strong>mers and the technicians. We especially address the various<br />
“voices” in HOQ using symmetrical triangular fuzzy numbers (STFNs) and some of the proposed HOW steps are fuzzi ed<br />
<strong>to</strong> produce fuzzy results, which are generally more representative than traditional crisp <strong>approach</strong>es of using simple numbers.<br />
We also suggest the use of entropy method <strong>to</strong> perform competitive analyses and obtain competitive priority ratings for both<br />
cus<strong>to</strong>mer needs and technical measures. A fried Chinese vegetable example is given <strong>to</strong> <strong>full</strong>y illustrate our <strong>approach</strong>. Two<br />
di cult parts omitted from our model—the probability fac<strong>to</strong>rs for achieving the goals set for the HOWs and especially<br />
the correlation matrices among the WHATs and HOWs—are discussed in some detail nally, and possible <strong>approach</strong>es<br />
are also suggested <strong>to</strong> deal <strong>with</strong> them in a potentially more complete HOQ model.<br />
2. The HOQ process<br />
2.1. The HOQ elements<br />
According <strong>to</strong> many works (Refs. [1–9,14]), a typical HOQ contains some of the following elements or concepts:<br />
1. Cus<strong>to</strong>mers: At rst the cus<strong>to</strong>mers of a product or service concerned should be identi ed by the producing company.<br />
2. Cus<strong>to</strong>mer needs (WHATs): These are the requirements of cus<strong>to</strong>mers for the product expressed in cus<strong>to</strong>mers’<br />
languages.<br />
3. Structuring cus<strong>to</strong>mer needs: If there are many cus<strong>to</strong>mer needs, grouping them in<strong>to</strong> meaningful hierarchies or categories<br />
is necessary for easy understanding and analysis.<br />
4. Correlation matrix of cus<strong>to</strong>mer needs: This matrix contains the correlation between each pair of cus<strong>to</strong>mer needs<br />
(WHATs) through empirical comparisons. The information is provided by cus<strong>to</strong>mers and usually is di cult <strong>to</strong> obtain<br />
since a lot of pairwise comparisons are needed. The purpose of completing this correlation matrix is for the company <strong>to</strong><br />
identify where trade-o decisions and further research may be required. Correlation is usually described by the following<br />
5-point scale (Refs. [2,5,7,9]):<br />
(1)
L.-K. Chan, M.-L. Wu / Omega 33 (2005) 119 – 139 121<br />
5. Relative importance ratings of cus<strong>to</strong>mer needs: These are the relative importance of cus<strong>to</strong>mer needs perceived by<br />
the cus<strong>to</strong>mers, usually expressed and measured through a 5-point scale such as:<br />
Sometimes the following scale emphasizing more on the right-hand side is used <strong>to</strong> measure relative importance (Ref. [9]),<br />
which was preferred by the Japanese:<br />
Other scales such as a 9-point scale from 1 <strong>to</strong> 9 or 100-point scale from 1 <strong>to</strong> 100 may also be used. For comparison of<br />
some scales <strong>to</strong> measure relative importance, see Ref. [8].<br />
6. Competi<strong>to</strong>rs: For the product concerned, the producing company should identify the main competi<strong>to</strong>rs in the relevant<br />
markets.<br />
7. Cus<strong>to</strong>mer competitive assessment: This is <strong>to</strong> let the cus<strong>to</strong>mers assess the relative performance of the producing<br />
company’s product and its main competi<strong>to</strong>rs’ similar products on the cus<strong>to</strong>mer needs identi ed, usually expressed and<br />
measured by the following 5-point scale:<br />
8. Goals for cus<strong>to</strong>mer needs: The producing company can set performance goals on each WHAT <strong>to</strong> work on in order<br />
<strong>to</strong> better satisfy cus<strong>to</strong>mer needs. The scale for measuring these goals is the same as (4).<br />
9. Sales-point: A sales-point is a kind of possibility which will give your company a unique business position (Refs.<br />
[1,2,6,7]). A “strong” sales point is reserved for important WHATs where each comparing company is rated poorly.<br />
A “moderate” sales point means the importance rating or competitive opportunity is not so great. And a “no” sales<br />
point means no business opportunity. Numerically, 1.5, 1.25 and 1 are assigned <strong>to</strong> strong, moderate and no sales point<br />
respectively (Refs. [1,7]).<br />
10. Final importance ratings of cus<strong>to</strong>mer needs: For each WHAT its nal importance rating (or row <strong>to</strong>tal, planning<br />
weight) is calculated by the following formula (Refs. [1,7]):<br />
Final importance rating = relative importance × improvement ratio × sales point; (5)<br />
where improvement ratio equals <strong>to</strong> goal performance level divided by current performance level.<br />
11. Technical measures (HOWs): These are design speci cations, substitute <strong>quality</strong> characteristics, engineering<br />
attributes or methods, which can relate <strong>to</strong> and measure cus<strong>to</strong>mer needs.<br />
12. Correlation matrix of the HOWs: This matrix is <strong>to</strong> help the producing company establish which HOWs are correlated<br />
and determine the extent of these correlations, which can be obtained through engineering analysis and experience.<br />
The scale for measuring correlations among the HOWs is the same as (1).<br />
13. Relationship matrix of WHATs vs. HOWs: This matrix is a <strong>systematic</strong> means for identifying the level of relationship<br />
between each WHAT and each HOW. Usually these relationships are measured by the following scale that, similar<br />
<strong>to</strong> (3), puts more weights on strong relationship (Refs. [2,5,7,9]):<br />
14. Improving directions of the HOWs: It is helpful <strong>to</strong> identify in which direction each HOW should be improved<br />
<strong>to</strong> better satisfy cus<strong>to</strong>mer needs. Basically there are three types of improving directions: maximizing (or increasing),<br />
minimizing (or decreasing), and meeting targets (or guidelines, standards).<br />
15. Technical competitive assessment: This is <strong>to</strong> technically evaluate the performance of the company’s product and<br />
its main competi<strong>to</strong>rs’ similar products on each HOW.<br />
16. Goals for the HOWs: The producing company can set performance goals on each HOW <strong>to</strong> be more technically<br />
competitive.<br />
(2)<br />
(3)<br />
(4)<br />
(6)
122 L.-K. Chan, M.-L. Wu / Omega 33 (2005) 119 – 139<br />
17. Probability fac<strong>to</strong>rs: For each HOW’s performance goal there is a probability fac<strong>to</strong>r (Refs. [2,9]) <strong>to</strong> achieve the<br />
goal, determined by engineering and cost analysis. The following 5-point scale similar <strong>to</strong> (2) and (4) is commonly used<br />
<strong>to</strong> measure these probabilities:<br />
18. Importance ratings of the HOWs: This is the main output of the HOQ process. Importance rating of a HOW is<br />
usually computed using the following simple additive weighting (SAW) formula (Refs. [2,7,9]):<br />
importance rating of a HOW<br />
= � ( nal importance rating of WHAT × relationship value between WHAT and the HOW); (7)<br />
where the summation is over all WHATs.<br />
2.2. A 9-step HOQ model<br />
In practice, it is both di cult and unnecessary <strong>to</strong> include all the HOQ elements described above. In fact, di erent<br />
users build di erent HOQ models involving di erent elements from the above list. The most simple but widely used<br />
HOQ model contains only the cus<strong>to</strong>mer needs (WHATs) and their relative importance, technical measures (HOWs) and<br />
their relationships <strong>with</strong> the WHATs, and the importance ratings of the HOWs. Some models include further the cus<strong>to</strong>mer<br />
competitive assessment and performance goals for the WHATs. Some authors add one or both of the two correlation<br />
matrices in<strong>to</strong> this simple model. Fewer models include the technical competitive assessment since this information is<br />
di cult <strong>to</strong> deal <strong>with</strong> and, as such, goals and probability fac<strong>to</strong>rs for the HOWs appear seldom in HOQ studies—even if<br />
these are included, they are hardly incorporated in<strong>to</strong> the computation of the importance ratings of the HOWs, which are<br />
usually obtained by formula (7) that does not relate <strong>to</strong> technical competitive assessment at all.<br />
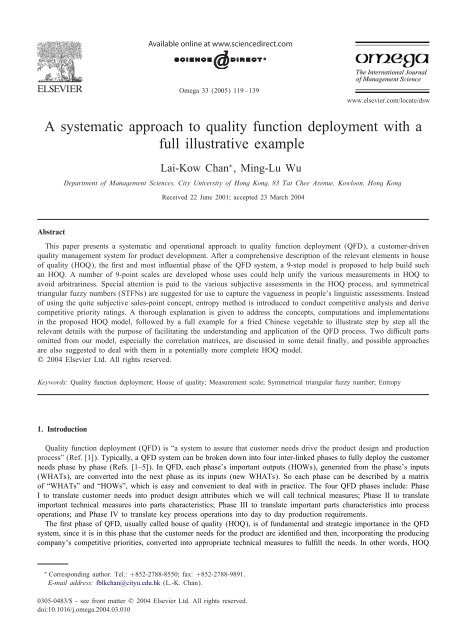
To avoid inconsistencies and facilitate applications, we propose in this paper a uni ed 9-step HOQ model (Fig. 1) which,<br />
a re nement of the model by Chan and Wu[15], contains the frequently used HOQ elements. A noticeable exclusion is<br />
the two correlation matrices since these correlations are not easy <strong>to</strong> obtain, not <strong>to</strong> say <strong>to</strong> incorporate in<strong>to</strong> the respective<br />
importance ratings (for two possible <strong>approach</strong>es, see Refs. [12,16]). This, however, does not imply their unimportance<br />
in the HOQ process and future e ort should be made <strong>to</strong> handle them properly. Probabilities <strong>to</strong> achieve goals for the<br />
HOWs are not included, either, but they can at least partly be re ected through technical competitive assessment and the<br />
improvement ratios. Later in Section 5, we will elaborate more on these two omitted parts and also indicate possible ways<br />
<strong>to</strong> include them in<strong>to</strong> an even more complete HOQ model.<br />
Step 1<br />
Identify<br />
Cus<strong>to</strong>mers &<br />
Collect<br />
Cus<strong>to</strong>mer<br />
Needs<br />
(WHATs)<br />
Step 2<br />
Determine<br />
Relative<br />
Importance<br />
Ratings of<br />
WHATs<br />
Step 5<br />
Generate Technical<br />
Measures (HOWs)<br />
Step 6<br />
Determine<br />
Relationships Between<br />
WHATs and HOWs<br />
Step 7<br />
Determine Initial<br />
Technical Ratings of HOWs<br />
Step 8<br />
Conduct Technical<br />
Competitive Analysis &<br />
Set Technical Performance<br />
Goals for HOWs<br />
Step 9<br />
Determine Final Technical<br />
Ratings of HOWs<br />
Step 3<br />
Identify Competi<strong>to</strong>rs,<br />
Conduct Cus<strong>to</strong>mer<br />
Competitive Analysis &<br />
Set Cus<strong>to</strong>mer<br />
Performance Goals for<br />
WHATs<br />
Fig. 1. House of <strong>quality</strong> (HOQ): a 9-step model.<br />
Step 4<br />
Determine<br />
Final<br />
Importance<br />
Ratings of<br />
WHATs
2.3. Scales andfuzziness<br />
L.-K. Chan, M.-L. Wu / Omega 33 (2005) 119 – 139 123<br />
As summarized in Section 2.1, there are many scales used in the HOQ process <strong>to</strong> measure di erent concepts. For<br />
example, it is common <strong>to</strong> use scale (1) <strong>to</strong> measure the correlation between each pair of WHATs or HOWs, scale (6) <strong>to</strong><br />
measure the relationship between each WHAT and each HOW, scale (2) <strong>to</strong> measure the relative importance of WHATs,<br />
and scale (4) <strong>to</strong> measure the companies’ current and goal performance in terms of WHATs. But there is not a rule as<br />
<strong>to</strong> which element must or should be measured by a designated scale and, in fact, di erent users may use di erent scales<br />
<strong>to</strong> measure the same concept. For example, while many authors adopt scale (2) <strong>to</strong> measure the importance of WHATs,<br />
some people prefer <strong>to</strong> use scale (3) for the same purpose.<br />
On the other hand, it is well recognized that people’s assessments of concepts are always subjective and thus imprecise,<br />
and the linguistic terms people use <strong>to</strong> express their judgements are vague in nature. Using objective, de nite and precise<br />
numbers <strong>to</strong> represent linguistic assessments are, although widely adopted, not very reasonable. A more rational <strong>approach</strong><br />
is <strong>to</strong> assign fuzzy numbers <strong>to</strong> linguistic assessments so that their vagueness can be captured. For example, rather than<br />
using numbers 1 and 5 <strong>to</strong> represent “very low” and “very high” importance in scale (2), we may assign symmetrical<br />
triangular fuzzy numbers (STFNs) such as [0.5,1.5] and [4.5,5.5] <strong>to</strong> these two linguistic assessments <strong>to</strong> express their<br />
vagueness. Here an STFN, in the form of [a, c], is a special fuzzy set representing a fuzzy concept “approximately b”<br />
where b =(a + c)=2 (see Appendix for a brief account of fuzzy set and STFN).<br />
To operate the HOQ process and make relevant computations comparable, it is necessary <strong>to</strong> unify the various scales used<br />
in HOQ. We propose a few 9-point 1-<strong>to</strong>-9 scales <strong>to</strong> measure the respective concepts in our proposed HOQ model. These<br />
scales can be represented by either conventional numbers or STFNs according <strong>to</strong> practical requirements. The rationale of<br />
adopting such 1-<strong>to</strong>-9 rating scales is proved by the many tests made by Saaty [17]. On the other hand, since 5-point scale<br />
is simple and easy <strong>to</strong> use and also includes enough information people provide on the attributes measured (Refs. [18–20]),<br />
we suggest that for each of the following 9-point scales proposed, a 5-point subscale 1-3-5-7-9 (or corresponding STFNs<br />
[0,2]-[2,4]-[4,6]-[6,8]-[8,10]) be used as much as possible. Only when compromises must be made or some uncertainty<br />
exists, the numbers 2, 4, 6, 8 (or corresponding STFNs [1,3], [3,5], [5,7], [7,9]) are adopted. These suggested scales are:<br />
• For measuring the relative importance of WHATs:<br />
• For measuring the companies’ current and goal performance in terms of WHATs:<br />
• For measuring the relationship between each WHAT and each HOW:<br />
3. Descriptions of the HOQ model<br />
According <strong>to</strong> the above preparations, our proposed 9-step HOQ model (Fig. 1) can be described as follows. These<br />
descriptions, both qualitative and quantitative, are based on the ideas from Refs. [1–9,13–15].<br />
Step 1. Identify cus<strong>to</strong>mers and collect their needs (WHATs): The producing company should know who are the<br />
cus<strong>to</strong>mers for the product concerned. There are generally three types of cus<strong>to</strong>mers, internal cus<strong>to</strong>mers such as shareholders,<br />
managers and employees, intermediate cus<strong>to</strong>mers such as wholesale people and retailers, and ultimate cus<strong>to</strong>mers such as<br />
recipients of service, purchasers, institutional purchasers. Usually the main focus is on the ultimate cus<strong>to</strong>mers who could<br />
be identi ed through previous information and marketing research.<br />
(8)<br />
(9)<br />
(10)
124 L.-K. Chan, M.-L. Wu / Omega 33 (2005) 119 – 139<br />
Understanding what cus<strong>to</strong>mers need for a product is important for the company, otherwise you cannot know how <strong>to</strong><br />
satisfy your cus<strong>to</strong>mers and thus how <strong>to</strong> keep your business successful. Available methods <strong>to</strong> collect cus<strong>to</strong>mer needs include<br />
focus group, individual interviews, listening and watching, and using existing information. It is suitable and economical<br />
<strong>to</strong> gather cus<strong>to</strong>mer needs through focus group and individual interviews (Ref. [2]). As for how many cus<strong>to</strong>mers should<br />
be interviewed, see Refs. [7,8] for analysis and guidelines.<br />
Grouping related cus<strong>to</strong>mer needs in<strong>to</strong> a category is helpful in analyzing the needs. A nity Diagram (Refs. [2,6,7]), a<br />
method of arranging random data in<strong>to</strong> natural and logical groups, can be used <strong>to</strong> organize cus<strong>to</strong>mer needs. Cluster analysis<br />
can also be used for this purpose (Ref. [8]). Usually cus<strong>to</strong>mer needs can be organized as a tree-like structure <strong>with</strong> an<br />
increasing number of items moving from left/<strong>to</strong>p (higher levels) <strong>to</strong> right/bot<strong>to</strong>m (lower levels).<br />
Suppose that, through appropriate ways, K cus<strong>to</strong>mers have been selected and M cus<strong>to</strong>mer needs have been identi ed<br />
based on the opinions of these K cus<strong>to</strong>mers. The M cus<strong>to</strong>mer needs are denoted as W1;:::;WM . These needs could be<br />
classi ed in<strong>to</strong> some meaningful categories according <strong>to</strong> practical situation.<br />
Step 2. Determine the relative importance ratings of cus<strong>to</strong>mer needs: Cus<strong>to</strong>mer needs (WHATs) usually are of di erent<br />
degrees of importance and it is a common practice for the company <strong>to</strong> focus more on the important WHATs. The relative<br />
importance of the WHATs is usually expressed as a set of ratings that can be determined by letting the cus<strong>to</strong>mers reveal<br />
their perceptions on the relative importance of the WHATs and then averaging their perceptions. The appropriate ways of<br />
obtaining cus<strong>to</strong>mers’ perceptions are by individual interviews and mail surveys.<br />
Suppose that for cus<strong>to</strong>mer need Wm, cus<strong>to</strong>mer k supplies a relative importance rating gmk <strong>to</strong> it according <strong>to</strong> scale (9),<br />
where gmk is one of the nine crisp numbers or STFNs in scale (8). Then the resulting average relative importance rating<br />
for Wm is computed by<br />
K�<br />
gm =(gm1 + gm2 + ···+ gmK)=K = gmk=K; m =1; 2;:::;M: (11)<br />
k=1<br />
It should be noted that if STFNs are used in scale (8), then gm computed by (11) is also an STFN. For convenience, the<br />
relative importance ratings of the M cus<strong>to</strong>mer needs can be described as an M-dimensional vec<strong>to</strong>r, g =(g1;g2;:::;gM ).<br />
Step 3. Identify competi<strong>to</strong>rs and conduct cus<strong>to</strong>mer competitive analysis: Competi<strong>to</strong>rs who produce the similar products<br />
should be identi ed by the company under study. Knowing the company’s strengths and constraints in all aspects of a<br />
product and in comparison <strong>with</strong> its main competi<strong>to</strong>rs is essential for a company if it wishes <strong>to</strong> improve its competitiveness<br />
in the relevant markets. This kind of information can be obtained by asking the cus<strong>to</strong>mers <strong>to</strong> rate the relative performance<br />
of the company and its competi<strong>to</strong>rs on each WHAT and then <strong>to</strong> aggregate the cus<strong>to</strong>mers’ ratings. Useful ways of conducting<br />
this kind of comparison analysis are also via mailed surveys and individual interviews.<br />
Denote the company in question by C1. Suppose that L − 1 competi<strong>to</strong>rs are identi ed, denoted as C2;:::;CL. Then<br />
the K cus<strong>to</strong>mers are requested <strong>to</strong> provide their perceptions on the relative performance of these L companies’ products<br />
of the similar type in terms of the M cus<strong>to</strong>mer needs. Suppose that cus<strong>to</strong>mer k supplies a rating xmlk on company Cl’s<br />
performance in terms of Wm using scale (9), where xmlk is one of the nine crisp numbers or STFNs in scale (9). Then<br />
the performance rating of company Cl on cus<strong>to</strong>mer need Wm is given as<br />
xml =(xml1 + xml2 + ···+ xmlK)=K =<br />
K�<br />
xmlk=K; m =1; 2;:::;M; l=1; 2;:::;L: (12)<br />
k=1<br />
Thus, the companies’ performance ratings on the cus<strong>to</strong>mer needs can be denoted by an M × L matrix, called cus<strong>to</strong>mer<br />
comparison matrix:<br />
X =<br />
W1<br />
W2<br />
···<br />
WM<br />
C1 C2 ::: CL<br />
⎡<br />
⎤<br />
x11 x12 ··· x1L<br />
⎢<br />
⎥<br />
⎢ x21 x22 ⎢<br />
··· x2L ⎥<br />
⎢<br />
⎥<br />
⎢<br />
⎣ ··· ··· ··· ··· ⎥<br />
⎦<br />
xM1 xM2 ··· xML<br />
M×L<br />
:<br />
Based on this X information, cus<strong>to</strong>mer competitive priority ratings on the WHATs for the producing company C1 can<br />
be obtained, usually using the quite subjective sales point concept (see Element 9 of Section 2.1), as e =(e1;e2;:::;em)<br />
where em is company C1’s priority rating on cus<strong>to</strong>mer need Wm. This set of priority ratings can also be derived by the<br />
more objective entropy method as introduced in the Appendix.<br />
According <strong>to</strong> company C1’s current performance on the WHATs in relation <strong>to</strong> its competi<strong>to</strong>rs’ performance, performance<br />
goals on the WHATs can be set for the company. These goals should be set competitively and realistically by the company,<br />
which is a highly strategical activity involving many considerations from relevant management. Assume that for cus<strong>to</strong>mer
L.-K. Chan, M.-L. Wu / Omega 33 (2005) 119 – 139 125<br />
need Wm, a proper performance goal am has been set according <strong>to</strong> scale (9). Thus the company has a goal performance<br />
vec<strong>to</strong>r in terms of the cus<strong>to</strong>mer needs, denoted as a =(a1;a2;:::;aM ). In most cases, each goal performance level should<br />
not be lower than current performance level, implying the need or desire for further improvement. From this we can also<br />
set the company’s improvement ratio for Wm as um = am=xm1. It is obvious that the higher the improvement ratio, the more<br />
the company should work on the WHAT, and thus the more important the WHAT for the company.<br />
Step 4. Determine the nal importance ratings of cus<strong>to</strong>mer needs: Cus<strong>to</strong>mer needs <strong>with</strong> higher relative importance<br />
perceived by cus<strong>to</strong>mers and higher competitive priorities and improvement ratios should receive higher attention. Thus,<br />
according <strong>to</strong> (5), cus<strong>to</strong>mer need Wm’s nal importance rating for the company is determined jointly by its relative<br />
importance gm, competitive priority em and improvement ratio um as<br />
fm = um × gm × em; m=1; 2;:::;M: (13)<br />
WHATs <strong>with</strong> high such nal ratings indicate both importance and potential business bene t <strong>to</strong> the company.<br />
Of course, a (weighted) sum of um, gm and em can also produce a reasonable fm, if preferred. In any case, we will<br />
denote the nal importance ratings for the cus<strong>to</strong>mer needs as a vec<strong>to</strong>r, f =(f1;f2;:::;fM ).<br />
Step 5. Generate technical measures (HOWs): After cus<strong>to</strong>mers reveal their needs for the product, the company’s<br />
technicians or product development team should develop a set of HOWs <strong>to</strong> capture the cus<strong>to</strong>mer needs in measurable and<br />
operable technical terms. HOWs could be generated from current product standards or selected by ensuring through cause–<br />
e ect analysis that the HOWs are the rst-order causes for the WHATs (Ref. [5]). Assume that N technical measures have<br />
been developed, denoted as H1;H2;:::;HN . Their measurement units and improving directions should also be determined,<br />
which is usually easy <strong>to</strong> do and important for the company <strong>to</strong> conduct technical competitive analysis for the HOWs. If<br />
necessary, these HOWs could be organized in<strong>to</strong> some manageable categories using, e.g., the A nity Diagram method<br />
(Refs. [2,6,7]).<br />
Step 6. Determine the relationships between HOWs andWHATs: This is an important work in HOQ/QFD which is<br />
performed care<strong>full</strong>y and collectively by technicians. The relationship between a HOW and a WHAT is usually determined<br />
by analyzing <strong>to</strong> what extent the HOW could technically relate <strong>to</strong> and in uence the WHAT. All these relationships form<br />
a matrix <strong>with</strong> the WHATs as rows and the HOWs as columns. It is suitable <strong>to</strong> complete this matrix in a column- or<br />
HOW-wise manner since once a HOW is de ned we usually begin establishing <strong>to</strong> what extents it relates <strong>to</strong> the WHATs<br />
(Ref. [2]). Let the relationship value between technical measure Hn and cus<strong>to</strong>mer need Wm be determined as rmn according<br />
<strong>to</strong> scale (10). Then we can form the following relationship matrix between the HOWs and the WHATs:<br />
R =<br />
W1<br />
W2<br />
···<br />
WM<br />
H1 H2 ··· HN<br />
⎡<br />
⎤<br />
r11 r12 ··· r1N<br />
⎢<br />
⎥<br />
⎢ r21 r22 ⎢<br />
··· r2N ⎥<br />
⎢<br />
⎥<br />
⎢<br />
⎣ ··· ··· ··· ··· ⎥<br />
⎦<br />
rM1 rM2 ··· rMN<br />
M×N<br />
:<br />
Step 7. Determine initial technical ratings of HOWs: Initial technical ratings of HOWs are decided by two fac<strong>to</strong>rs,<br />
nal importance ratings of WHATs and the relationships between the HOWs and the WHATs. These ratings indicate the<br />
basic importance of the HOWs developed in relation <strong>to</strong> the WHATs. They are usually computed using the simple additive<br />
weighting (SAW) formula (7). That is, for technical measure Hn, its initial technical rating is computed as the following<br />
simple weighted average over its relationships <strong>with</strong> the WHATs:<br />
M�<br />
tn = f1 × r1n + f2 × r2n + ···+ fM × rMn = fm × rmn; n=1; 2;:::;N: (14)<br />
m=1<br />
Other methods <strong>to</strong> obtain comprehensive ratings for a set of choices in relation <strong>to</strong> a number of performance criteria,<br />
such as the technique for order preference by similarity <strong>to</strong> ideal solution (TOPSIS) (Refs. [21,22]) and the operational<br />
competitiveness rating (OCRA) procedure (Refs. [23,24]), can also be used <strong>to</strong> compute initial technical ratings (Ref. [15]).<br />
We will denote, in any case, the HOWs’ initial technical ratings by a vec<strong>to</strong>r, t =(t1;t2;:::;tN ).<br />
Step 8: Perform technical competitive analysis: This step can be done through marketing. Although some technical<br />
parameters and know-hows of the competi<strong>to</strong>rs’ products cannot be easily obtained and some may even be kept con dential,<br />
the producing company should make every e ort <strong>to</strong> acquire this information and failing <strong>to</strong> do so may result in an<br />
unfavorable position for the company in the market place. In case of extreme di culty in obtaining the technical parameters<br />
of the competi<strong>to</strong>rs’ products on some HOWs, careful technical assessments should be made <strong>to</strong> give reliable scores (in a<br />
suitable scale such as (9)) representing the technical performance of the competi<strong>to</strong>rs’ products on the said HOWs.
126 L.-K. Chan, M.-L. Wu / Omega 33 (2005) 119 – 139<br />
Let the technical parameter or performance score of company Cl’s product on technical measure Hn be determined as<br />
ynl. Then we can form the technical comparison matrix of the companies’ products on the HOWs:<br />
Y =<br />
H1<br />
H2<br />
···<br />
HN<br />
C1 C2 ··· CL<br />
⎡<br />
⎤<br />
y11 y12 ··· y1L<br />
⎢<br />
⎥<br />
⎢ y21 y22 ⎢<br />
··· y2L ⎥<br />
⎢<br />
⎥<br />
⎢<br />
⎣ ··· ··· ··· ··· ⎥<br />
⎦<br />
yN 1 yN 2 ··· yNL<br />
N ×L<br />
:<br />
From this Y information technical competitive priority ratings on the HOWs can be obtained for the producing company<br />
using the entropy method as described in the Appendix. We will denote these ratings as a vec<strong>to</strong>r, z =(z1;z2;:::;zN ), where<br />
zn represents the company’s technical competitive priority <strong>with</strong> respect <strong>to</strong> Hn.<br />
Based on the above matrix Y, company C1 could also set performance goals on the HOWs. It should be noted that<br />
these goals are di erent from design speci cations. Essentially they represent levels of performance on the HOWs which<br />
the company believes is required for its product <strong>to</strong> be of technical competitiveness in the relevant markets in comparison<br />
<strong>with</strong> its competi<strong>to</strong>rs’ similar products. The goals should also be reachable according <strong>to</strong> the company’s technical resources.<br />
Suppose that the company sets a goal performance level bn for its product on Hn, then we have a technical performance<br />
goal vec<strong>to</strong>r, b=(b1;b2;:::;bN ). Compared <strong>to</strong> these goals we can de ne improvement ratios vn’s for the current performance<br />
of company’s product on the HOWs:<br />
vn = bn=yn1 for Hn <strong>to</strong> be maximized; or when bn ¿ yn1 for Hn <strong>to</strong> meet target;<br />
vn = yn1=bn for Hn <strong>to</strong> be minimized; or when bn ¡yn1 for Hn <strong>to</strong> meet target;<br />
or in a uniform manner:<br />
vn = max{yn1;bn}=min{yn1;bn}: (15)<br />
Step 9. Obtain nal technical ratings of the HOWs: Those HOWs <strong>with</strong> higher initial technical ratings (tn’s), higher<br />
technical competitive priorities (zn’s) and higher improvement ratios (vn’s) indicate working focuses and market opportunities<br />
for the producing company. Final technical rating is a useful measure <strong>to</strong> re ect this point which, <strong>with</strong> respect <strong>to</strong><br />
Hn, can be computed for the company’s product by integrating all these fac<strong>to</strong>rs using a formula similar <strong>to</strong> (5) or(13)<br />
for computing the nal importance ratings for the WHATs:<br />
sn = vn × tn × zn; n=1; 2;:::;N: (16)<br />
Thus we have a nal technical rating vec<strong>to</strong>r on the HOWs, s =(s1;s2;:::;sN ). HOWs <strong>with</strong> higher nal technical ratings,<br />
implying greater importance for the company’s product <strong>to</strong> be successful in the competitive markets, are transferred in<strong>to</strong><br />
the second phase of QFD, parts <strong>deployment</strong>, which translates important technical measures (new WHATs) in<strong>to</strong> parts<br />
characteristics (new HOWs).<br />
The above quantitative descriptions of our proposed HOQ model are summarized in Fig. 2. In the next Section, we will<br />
demonstrate step by step the concepts and operations of the model through an easy-<strong>to</strong>-understand fried Chinese vegetable<br />
example. To make our HOQ model <strong>full</strong>y operable, we will use fuzzy method <strong>to</strong> handle the vagueness of people’s linguistic<br />
assessments and entropy method <strong>to</strong> derive competitive priority ratings for the company’s product. A brief introduction <strong>to</strong><br />
these two methods is given in the Appendix.<br />
4. A <strong>full</strong> illustrative example<br />
Complete QFD examples <strong>to</strong> <strong>full</strong>y illustrate the procedure of QFD do not appear frequently in the literature. But they<br />
are helpful for practitioners <strong>to</strong> follow. Here we present a fried Chinese vegetable example <strong>to</strong> illustrate the concepts and<br />
computations in our proposed HOQ model in details. A Chinese restaurant, called restaurant C1, wishes <strong>to</strong> make an<br />
improvement on a fried Chinese vegetable it cooks and sells everyday in response <strong>to</strong> the competition of other Chinese<br />
restaurants in the same district. HOQ technique can help C1 make the appropriate decision resulting in better improvement.<br />
The basic idea is (i) <strong>to</strong> understand what are cus<strong>to</strong>mer needs for a fried Chinese vegetable (such as “not greasy” and<br />
“fresh”) and then <strong>to</strong> identify the important ones through cus<strong>to</strong>mer surveys, and (ii) <strong>to</strong> associate the cus<strong>to</strong>mer needs <strong>with</strong><br />
appropriate technical measures or solutions (such as “amount of edible oil used” and “duration of vegetable s<strong>to</strong>rage”)<br />
and then <strong>to</strong> nd the important ones through technical analyses. In what follows we will build the HOQ model for this<br />
example step by step according <strong>to</strong> the qualitative and quantitative descriptions in Section 3.
Step 1<br />
Cus<strong>to</strong>mer<br />
Needs<br />
(WHATs):<br />
W1<br />
W2<br />
...<br />
WM<br />
Step 2<br />
Relative<br />
Importance<br />
Ratings (g):<br />
g1<br />
g2<br />
...<br />
gM<br />
L.-K. Chan, M.-L. Wu / Omega 33 (2005) 119 – 139 127<br />
Step 5<br />
Technical Measures (HOWs):<br />
H1 H2 ... HN<br />
Step 6<br />
Relationships Between<br />
WHATs and HOWs (R):<br />
H1 H2 ... HN<br />
W1 r11 r12 ... r1N<br />
W2 r21 r22 ... r2N<br />
... ... ... ... ...<br />
WM rM1 rM2 ... rMN<br />
Step 7<br />
Initial Technical Ratings (t):<br />
t1 t2 ... tN<br />
Step 8<br />
Technical Competitive<br />
Analysis (Y):<br />
H1 H2 ... HN<br />
C1 y11 y21 ... yN1<br />
C2 y12 y22 ... yN2<br />
... ... ... ... ...<br />
CL y1L y2L ... yNL<br />
(z) z1 z2 ... zN<br />
(b) b1 b2 ... bN<br />
(v)<br />
Step 9<br />
v1 v2 ... vN<br />
Final Technical Ratings (s):<br />
s1 s2 ... sN<br />
Table 1<br />
Ten cus<strong>to</strong>mer needs (WHATs) for a fried Chinese vegetable<br />
Step 3<br />
Cus<strong>to</strong>mer Competitive Analysis:<br />
(X)<br />
C1 C2 ... CL (e) (a) (u)<br />
W1 x11 x12 ... x1L e1 a1 u1<br />
W2 x21 x22 ... x2L e2 a2 u2<br />
... ... ... ... ... ... … …<br />
WM xM1 xM2 ... xML eM aM uM<br />
Step 4<br />
Final<br />
Importance<br />
Ratings (f):<br />
f1<br />
f2<br />
...<br />
where:<br />
C1 = The Producing Company<br />
Cl = Company l (l = 2, …, L)<br />
em = Cus<strong>to</strong>mer Competitive Priority Rating<br />
(by Sales-Point or Entropy Method)<br />
am = Cus<strong>to</strong>mer Performance Goal<br />
um = Cus<strong>to</strong>mer Improvement Ratio = am/xm1<br />
fm = u × gm × em<br />
Fig. 2. HOQ model: quantitative descriptions.<br />
tn = (f1 × r1n) + (f2 × r2n) + ... + (fM × rMn)<br />
zn = Technical Competitive Priority Rating<br />
(by Sales-Point or Entropy Method)<br />
bn = Technical Performance Goal<br />
vn = Technical Improvement Ratio<br />
= max{bn, y1n}/min{bn, y1n}<br />
sn = v × tn × zn<br />
Good taste Good smell Good appearance<br />
W1: appetizing W5: hot W8: not overcooked<br />
W2: not salty W6: fresh W9: jade color<br />
W3: not greasy W7: sweet smell W10: tasteful arrangement<br />
W4: moderately spicy<br />
Step 1: At rst the restaurant must know who are the cus<strong>to</strong>mers for its fried Chinese vegetable. This information could<br />
be obtained by observing who order the fried Chinese vegetable or through market survey. According <strong>to</strong> Refs. [7,8],<br />
usually 20–30 cus<strong>to</strong>mers should be selected <strong>to</strong> reveal their various perceptions about the product. Here, for illustration<br />
purpose, ve of the restaurant’s cus<strong>to</strong>mers are selected <strong>to</strong> help conduct the HOQ analysis (i.e., K = 5). By one or more<br />
focus groups, these ve cus<strong>to</strong>mers identify ten needs (WHATs) for the fried Chinese vegetable (i.e., M = 10). They are:<br />
“appetizing”, “jade color”, “fresh”, “hot” (high temperature), “moderately spicy”, “not greasy”, “not overcooked”, “tasteful<br />
arrangement”, “not salty”, and “sweet smell”. Using the A nity Diagram method or through experience, the cus<strong>to</strong>mers<br />
further group these 10 WHATs in<strong>to</strong> three convenient and meaningful categories according <strong>to</strong> their inter-relationships:<br />
“good taste”, “good smell” and “good appearance”. Under these groupings, the cus<strong>to</strong>mer needs can be re-ordered and<br />
numbered as shown in Table 1.<br />
Step 2: The 10 WHATs can hardly be of same importance <strong>to</strong> the cus<strong>to</strong>mers. So the ve selected cus<strong>to</strong>mers are asked<br />
<strong>to</strong> reveal their perceptions on the relative importance of the ten WHATs using the ve linguistic terms in scale (8).<br />
Table 2(a) shows their assessments where, for example, cus<strong>to</strong>mer 1 rates the relative importance of W1 as “high”. Using<br />
scale (8), these linguistic assessments of the WHATs’ relative importance can be converted <strong>to</strong> crisp numbers or symmetrical<br />
triangular fuzzy members (STFNs) according <strong>to</strong> practical need. The transformed results are shown in Table 2(b) where,<br />
for example, cus<strong>to</strong>mer 1 considers W1 as having “high” importance, which can be represented by a crisp number 7 or an<br />
STFN [6,8] according <strong>to</strong> scale (8).<br />
According <strong>to</strong> these crisp numbers or STFNs representing the relative importance of the WHATs perceived by the<br />
cus<strong>to</strong>mers, we can obtain the relative importance ratings of the WHATs by averaging the cus<strong>to</strong>mers’ perceptions. In case<br />
fM
128 L.-K. Chan, M.-L. Wu / Omega 33 (2005) 119 – 139<br />
Table 2<br />
(a) Five cus<strong>to</strong>mers’ perceptions on the relative importance of the 10 WHATs<br />
WHATs Cus<strong>to</strong>mer 1 Cus<strong>to</strong>mer 2 Cus<strong>to</strong>mer 3 Cus<strong>to</strong>mer 4 Cus<strong>to</strong>mer 5<br />
W1 High Very high High Moderate Very high<br />
W2 Moderate Very high Moderate High Moderate<br />
W3 Very high Moderate Very high Moderate Low<br />
W4 High Low Moderate Very high Low<br />
W5 Low Very low Low Moderate High<br />
W6 Very high High High Moderate Very high<br />
W7 Moderate Low Very high High Moderate<br />
W8 High Moderate Moderate High High<br />
W9 Low Moderate Very low Low Moderate<br />
W10 Very low Low Moderate Very low Low<br />
(b) Relative importance ratings of the 10 WHATs basedon the ve cus<strong>to</strong>mers’ perceptions<br />
WHATs Cus<strong>to</strong>mer 1 Cus<strong>to</strong>mer 2 Cus<strong>to</strong>mer 3 Cus<strong>to</strong>mer 4 Cus<strong>to</strong>mer 5 Relative importance<br />
(Wm) ratings<br />
Crisp Fuzzy Crisp Fuzzy Crisp Fuzzy Crisp Fuzzy Crisp Fuzzy Crisp Fuzzy<br />
(gm1) (˜gm1) (gm2) (˜gm2) (gm3) (˜gm3) (gm4) (˜gm4) (gm5) (˜gm5) (gm) (˜gm)<br />
W1 7 [6, 8] 9 [8, 10] 7 [6, 8] 5 [4, 6] 9 [8, 10] 7.4 [6.4, 8.4]<br />
W2 5 [4, 6] 9 [8, 10] 5 [4, 6] 7 [6, 8] 5 [4, 6] 6.2 [5.2, 7.2]<br />
W3 9 [8, 10] 5 [4, 6] 9 [8, 10] 5 [4, 6] 3 [2, 4] 6.2 [5.2, 7.2]<br />
W4 7 [6, 8] 3 [2, 4] 5 [4, 6] 9 [8, 10] 3 [2, 4] 5.4 [4.4, 6.4]<br />
W5 3 [2, 4] 1 [0, 2] 3 [2, 4] 5 [4, 6] 7 [6, 8] 4.0 [3.0, 5.0]<br />
W6 9 [8, 10] 7 [6, 8] 7 [6, 8] 5 [4, 6] 9 [8, 10] 7.4 [6.4, 8.4]<br />
W7 5 [4, 6] 3 [2, 4] 9 [8, 10] 7 [6, 8] 5 [4, 6] 5.8 [4.8, 6.8]<br />
W8 7 [6, 8] 5 [4, 6] 5 [4, 6] 7 [6, 8] 7 [6, 8] 6.2 [5.2, 7.2]<br />
W9 3 [2, 4] 5 [4, 6] 1 [0, 2] 3 [2, 4] 5 [4, 6] 3.4 [2.4, 4.4]<br />
W10 1 [0, 2] 3 [2, 4] 5 [4, 6] 1 [0, 2] 3 [2, 4] 2.6 [1.6, 3.6]<br />
that crisp numbers are used, these relative importance ratings are computed by (11) as<br />
g =(g1;g2;:::;g10)=(7:4; 6:2; 6:2; 5:4; 4:0; 7:4; 5:8; 6:2; 3:4; 2:6):<br />
For example, the crisp form relative importance rating of W1;g1, is computed by<br />
g1 =(g11 + g12 + g13 + g14 + g15)=5=(7+9+7+5+9)=5=37=5=7:4;<br />
where gmk is cus<strong>to</strong>mer k’s relative importance perception on Wm in crisp form. If STFNs are used, the relative importance<br />
ratings are computed by (11) and the arithmetic for STFNs as<br />
˜g =(˜g1; ˜g2;:::; ˜g10) = ([6:4; 8:4]; [5:2; 7:2]; [5:2; 7:2]; [4:4; 6:4]; [3:0; 5:0]; [6:4; 8:4];<br />
[4:8; 6:8]; [5:2; 7:2]; [2:4; 4:4]; [1:6; 3:6]);<br />
where, for example, the STFN form relative importance rating of W1; ˜g1, is computed by<br />
˜g1 =(˜g11 +˜g12 +˜g13 +˜g14 +˜g15)=5 = ([6; 8]+[8; 10]+[6; 8]+[4; 6]+[8; 10])=5 = [32; 42]=5=[6:4; 8:4];<br />
and ˜gmk is cus<strong>to</strong>mer k’s relative importance perception on Wm in STFN form.<br />
Step 3: This step is for restaurant C1 <strong>to</strong> identify competi<strong>to</strong>rs and conduct cus<strong>to</strong>mer competitive analysis. In the district’s<br />
fried Chinese vegetable market, restaurant C1 has three main competi<strong>to</strong>rs, called restaurants C2, C3 and C4, each of which<br />
makes a similar type of fried Chinese vegetable. In order <strong>to</strong> understand the fried Chinese vegetable market and its<br />
relative position in the market, and <strong>to</strong> nally nd out the priorities for further improvement, restaurant C1 asks the ve<br />
selected cus<strong>to</strong>mers <strong>to</strong> rate the relative performance of its own fried Chinese vegetable and the three competi<strong>to</strong>rs’ similar<br />
products in terms of the ten WHATs using scale (9). The ve cus<strong>to</strong>mers’ assessments are shown in Table 3(a) in crisp<br />
numbers, where, for example, cus<strong>to</strong>mer 1 rates the performance of C2’s product on W3 as “neutral” using scale (9), which
Table 3<br />
(a) Cus<strong>to</strong>mer competitive analysis<br />
L.-K. Chan, M.-L. Wu / Omega 33 (2005) 119 – 139 129<br />
Wm Cus<strong>to</strong>mer 1, Cus<strong>to</strong>mer 2, Cus<strong>to</strong>mer 3, Cus<strong>to</strong>mer 4, Cus<strong>to</strong>mer 5, Cus<strong>to</strong>mer comparison em<br />
X1 =[xmn1] 10×4 X2 =[xmn2] 10×4 X3 =[xmn3] 10×4 X4 =[xmn4] 10×4 X5 =[xmn5] 10×4 matrix, X =[xmn] 10×4<br />
C1 C2 C3 C4 C1 C2 C3 C4 C1 C2 C3 C4 C1 C2 C3 C4 C1 C2 C3 C4 C1 C2 C3 C4<br />
W1 5 7 5 3 7 3 7 7 9 5 7 5 5 5 7 5 7 3 3 7 6.6 4.6 5.8 5.4 0.1000<br />
W2 3 3 5 5 5 7 3 5 3 5 3 7 7 5 5 3 5 5 7 5 4.6 5.0 4.6 5.0 0.1006<br />
W3 7 5 3 7 9 5 5 7 7 7 5 5 5 3 5 3 7 5 7 5 7.0 5.0 5.0 5.4 0.0999<br />
W4 3 5 7 5 1 3 5 5 5 5 3 7 7 5 5 3 5 3 5 5 4.2 4.2 5.0 5.0 0.1004<br />
W5 1 3 1 1 3 1 1 3 1 5 3 1 5 5 3 3 3 3 5 3 2.6 3.4 2.6 2.2 0.0997<br />
W6 7 5 3 5 9 7 7 7 5 3 5 3 7 7 3 7 7 3 5 5 7.0 5.0 4.6 5.4 0.0997<br />
W7 9 7 9 5 7 9 7 7 5 3 3 5 7 7 7 3 9 7 7 9 7.4 6.6 6.6 5.8 0.1004<br />
W8 3 3 7 3 5 3 5 5 3 5 5 3 1 5 7 5 7 5 7 5 3.8 4.2 6.2 4.2 0.0992<br />
W9 5 3 5 7 7 7 7 5 7 3 5 3 5 5 7 7 3 3 3 5 5.4 4.2 5.4 5.4 0.1003<br />
W10 7 7 3 5 9 7 5 5 7 5 7 3 5 7 5 5 7 9 7 7 7.0 7.0 5.4 5.0 0.0998<br />
(b) Goals andimprovement ratios for the 10 WHATs<br />
WHATs Cus<strong>to</strong>mer comparison matrix, X =[xml] 10×4 Goals for WHATs (am) Improvement ratios for WHATs (um = am=xm1)<br />
C1 C2 C3 C4<br />
W1 6.6 4.6 5.8 5.4 7 1.0606<br />
W2 4.6 5.0 4.6 5.0 5 1.0870<br />
W3 7.0 5.0 5.0 5.4 8 1.1429<br />
W4 4.2 4.2 5.0 5.0 5 1.1905<br />
W5 2.6 3.4 2.6 2.2 4 1.5385<br />
W6 7.0 5.0 4.6 5.4 8 1.1429<br />
W7 7.4 6.6 6.6 5.8 9 1.2162<br />
W8 3.8 4.2 6.2 4.2 5 1.3158<br />
W9 5.4 4.2 5.4 5.4 6 1.1111<br />
W10 7.0 7.0 5.4 5.0 8 1.1429<br />
corresponds <strong>to</strong> a crisp number of 5, i.e., x321 = 5. We will not consider using STFNs <strong>to</strong> represent performance assessments<br />
since it is <strong>to</strong>o complex <strong>to</strong> incorporate STFNs in<strong>to</strong> the following entropy computations.<br />
According <strong>to</strong> the ve cus<strong>to</strong>mers’ assessments of the relative performance of the four restaurants’ similar products in<br />
terms of the 10 WHATs, a cus<strong>to</strong>mer comparison matrix X =[xmn] 10×4 can be obtained by averaging the cus<strong>to</strong>mers’<br />
assessments. The elements of this matrix are shown in Table 3(a) where, for example, restaurant C1’s performance rating<br />
on W2 is computed by (12) as<br />
x21 =(x211 + x212 + x213 + x214 + x215)=5=(3+5+3+7+5)=5=23=5=4:6;<br />
where xmlk is cus<strong>to</strong>mer k’s assessment of restaurant Cl’s performance on Wm.<br />
Applying the entropy method as illustrated in the Appendix, we can obtain restaurant C1’s competitive priority ratings<br />
on the 10 cus<strong>to</strong>mer needs based on the above cus<strong>to</strong>mer comparison matrix X. For example, the “distribution” of W1 on<br />
the four restaurants’ products is composed of the four restaurants’ performance ratings on W1: (6.6, 4.6, 5.8, 5.4), which is<br />
the rst row of matrix X. Then we can compute the <strong>to</strong>tal score of W1 : x1 =x11 +x12 +x13 +x14 =6:6+4:6+5:8+5:4=22:4,<br />
and obtain the “probability distribution” of W1:<br />
p11 = x11=x1 =6:6=22:4=0:2946;p12 = x12=x1 =4:6=22:4=0:2054;<br />
p13 = x13=x1 =5:8=22:4=0:2589;p14 = x14=x1 =5:4=22:4=0:2411:<br />
The entropy of W1 is then computed using (A.2) as<br />
4�<br />
p1l ln(p1l)=−[0:2946 ln(0:2946) + 0:2054 ln(0:2054)<br />
E(W1)=− 4<br />
l=1<br />
+0:2589 ln(0:2589) + 0:2411 ln(0:2411)]=ln(4) = 0:9940:
130 L.-K. Chan, M.-L. Wu / Omega 33 (2005) 119 – 139<br />
We can obtain in the same way the entropy for each of the 10 cus<strong>to</strong>mer needs as<br />
(E(W1);E(W2);:::;E(W10))<br />
=(0:9940; 0:9994; 0:9925; 0:9973; 0:9909; 0:9905; 0:9973; 0:9859; 0:9961; 0:9919):<br />
Finally, according <strong>to</strong> (A.3) we can obtain restaurant C1’s competitive priority ratings on the Wj’s:<br />
e =(e1;e2;:::;e10)=(0:1000; 0:1006; 0:0999; 0:1004; 0:0997; 0:0997; 0:1004; 0:0992; 0:1003; 0:0998);<br />
where, for example,<br />
�<br />
�10<br />
e1 = E(W1) E(Wm)<br />
m=1<br />
=0:9940=(0:9940 + 0:9994 + ···+0:9919) = 0:9904=9:9357 = 0:1000:<br />
This set of competitive priority ratings are shown in the last column of Table 3(a) from which we know that W2 is of<br />
the highest competitive priority for the restaurant, followed by W4;W7 and W9.<br />
Based on the resources available and the relative performance of the four restaurants on the 10 WHATs, restaurant C1<br />
can set improving goals on each WHAT <strong>to</strong> better satisfy the cus<strong>to</strong>mer needs. After various considerations, restaurant C1<br />
decides the following performance goals on the WHATs using scale (9):<br />
a =(a1;a2;:::;a10)=(7; 5; 8; 5; 4; 8; 9; 5; 6; 8):<br />
This set of goals is shown in Table 3(b). It is noted that all goal performance levels are higher than C1’s current<br />
performance levels represented by the rst column of cus<strong>to</strong>mer comparison matrix X. IfC1’s performance on a WHAT<br />
is poorer or much poorer than the performance of most of its competi<strong>to</strong>rs, then the goal level is set <strong>to</strong> be much higher<br />
than its current level <strong>to</strong> be of competitiveness. Otherwise, if C1’s performance on a WHAT is better than the performance<br />
of most of its competi<strong>to</strong>rs, then the goal level is only set <strong>to</strong> be slightly higher than its current level which is enough for<br />
C1 <strong>to</strong> keep and enhance its established competitiveness. We do not consider setting goals in STFN form either, since this<br />
results in some computational and explana<strong>to</strong>ry di culties.<br />
According <strong>to</strong> restaurant C1’s current and goal performance levels on the ten WHATs, its improvement ratios <strong>with</strong><br />
respect <strong>to</strong> the cus<strong>to</strong>mer needs can be easily computed according <strong>to</strong> the formula um = am=xm1:<br />
u =(u1;u2;:::;u10)=(1:0606; 1:0870; 1:1429; 1:1905; 1:5385; 1:1429; 1:2162; 1:3158; 1:1111; 1:1429):<br />
Step 4: According <strong>to</strong> each WHAT’s relative importance rating, competitive priority rating and improvement ratio,<br />
restaurant C1 could now reach the nal importance rating of the WHAT using (13). In case that the relative importance<br />
ratings are crisp numbers, the nal importance ratings are also given as the following crisp numbers:<br />
f =(f1;f2;:::;f10)<br />
=(0:7852; 0:6779; 0:7078; 0:6453; 0:6137; 0:8431; 0:7081; 0:8095; 0:3787; 0:2966):<br />
Here, for example, the nal importance rating of W1 in crisp form, f1, is computed by (13) as<br />
f1 = u1 × g1 × e1 =1:0606 × 7:4 × 0:1000 = 0:7852:<br />
From f we can nally rank the importance of the ten WHATs in the following order:<br />
W6 ≻ W8 ≻ W1 ≻ W7 ≻ W3 ≻ W2 ≻ W4 ≻ W5 ≻ W9 ≻ W10<br />
where “≻” means “more important than”.<br />
If relative importance ratings are STFNs, nal importance ratings are also given as STFNs:<br />
f ˜ =(˜f1; ˜f2;:::; ˜f10) = ([0:6791; 0:8913]; [0:5685; 0:7872]; [0:5937; 0:8220];<br />
[0:5258; 0:7647]; [0:4603; 0:7671]; [0:7292; 0:9570]; [0:5860; 0:8302]; [0:6789; 0:9400];<br />
[0:2673; 0:4901]; [0:1825; 0:4107]):<br />
Here, for example, the nal importance rating of W1 in STFN form, ˜f1, is computed by (13) and the scalar multiplication<br />
rule of STFNs as<br />
˜f1 = u1 × ˜g1 × e1 =1:0606 × [6:4; 8:4] × 0:1000 = [0:6791; 0:8913]:<br />
(17)
Table 4<br />
Crisp and fuzzy nal importance ratings of the 10 WHATs<br />
L.-K. Chan, M.-L. Wu / Omega 33 (2005) 119 – 139 131<br />
WHATs Final importance ratings Scaled nal importance ratings<br />
Crisp (fm) Fuzzy ( ˜f m) Crisp Fuzzy<br />
W1 0.7852 [0.6791, 0.8913] 0.9313 [0.7096, 0.9313]<br />
W2 0.6779 [0.5685, 0.7872] 0.8040 [0.5941, 0.8225]<br />
W3 0.7078 [0.5937, 0.8220] 0.8396 [0.6203, 0.8589]<br />
W4 0.6453 [0.5258, 0.7647] 0.7653 [0.5494, 0.7991]<br />
W5 0.6137 [0.4603, 0.7671] 0.7279 [0.4810, 0.8016]<br />
W6 0.8431 [0.7292, 0.9570] 1.0000 [0.7619, 1.0000]<br />
W7 0.7081 [0.5860, 0.8302] 0.8399 [0.6123, 0.8675]<br />
W8 0.8095 [0.6789, 0.9400] 0.9601 [0.7094, 0.9823]<br />
W9 0.3787 [0.2673, 0.4901] 0.4492 [0.2794, 0.5121]<br />
W10 0.2966 [0.1825, 0.4107] 0.3519 [0.1907, 0.4292]<br />
Using the fuzzy ranking principle (see Appendix), these fuzzy ratings produce the following partial ranking order for the<br />
WHATs’ nal importance:<br />
W6 ≻{W8;W1} ≻{W7;W3} ≻W2 ≻{W4;W5} ≻W9 ≻ W10; (18)<br />
where {W8;W1} means that W8 and W1 are not so easy <strong>to</strong> be compared, so do {W7;W3} and {W4;W5}. Although the<br />
crisp and fuzzy nal importance ratings for the ten WHATs may not result in the same ranking order due <strong>to</strong> possible<br />
incomparability between the fuzzy ratings of W8 and W1, ofW7 and W3, and of W4 and W5, it is quite clear from (17)<br />
and (18) that the two sets of ratings show an identical trend. Both sets of ratings indicate that W6 is the most important<br />
WHAT, followed by W8 and W1, and then by W7 and W3.<br />
These nal importance ratings of the WHATs, expressed as both crisp numbers and STFNs, are shown in the second<br />
column of Table 4. In order <strong>to</strong> be comparable, the crisp and fuzzy nal importance ratings are both scaled <strong>to</strong> have<br />
maximum ratings of unity, which are also shown in Table 4. More clearly, the scaled ratings are obtained for crisp case<br />
by dividing all the ratings by their maximum, 0.8431, and for fuzzy case by dividing all the STFNs by the maximum of<br />
their upper limits, 0.9570. From these scaled ratings we can see that, although the crisp and fuzzy ratings result in the<br />
same ranking order, crisp ratings are very close <strong>to</strong> the upper limits of the corresponding fuzzy ratings and quite far away<br />
from the lower limits. This shows that fuzzy ratings are more representative of the variations of the WHATs’ importance,<br />
which would make the restaurant more exible <strong>to</strong> capture and satisfy the cus<strong>to</strong>mer needs for a fried Chinese vegetable.<br />
Step 5: Now it is time <strong>to</strong> convert cus<strong>to</strong>mer needs in<strong>to</strong> product design speci cations. After careful considerations,<br />
restaurant C1’s cooks propose nine technical measures (HOWs) that relate <strong>to</strong> and can help realize the ten WHATs. These<br />
HOWs can be grouped in<strong>to</strong> two categories, “cooking material” and “cooking <strong>quality</strong>”. Further, the improving direction<br />
for each HOW is also determined by experience or technical analysis: two HOWs are <strong>to</strong> be minimized and the remaining<br />
seven HOWs are <strong>to</strong> meet targets. The HOWs, their improving directions and measurement units are shown in Table 5.<br />
Step 6: Then the cooks begin <strong>to</strong> establish the relationships between the HOWs and the WHATs, or <strong>to</strong> examine <strong>to</strong><br />
what extent each HOW is related <strong>to</strong> and can technically measure each WHAT. This step is usually done simultaneously<br />
<strong>with</strong> Step 5 since in the process of generating HOWs, each HOW’s relationships <strong>with</strong> the WHATs are always examined<br />
once the HOW is considered. The relationships between the HOWs and the WHATs are determined by technical analysis<br />
Table 5<br />
Nine technical measures (HOWs) for the 10 cus<strong>to</strong>mer needs (WHATs)<br />
Cooking material Cooking <strong>quality</strong><br />
H1: [↔ ] amount of soy sauce used (ml) H6: [↓ ] duration of vegetable s<strong>to</strong>rage (hour)<br />
H2: [↔ ] amount of salt used (g) H7: [↓ ] duration between nished and served (minute)<br />
H3: [↔ ] amount of pepper used (mg) H8: [↔ ] duration of cooking (minute)<br />
H4: [↔ ] amount of vegetable used (g) H9: [↔ ] duration of high temperature used in cooking (second)<br />
H5: [↔ ] amount of edible oil used (ml)<br />
Note: “↔” represents <strong>to</strong> meet a target and “↓” <strong>to</strong> minimize/decrease.
132 L.-K. Chan, M.-L. Wu / Omega 33 (2005) 119 – 139<br />
Table 6<br />
Crisp and fuzzy relationship matrix of HOWs vs. WHATs<br />
Crisp (R =[rmn] 10×9 ) Fuzzy ( ˜R =[˜rmn] 10×9 )<br />
H1 H2 H3 H4 H5 H6 H7 H8 H9 H1 H2 H3 H4 H5 H6 H7 H8 H9<br />
W1 9 7 1 1 5 3 1 7 5 [8, 10] [6, 8] [0, 2] [0, 2] [4, 6] [2, 4] [0, 2] [6, 8] [4, 6]<br />
W2 7 9 5 5 5 5 5 5 7 [6, 8] [8, 10] [4, 6] [4, 6] [4, 6] [4, 6] [4, 6] [4, 6] [6, 8]<br />
W3 7 7 3 1 5 1 3 7 5 [6, 8] [6, 8] [2, 4] [0, 2] [4, 6] [0, 2] [2, 4] [6, 8] [4, 6]<br />
W4 7 7 1 1 5 1 3 5 7 [6, 8] [6, 8] [0, 2] [0, 2] [4, 6] [0, 2] [2, 4] [4, 6] [6, 8]<br />
W5 3 3 9 9 7 3 3 5 5 [2, 4] [2, 4] [8, 10] [8, 10] [6, 8] [2, 4] [2, 4] [4, 6] [4, 6]<br />
W6 5 5 3 3 9 3 3 5 5 [4, 6] [4, 6] [2, 4] [2, 4] [8, 10] [2, 4] [2, 4] [4, 6] [4, 6]<br />
W7 3 3 1 1 7 1 1 3 3 [2, 4] [2, 4] [0, 2] [0, 2] [6, 8] [0, 2] [0, 2] [2, 4] [2, 4]<br />
W8 5 5 3 3 7 9 7 3 5 [4, 6] [4, 6] [2, 4] [2, 4] [6, 8] [8, 10] [6, 8] [2, 4] [4, 6]<br />
W9 1 1 1 1 5 7 9 1 1 [0, 2] [0, 2] [0, 2] [0, 2] [4, 6] [6, 8] [8, 10] [0, 2] [0, 2]<br />
W10 1 1 1 3 3 5 5 7 7 [0, 2] [0, 2] [0, 2] [2, 4] [2, 4] [4, 6] [4, 6] [6, 8] [6, 8]<br />
and empirical judgement, and usually may not be precise. So it is quite appropriate <strong>to</strong> use STFNs <strong>to</strong> represent this kind<br />
of relationships. For each HOW <strong>with</strong> respect <strong>to</strong> each WHAT, the cooks determine the relationship rst in linguistic<br />
term using scale (10) and then convert this relationship in<strong>to</strong> corresponding crisp number and STFN. The <strong>full</strong> matrix of<br />
these relationships, both in crisp numbers and STFNs, are shown in Table 6 where, for example, the cooks consider the<br />
relationship between H1 and W1 as “very strong” that corresponds <strong>to</strong> a crisp number of 9 and an STFN [8,10].<br />
Step 7: According <strong>to</strong> the WHATs’ nal importance ratings and the relationship values between the HOWs and the<br />
WHATs, the HOWs’ initial technical ratings can be computed usually through the simple additive weighting (SAW)<br />
formula (7). When crisp numbers are used, the initial technical ratings are given as<br />
t =(t1;t2;:::;t9) = (34:1866; 33:9720; 18:8076; 17:9852;<br />
39:3707; 23:5959; 23:8702; 31:3584; 32:6375):<br />
Here, for example, crisp initial technical rating of H1;t1, is computed as the weighted average over H1’s crisp relationship<br />
values <strong>with</strong> the ten WHATs, r11;r21;:::;r101, which correspond <strong>to</strong> the rst column of the crisp relationship matrix R, and<br />
the weights are the crisp nal importance ratings of the ten WHATs, f1;f2;:::;f10, i.e.,<br />
�10<br />
t1 = fm × rm1 =0:7852 × 9+0:6779 × 7+···+0:2966 × 1=34:1866:<br />
m=1<br />
From these crisp initial technical ratings, the technical measures (HOWs) can be ranked in the following order:<br />
H5 ≻ H1 ≻ H2 ≻ H9 ≻ H8 ≻ H7 ≻ H6 ≻ H3 ≻ H4: (19)<br />
If STFNs are used, the initial technical ratings are also given as STFNs:<br />
˜t =(˜t1; ˜t2;:::;˜t9) = ([23:2850; 47:4773]; [23:0639; 47:2691]; [9:9597; 30:0446];<br />
[9:1375; 29:2221]; [27:0869; 54:0437]; [13:7766; 35:8043]; [13:8342; 36:2954];<br />
[20:3964; 44:7095]; [21:3973; 46:2669]):<br />
Here, for example, the initial technical rating of H1 in STFN form, ˜t1, is computed as the weighted average over H1’s<br />
STFN form relationship values <strong>with</strong> the ten WHATs, ˜r11, ˜r21;:::; ˜r101, which correspond <strong>to</strong> the rst column of the<br />
STFN form relationship matrix ˜R, and the weights are the nal importance ratings of the ten WHATs in STFN form,<br />
˜f1; ˜f2;:::; ˜f10, i.e.,<br />
�10<br />
˜t1 =<br />
m=1<br />
˜f m × ˜rm1 =[0:6791; 0:8913] × [8; 10]+[0:5685; 0:7872] × [6; 8] + ···+[0:1825; 0:4107] × [0; 2]<br />
= [23:2850; 47:4773]:<br />
According <strong>to</strong> the principle in the Appendix, these fuzzy ratings have the following ranking order for the HOWs’ initial<br />
importance:<br />
H5 ≻ H1 ≻ H2 ≻ H9 ≻ H8 ≻ H7 ≻ H6 ≻ H3 ≻ H4: (20)
Table 7<br />
Crisp and fuzzy initial technical ratings of the nine HOWs<br />
L.-K. Chan, M.-L. Wu / Omega 33 (2005) 119 – 139 133<br />
HOWs Initial technical ratings Scaled initial technical ratings<br />
Crisp (tn) Fuzzy (˜tn) Crisp Fuzzy<br />
H1 34.1866 [23.2850, 47.4773] 0.8683 [0.4309, 0.8785]<br />
H2 33.9720 [23.0639, 47.2691] 0.8629 [0.4268, 0.8746]<br />
H3 18.8076 [9.9597, 30.0446] 0.4777 [0.1843, 0.5559]<br />
H4 17.9852 [9.1375, 29.2221] 0.4568 [0.1691, 0.5407]<br />
H5 39.3707 [27.0869, 54.0437] 1.0000 [0.5012, 1.0000]<br />
H6 23.5959 [13.7766, 35.8043] 0.5993 [0.2549, 0.6625]<br />
H7 23.8702 [13.8342, 36.2954] 0.6063 [0.2560, 0.6716]<br />
H8 31.3584 [20.3964, 44.7095] 0.7965 [0.3774, 0.8273]<br />
H9 32.6375 [21.3973, 46.2669] 0.8290 [0.3959, 0.8561]<br />
Table 8<br />
Technical competitive analysis, goals and improvement ratios for HOWs<br />
HOWs Measurement Technical comparison Technical competitive Goal Improvement<br />
units matrix (Y =[ynl] 9×4 ) priority rating (zn) (bn) ratio (vn)<br />
C1 C2 C3 C4<br />
H1 ml 11 13 8 9 0.1115 9 1.2222<br />
H2 g 6 9 9 10 0.1116 8 1.3333<br />
H3 mg 20 25 15 30 0.1104 25 1.2500<br />
H4 g 250 350 300 300 0.1124 300 1.2000<br />
H5 ml 7 11 10 10 0.1119 9 1.2857<br />
H6 h 8 10 5 6 0.1101 6 1.3333<br />
H7 min 2.5 2 1.5 3 0.1104 2 1.2500<br />
H8 min 3 4 3.5 3.5 0.1125 3.5 1.1667<br />
H9 s 20 30 15 15 0.1093 15 1.3333<br />
It is noticed from (19) and (20) that the crisp and fuzzy ratings exhibit the same ranking order. Both sets of ratings<br />
indicate that H5 is of the highest initial importance, followed by H1;H2 and H9.<br />
The crisp and fuzzy initial technical ratings of the nine HOWs are shown in Table 7. Also shown there are the scaled<br />
crisp and fuzzy ratings that are easier <strong>to</strong> be compared. Same as in the case for the WHATs’ nal importance ratings<br />
(Table 4), crisp initial technical ratings tend <strong>to</strong> be close <strong>to</strong> the upper bounds and far away from the lower bounds of the<br />
corresponding fuzzy ratings, indicating more exibility and higher reliability represented by the fuzzy ratings.<br />
Step 8: Now turn <strong>to</strong> technical competitive analysis which is <strong>to</strong> nd and establish competitive advantages or <strong>to</strong> further<br />
enhance the existing advantages for restaurant C1, through comparing all the restaurants’ similar fried Chinese vegetables in<br />
terms of their technical performance on the nine identi ed HOWs. Although it is always not easy <strong>to</strong> acquire the technical<br />
performance levels of competi<strong>to</strong>rs’ products on the HOWs, restaurant C1 must try all the means <strong>to</strong> obtain this valuable<br />
information in order <strong>to</strong> know its technical strengths and weaknesses and hence <strong>to</strong> improve or enhance its competitiveness.<br />
Through a lot of e orts restaurant C1 obtains all the technical parameters of its own and its competi<strong>to</strong>rs’ fried Chinese<br />
vegetables in terms of the nine HOWs. This information forms a technical comparison matrix Y =[ynl] 9×4 as shown in<br />
Table 8 where, for example, amount of soy sauce the four restaurants use <strong>to</strong> make fried Chinese vegetables (H1) are 11,<br />
13, 8 and 9 ml, respectively, which form the rst column of the technical comparison matrix Y.<br />
Applying entropy method <strong>to</strong> Y in the same manner as in cus<strong>to</strong>mer competitive analysis (Step 3), technical competitive<br />
priority ratings can be obtained for restaurant C1’s fried Chinese vegetable on the nine HOWs:<br />
z =(z1;z2;:::;z9)=(0:1115; 0:1116; 0:1104; 0:1124; 0:1119; 0:1101; 0:1104; 0:1125; 0:1093):<br />
These ratings are shown in Table 8 from which we know that H8 and H4 are of the highest competitive priorities.<br />
According <strong>to</strong> the technical performance of its own and the other three restaurants’ fried Chinese vegetables in terms of<br />
the nine HOWs, restaurant C1 could set technical performance goal on each of the HOWs for its fried Chinese vegetable
134 L.-K. Chan, M.-L. Wu / Omega 33 (2005) 119 – 139<br />
<strong>to</strong> better ful ll the cus<strong>to</strong>mer needs. These goals should be determined both competitively and realistically. Suppose that<br />
restaurant C1’s relevant personnel agrees <strong>with</strong> the following performance goals on the HOWs for further improvement:<br />
b =(b1;b2;:::;b9)=(9; 8; 25; 300; 9; 6; 2; 3:5; 15):<br />
From these goal (bn) and current (yn1) technical performance levels, improvement ratios for restaurant C1’s fried Chinese<br />
vegetable <strong>to</strong> be competitive in terms of the HOWs can be easily computed using (15) as<br />
v =(v1;v2;:::;v9)=(1:2222; 1:3333; 1:2500; 1:2000; 1:2857; 1:3333; 1:2500; 1:1667; 1:3333):<br />
These goals and improvement ratios are shown in the last two columns of Table 8.<br />
Step 9: This is the last step of our proposed HOQ model. Integrating the initial technical ratings, technical competitive<br />
priority ratings and improvement ratios of the HOWs, nal technical ratings can be computed by (16). If initial technical<br />
ratings are crisp numbers, the nal technical ratings are also crisp numbers and given as<br />
s =(s1;s2;:::;s9)=(4:6595; 5:0541; 2:5948; 2:4250; 5:6622; 3:4637; 3:2933; 4:1163; 4:7578):<br />
Here, for example, the nal technical rating of H1 in crisp form, s1, is computed by (16) as<br />
s1 = v1 × t1 × z1 =(y11=b1) × t1 × z1 = (11=9) × 34:1866 × 0:1115 = 4:6595:<br />
From s we can rank the nal technical importance of the nine HOWs in the following order:<br />
H5 ≻ H2 ≻ H9 ≻ H1 ≻ H8 ≻ H6 ≻ H7 ≻ H3 ≻ H4: (21)<br />
This nal technical importance order di ers from the initial technical importance order (19) in two aspects: (i) H1 is of<br />
higher initial technical importance but lower nal technical importance than H2 and H9, and (ii) H6 is of lower initial<br />
technical importance but high nal technical importance than H7. Since technical competitive priority ratings (zn’s) do not<br />
vary <strong>to</strong>o much, these two di erences are mainly caused by the setting of performance goals (bn’s) or improvement ratios<br />
(vn’s): (i) H1’s improvement ratio (1.2222) is lower than H2’s (1.3333) and H9’s (1.3333), and (ii) H6’s improvement<br />
ratio (1.3333) is higher than H7’s (1.2500).<br />
If initial technical ratings are STFNs, then the nal technical ratings are also given as STFNs:<br />
˜s =(˜s1; ˜s2;:::; ˜s9) = ([3:1736; 6:4709]; [3:4313; 7:0324];<br />
[1:3741; 4:1451]; [1:2321; 3:9402]; [3:8956; 7:7724]; [2:0223; 5:2558];<br />
[1:9086; 5:0075]; [2:6774; 5:8689]; [3:1192; 6:7447]):<br />
Here, for example, the nal technical rating of H1 in STFN form, ˜s1, is computed by (16) and the arithmetic of<br />
STFNs as<br />
˜s1 = v1 × ˜t1 × z1 = (11=9) × [23:2850; 47:4773] × 0:1115 = [3:1736; 6:4709]:<br />
These fuzzy ratings produce the following ranking order for the HOWs’ nal importance:<br />
H5 ≻ H2 ≻ (H9;H1) ≻ H8 ≻ H6 ≻ H7 ≻ H3 ≻ H4: (22)<br />
It is noticed from (21) and (22) that the crisp and fuzzy ratings show an almost identical ranking order for the HOWs’<br />
nal technical importance. Both sets of ratings indicate that H5 is the most important HOW, followed by H2 and then by<br />
H9 and H1, and that H4 is the least important HOW, preceded by H3 and H7.<br />
These crisp and fuzzy nal technical ratings of the HOWs are shown in Table 9. In order <strong>to</strong> be comparable, they are<br />
both scaled <strong>to</strong> have maximum rating or upper limit of unity, which are also shown in Table 9. From these scaled ratings<br />
we can see again that, although the crisp and fuzzy ratings exhibit an identical trend, crisp ratings always tend <strong>to</strong> be<br />
close <strong>to</strong> the upper limits of the corresponding fuzzy ratings. This shows that fuzzy ratings are more representative of the<br />
possible variations of the HOWs’ technical importance, which would make the technical improvement more exible and<br />
the design process more feasible.<br />
The above nine steps complete the HOQ process for improving the fried Chinese vegetable. The corresponding tables of<br />
results, after appropriate arrangement, can form an HOQ like Fig. 2 which links cus<strong>to</strong>mer needs <strong>to</strong> technical considerations<br />
and exhibits all the relevant elements and their relationships. As a result of this HOQ model, it is concluded that H4<br />
could be deleted from further consideration (in QFD’s second phase, parts <strong>deployment</strong>) <strong>to</strong> save technical e orts <strong>with</strong>out<br />
decreasing cus<strong>to</strong>mer satisfaction. If resource or budget considerations require <strong>to</strong> further cut down the number of HOWs,<br />
H3;H7 and H6 form a good deleting order that will not signi cantly in uence the ful llment of the cus<strong>to</strong>mer needs.
Table 9<br />
Crisp and fuzzy nal technical ratings of the nine HOWs<br />
L.-K. Chan, M.-L. Wu / Omega 33 (2005) 119 – 139 135<br />
HOWs Final technical ratings Scaled nal technical ratings<br />
Crisp (sn) Fuzzy (˜sn) Crisp Fuzzy<br />
H1 4.6595 [3.1736, 6.4709] 0.8229 [0.4083, 0.8326]<br />
H2 5.0541 [3.4313, 7.0324] 0.8926 [0.4415, 0.9048]<br />
H3 2.5948 [1.3741, 4.1451] 0.4583 [0.1768, 0.5333]<br />
H4 2.4250 [1.2321, 3.9402] 0.4283 [0.1585, 0.5069]<br />
H5 5.6622 [3.8956, 7.7724] 1.0000 [0.5012, 1.0000]<br />
H6 3.4637 [2.0223, 5.2558] 0.6117 [0.2602, 0.6762]<br />
H7 3.2933 [1.9086, 5.0075] 0.5816 [0.2456, 0.6443]<br />
H8 4.1163 [2.6774, 5.8689] 0.7270 [0.3445, 0.7551]<br />
H9 4.7578 [3.1192, 6.7447] 0.8403 [0.4013, 0.8678]<br />
5. About the probability fac<strong>to</strong>rs and correlation matrices<br />
As mentioned in Section 2.2, our proposed 9-step HOQ model has two major exclusions <strong>to</strong> make the model simple and<br />
uni ed. One is the probabilities <strong>to</strong> achieve the goals set for the HOWs, and one is the two correlation matrices. Certainly<br />
these two omitted parts involve some degree of di culties <strong>to</strong> be dealt <strong>with</strong>. But for the completeness of this study, here<br />
we provide some considerations about them and suggest some ways <strong>to</strong> handle them in a potentially more comprehensive<br />
HOQ model.<br />
5.1. Probabilities <strong>to</strong> achieve goals for HOWs<br />
A seemingly natural <strong>approach</strong> is <strong>to</strong> directly incorporate these probabilities in<strong>to</strong> formula (16) for calculating the HOWs’<br />
nal technical ratings:<br />
nal technical rating of a HOW (sn)<br />
= improvement ratio (vn) × initial technical rating (tn)<br />
× technical competitive priority (zn) × probability <strong>to</strong> achieve the goal for the HOW: (23)<br />
However, there is an apparent problem <strong>with</strong> this <strong>approach</strong>, i.e., the possibly serious overlapping of information contained<br />
in improvement ratios, technical competitive assessments and probability fac<strong>to</strong>rs. This is because the determination of the<br />
probability fac<strong>to</strong>rs, no matter easy or not, depends largely on improvement ratios and technical competitive assessments.<br />
So the direct inclusion of these probabilities in<strong>to</strong> the calculation of the HOWs’ nal technical ratings will overestimate or<br />
underestimate some underlying fac<strong>to</strong>rs, resulting in the overestimation or underestimation of some HOWs’ nal importance.<br />
As a result, we suggest that practitioners employ the simpler formula (16) in our proposed 9-step HOQ model rather than<br />
formula (23) <strong>to</strong> compute the HOWs’ nal technical ratings.<br />
5.2. Correlations among WHATs andamong HOWs<br />
Correlations among the HOWs are mentioned and included in many QFD studies, but are seldom incorporated in<strong>to</strong> the<br />
calculation of the HOWs’ nal ratings. Very few studies include or even mention the correlations among the WHATs,<br />
not <strong>to</strong> say <strong>to</strong> incorporate such correlations in<strong>to</strong> the calculation of the WHATs’ nal ratings. One reason for these is the<br />
di culty in obtaining the relevant data since, although they can be measured using appropriate scales such as (1), (6) or<br />
(10), correlations among the HOWs and among the WHATs require the technicians and the cus<strong>to</strong>mers <strong>to</strong> make a lot of<br />
pair-wise comparisons about the degrees <strong>to</strong> which the HOWs and the WHATs are inter-related. This would be tedious<br />
and di cult from the cus<strong>to</strong>mer’s perspective, although it is possible from the technician’s side.<br />
Another equal important reason is that, although these correlations are useful in analyzing the WHATs and especially<br />
the HOWs, there seem few, if any, good methods <strong>to</strong> incorporate the correlations in<strong>to</strong> the calculation of the WHATs’ and<br />
the HOWs’ nal ratings. Most of times people simply use formulas (5) and (7) <strong>to</strong> obtain these nal ratings, ignoring the<br />
correlations among the HOWs and among the WHATs even if they are available. This seems common not only in QFD,<br />
but also in other similar situations. For example, s<strong>to</strong>ck index for a given market is simply the weighted average of the
136 L.-K. Chan, M.-L. Wu / Omega 33 (2005) 119 – 139<br />
prices of the constituent s<strong>to</strong>cks in the market, and no correlations among the s<strong>to</strong>ck prices are considered although these<br />
correlations are useful as well as available.<br />
Among the very few <strong>approach</strong>es found in the QFD literature <strong>to</strong> dealing <strong>with</strong> the correlations, a noticeable one is<br />
proposed by Khoo and Ho [12]. For a target WHAT (or HOW), the <strong>approach</strong> determines its importance rating as linear<br />
combination of its correlations <strong>with</strong> other WHATs weighted by the WHATs’ initial importance ratings:<br />
importance rating of a WHAT<br />
= � (initial importance rating of other WHAT<br />
×value of correlation between the target WHAT and other WHAT); (24)<br />
where the summation is over all WHATs. This method makes some intuitive sense, although it apparently tends <strong>to</strong><br />
overestimate/underestimate the importance ratings of those WHATs (or HOWs) <strong>with</strong> positive/negative correlations <strong>with</strong><br />
other WHATs. Therefore, if we have the required correlations and if we think this <strong>approach</strong> is appropriate, we may<br />
consider the so obtained importance ratings for WHATs (or HOWs) by formula (24) as the “new” initial importance<br />
ratings and then employ our formula (13) (or (16) for HOWs) <strong>to</strong> get the nal importance ratings.<br />
6. Conclusions<br />
In the literature, di erent authors build di erent house of <strong>quality</strong> (HOQ) models that contain di erent elements and<br />
employ di erent scales <strong>to</strong> measure the relevant concepts, which may puzzle the practitioners as which HOQ models<br />
should be used. This paper presents a <strong>systematic</strong> and operational <strong>approach</strong> <strong>to</strong> HOQ <strong>to</strong> help resolve this problem. We rst<br />
give a comprehensive description of the relevant elements in HOQ. Then we propose a 9-step HOQ model <strong>to</strong> unify the<br />
HOQ process and a few 9-point scales <strong>to</strong> unify the measurements in HOQ <strong>to</strong> avoid arbitrariness and incomparability.<br />
We especially address the various “voices” in the HOQ process and suggest the use of symmetrical triangular fuzzy<br />
numbers (STFNs) <strong>to</strong> re ect the vagueness in people’s linguistic assessments. Furthermore, since the commonly used sales<br />
point concept is quite subjective, we employ the quantitative entropy method <strong>to</strong> conduct competitive analysis and derive<br />
competitive priority ratings. All information required, computations involved and feasible methods are clearly indicated <strong>to</strong><br />
give an applicable framework for practitioners <strong>to</strong> perform HOQ analysis <strong>with</strong>out confusions and di culties.<br />
To <strong>full</strong>y illustrate our proposed HOQ model, we present a fried Chinese vegetable example that involves 10 cus<strong>to</strong>mer<br />
needs (WHATs), nine technical measures (HOWs) and ve restaurants. Although many studies on QFD have been done<br />
and a lot of QFD applications have been reported (see Ref. [25] for a review), there are according <strong>to</strong> our knowledge few<br />
complete QFD cases or examples published. This causes problems for practitioners <strong>to</strong> apply the QFD technique <strong>to</strong> their<br />
product or service improvement processes. QFD is a complex and time-consuming process that involves many concepts <strong>to</strong><br />
understand, much information <strong>to</strong> collect and many computations <strong>to</strong> perform. A complete and operational description of the<br />
QFD process will facilitate its wide applications, and a <strong>full</strong> example illustrating all the concepts, information collecting,<br />
computation and implementation steps will undoubtedly be helpful. Our paper, especially the example presented, is <strong>to</strong>wards<br />
such a purpose.<br />
Our proposed 9-step HOQ model, although quite comprehensive and uni ed in nature, admittedly makes two major<br />
exclusions: one is the probability fac<strong>to</strong>rs for achieving the goals for HOWs, another is the two correlation matrices of<br />
the WHATs and the HOWs. Since these two parts involve certain degrees of di culties, they are omitted <strong>to</strong> make our<br />
model simpler and more operable. Of course, this does not mean they are unimportant for the QFD process. We discuss<br />
in some detail the problems associated <strong>with</strong> the two omitted parts, and also suggest some possible <strong>approach</strong>es <strong>to</strong> directly<br />
incorporate them in<strong>to</strong> the relevant calculations <strong>with</strong>in a potentially enlarged HOQ model. Further e orts in this aspect<br />
through sharing of research and application experiences are highly welcome <strong>to</strong> make the QFD process more complete.<br />
Acknowledgements<br />
The authors grate<strong>full</strong>y acknowledge the support for this study from the Research Grants Council of Hong Kong and<br />
the City University of Hong Kong, and the valuable comments on an earlier version of this paper from an anonymous<br />
referee.
Appendix. Fuzzy and entropy methods<br />
A.1. Fuzzy methodfor vagueness representation<br />
L.-K. Chan, M.-L. Wu / Omega 33 (2005) 119 – 139 137<br />
Fuzzy set theory was developed for solving problems in which descriptions of objects are subjective, vague and imprecise,<br />
i.e., no boundaries for the objects can be well de ned. Let X = {x} be a traditional set of objects, called the<br />
universe. A fuzzy set ˜F in X is characterized by a membership <strong>function</strong> F(x) ˜ that associates each object in X <strong>with</strong> a<br />
membership value in the interval [0, 1], indicating the degree of the object belonging <strong>to</strong> ˜F.<br />
A fuzzy number is a special fuzzy set when the universe X is the real line R 1 : −∞¡x¡+∞. A symmetrical triangular<br />
fuzzy number (STFN), denoted as ˜F =[a; c], is a special fuzzy number <strong>with</strong> the following symmetrical triangular type of<br />
membership <strong>function</strong>:<br />
F(x)=1−|x ˜<br />
− (c + a)=2|=[(c − a)=2]; a6x6c: STFN is widely used in practice <strong>to</strong> represent a fuzzy set or concept ˜F = “approximately b” where b =(a + c)=2. For<br />
example, if cus<strong>to</strong>mer need W1= “appetizing” is rated as having “very high” importance by a cus<strong>to</strong>mer, then traditionally<br />
we may assign W1 a number 9 using scale (8). To capture the vagueness of the cus<strong>to</strong>mer’s subjective assessment, we<br />
can according <strong>to</strong> the same scale (8) assign W1 an STFN [8,10] which means “approximately 9” and is represented by the<br />
following membership <strong>function</strong>:<br />
[8;10](x)=1−|x − 9|; 8 6 x 6 10:<br />
This means that, for example, the membership value or “possibility” that W1= “appetizing” is assigned a number 9 is<br />
[8;10](9)=1, the “possibility” that W1 is assigned a number 8.5 or 9.5 is [8;10](8:5)=0:5 or [8;10](9:5)=0:5. So assigning<br />
W1 a number 8.5 or 9.5 is acceptable or “possible” <strong>to</strong> the degree of 50%.<br />
The basic arithmetic rules for STFNs are as follows:<br />
Addition: [a1;c1]+[a2;c2]=[a1 + a2;c1 + c2].<br />
Subtraction: [a1;c1] − [a2;c2]=[a1−c2;c1−a2].<br />
Scalar multiplication: k × [a1;c1]=[ka1;kc1]; k¿0.<br />
Multiplication: [a1;c1] × [a2;c2] ∼ = [a1a2;c1c2], a1 ¿ 0; a2 ¿ 0.<br />
Division: [a1;c1] ÷ [a2;c2] ∼ = [a1=c2;c1=a2], a1 ¿ 0; a2 ¿ 0.<br />
For any two STFNs, ˜F 1 =[a1;c1] and ˜F 2 =[a2;c2], if one interval is not strictly contained by another then their ranking<br />
order can be easily and intuitively determined. That is<br />
• If c2 ¿c1 and a2 ¿ a1, orc2 ¿ c1 and a2 ¿a1, then ˜F 2 ≻ ˜F 1, where “≻” means “is more preferred (important, superior,<br />
etc.) than”.<br />
• If c2 = c1 and a2 = a1, then ˜F 2 = ˜F 1.<br />
But if one interval is strictly contained by another, i.e., if c2 ¡c1 and a2 ¿a1, orc2 ¿c1 and a2 ¡a1, then the ranking<br />
problem becomes complex and many possibilities may occur.<br />
For more details about fuzzy set theory, STFNs and fuzzy ranking methods, see Refs. [13,26–29].<br />
A.2. Entropy methodfor competitive priority ratings<br />
In our HOQ model, Step 3 is <strong>to</strong> obtain and analyze the following cus<strong>to</strong>mer comparison matrix:<br />
X =<br />
W1<br />
W2<br />
···<br />
WM<br />
C1 C2 ··· CL<br />
⎡<br />
⎤<br />
x11 x12 ··· x1L<br />
⎢<br />
⎥<br />
⎢ x21 x22 ⎢<br />
··· x2L ⎥<br />
⎢<br />
⎥<br />
⎢<br />
⎣ ··· ··· ··· ··· ⎥<br />
⎦<br />
xM1 xM2 ··· xML<br />
M×L<br />
;<br />
where xml is the performance of company l’s product on cus<strong>to</strong>mer need Wm, perceived by the cus<strong>to</strong>mers. Based on this<br />
X information, the producing company C1 may set priorities for its product on the M cus<strong>to</strong>mer needs in order <strong>to</strong> achieve<br />
a relative competitive advantage over other companies. If company C1 performs much better than many other companies
138 L.-K. Chan, M.-L. Wu / Omega 33 (2005) 119 – 139<br />
in terms of a cus<strong>to</strong>mer need Wm, then further improvement may not be urgently needed and thus a lower priority could<br />
be assigned <strong>to</strong> Wm. At the other extreme, if C1 performs much worse than many other companies on Wm, then it may<br />
be di cult for C1 <strong>to</strong> build a competitive advantage <strong>with</strong>in a short period of time. In both cases, Wm could be assigned<br />
a lower priority rating. However, if most companies perform quite similarly on Wm, not <strong>to</strong>o much improvement e ort<br />
from C1 may result in a better performance of its product and give C1 a unique competitive advantage. Thus a higher<br />
priority could be assigned <strong>to</strong> Wm. In particular, if all companies’ performances on Wm are the same, it implies a great<br />
market opportunity since any improvement would create a signi cant competitive advantage. So the highest priority could<br />
be assigned <strong>to</strong> Wm. This basis of assigning priorities is interestingly related <strong>to</strong> the entropy concept in information theory.<br />
Entropy is a measure for the amount of information (or uncertainty, variations) represented by a discrete probability<br />
distribution, p1;p2;:::;pL:<br />
L�<br />
pl ln(pl); (A.1)<br />
E(p1;p2;:::;pL)=− L<br />
l=1<br />
where L =1=ln(L) is a normalization constant <strong>to</strong> guarantee 0 6 E(p1;p2;:::;pL) 6 1. Larger entropy or E(p1;p2;:::;pL)<br />
value implies smaller variations among the pl’s and hence less information contained in the distribution. For the mth row<br />
of the cus<strong>to</strong>mer comparison matrix X corresponding <strong>to</strong> the cus<strong>to</strong>mer need Wm;xm1;xm2;:::;xmL, let xm = �L l=1 xml be the<br />
<strong>to</strong>tal score <strong>with</strong> respect <strong>to</strong> Wm. Then according <strong>to</strong> (A.1), the normalized ratings pml = xml=xm for l =1; 2;:::;L can be<br />
viewed as the “probability distribution” of Wm on the L companies <strong>with</strong> entropy as<br />
L�<br />
L�<br />
(xml=xm)ln(xml=xm): (A.2)<br />
E(Wm)=− L<br />
l=1<br />
pml ln(pml)=− L<br />
l=1<br />
It is clear that the larger the E(Wm) value, the less information contained in Wm or smaller variations among the pml’s<br />
(or xml’s). If all companies’ performance ratings on Wm;xm1;xm2;:::;xmL, are the same, Wm has zero variations and E(Wm)<br />
achieves its maximum of 1. So E(Wm) can be used <strong>to</strong> re ect the relative competitive advantage in terms of the cus<strong>to</strong>mer<br />
need Wm. All these E(Wm) values, after normalization:<br />
�<br />
M�<br />
em = E(Wm) E(Wm); m=1; 2;:::;M (A.3)<br />
m=1<br />
can be considered as the cus<strong>to</strong>mer competitive priority ratings for company C1 on the M cus<strong>to</strong>mer needs, <strong>with</strong> a larger<br />
em indicating higher competitive priority for the corresponding Wm.<br />
For more on entropy and its applications, see Refs. [13,22,30–32].<br />
References<br />
[1] Sullivan LP. Quality <strong>function</strong> <strong>deployment</strong>. Quality Progress 1986;19(6):39–50.<br />
[2] American Supplier Institute. Quality <strong>function</strong> <strong>deployment</strong> (service QFD): 3-day workshop. Dearborn, MI: ASI Press; 1994.<br />
[3] Day RG. Quality <strong>function</strong> <strong>deployment</strong>: linking a company <strong>with</strong> its cus<strong>to</strong>mers. Milwaukee, WI: ASQC Quality Press; 1993.<br />
[4] Eureka WE, Nancy ER. The cus<strong>to</strong>mer-driven company: managerial perspective on <strong>quality</strong> <strong>function</strong> <strong>deployment</strong>, 2nd ed. Dearborn,<br />
MI: ASI Press, Burr Ridge, IL: Irwin; 1994.<br />
[5] Hauser JR, Clausing D. The house of <strong>quality</strong>. Harvard Business Review 1988;66(3):63–73.<br />
[6] Bossert JL. Quality <strong>function</strong> <strong>deployment</strong>: a practitioner’s <strong>approach</strong>. Milwaukee, WI: ASQC Quality Press; 1991.<br />
[7] Cohen L. Quality <strong>function</strong> <strong>deployment</strong>: how <strong>to</strong> make QFD work for you. Reading, MA: Addison-Wesley; 1995.<br />
[8] Gri n A, Hauser JR. The voice of the cus<strong>to</strong>mer. Marketing Science 1993;12(1):1–27.<br />
[9] Guinta LR, Praizler NC. The QFD book: the team <strong>approach</strong> <strong>to</strong> solving problems and satisfying cus<strong>to</strong>mers through <strong>quality</strong> <strong>function</strong><br />
<strong>deployment</strong>. New York: Amacom; 1993.<br />
[10] Balthazard PA, Gargeya VB. Reinforcing QFD <strong>with</strong> group support systems: computer supported collaboration for <strong>quality</strong> in design.<br />
International Journal of Quality & Reliability Management 1995;12(6):43–62.<br />
[11] Moskowitz H, Kim KJ. QFD optimizer: a novice friendly <strong>quality</strong> <strong>function</strong> <strong>deployment</strong> decision support system for optimizing product<br />
designs. Computers & Industrial Engineering 1997;32(3):641–55.<br />
[12] Khoo LP, Ho NC. Framework of a fuzzy <strong>quality</strong> <strong>function</strong> <strong>deployment</strong> system. International Journal of Production Research<br />
1996;34(2):299–311.<br />
[13] Chan LK, Kao HP, Ng A, Wu ML. Rating the importance of cus<strong>to</strong>mer needs in <strong>quality</strong> <strong>function</strong> <strong>deployment</strong> by fuzzy and entropy<br />
methods. International Journal of Production Research 1999;37(11):2499–518.<br />
[14] Chan LK, Wu ML. Quality <strong>function</strong> <strong>deployment</strong>: a comprehensive review of its concepts and methods. Quality Engineering<br />
2002;15(1):23–35.<br />
[15] Chan LK, Wu ML. Prioritizing the technical measures in <strong>quality</strong> <strong>function</strong> <strong>deployment</strong>. Quality Engineering 1998;10(3):467–79.<br />
[16] Belhe U, Kusiak A. The house of <strong>quality</strong> in a design process. International Journal of Production Research 1986;34(8):2119–31.
L.-K. Chan, M.-L. Wu / Omega 33 (2005) 119 – 139 139<br />
[17] Saaty TL. The analytic hierarchy process: planning, priority setting, resource allocation. Pittsburgh, PA: RWS Publications; 1988.<br />
[18] Elmore PE, Beggs DL. Salience of concepts and commitment <strong>to</strong> extreme judgements in response pattern of teachers. Education<br />
1975;95(4):325–34.<br />
[19] Miller GA. The magic number of seven, plus or minus two. Psychological Review 1965;63:81–97.<br />
[20] Olsson U. On the robustness of fac<strong>to</strong>r analysis against crude classi cation of the observations. Multivariate Behavioral Research<br />
1979;14:485–500.<br />
[21] Hwang CL, Yoon K. Multiple attribute decision making: methods and applications. Berlin: Springer; 1981.<br />
[22] Yoon K, Hwang CL. Multiple attribute decision making: an introduction. Thousand Oaks, CA: Sage; 1995.<br />
[23] Parkan C, Wu ML. On the equivalence of operational performance measurement and multiple-attribute decision making. International<br />
Journal of Production Research 1997;35(11):2963–88.<br />
[24] Parkan C, Wu ML. Comparison of three modern multi-criteria decision making <strong>to</strong>ols. International Journal of Systems Science<br />
2000;31(4):497–517.<br />
[25] Chan LK, Wu ML. Quality <strong>function</strong> <strong>deployment</strong>: a literature review. European Journal of Operational Research 2002;143(3):<br />
463–97.<br />
[26] Bor<strong>to</strong>lan G, Degani RT. A review of some methods for ranking fuzzy subsets. Fuzzy Sets and Systems 1985;15(1):1–19.<br />
[27] Chen SJ, Hwang CL. Fuzzy multiple attribute decision making: methods and applications. Berlin: Springer; 1992.<br />
[28] Dubois D, Prade H. Fuzzy sets and systems: theory and applications. New York: Academic Press; 1980.<br />
[29] Zimmermann HJ. Fuzzy set, decision making and expert system. Bos<strong>to</strong>n: Kluwer; 1987.<br />
[30] Alpert MI. De nition of determinant attributes: a comparison of methods. Journal of Marketing Research 1971;8:184–91.<br />
[31] Moinpur R, Wiley JB. Application of multi-attribute models of attribute in marketing. Journal of Business Administration 1974;5(2):<br />
3–16.<br />
[32] Zeleny M. Multiple criteria decision making. New York: McGraw-Hill; 1982.