01 | 2015 msg systems study
Sourcing in China
Sourcing in China

Create successful ePaper yourself
Turn your PDF publications into a flip-book with our unique Google optimized e-Paper software.
Insights on China’s Economic Situation<br />
and its Repercussion on Global Sourcing<br />
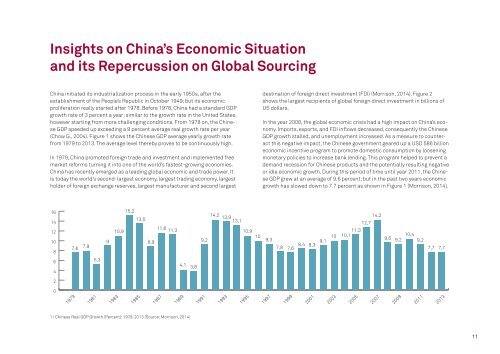
China initiated its industrialization process in the early 1950s, after the<br />
establishment of the People’s Republic in October 1949; but its economic<br />
proliferation really started after 1978. Before 1978, China had a standard GDP<br />
growth rate of 3 percent a year; similar to the growth rate in the United States,<br />
however starting from more challenging conditions. From 1978 on, the Chinese<br />
GDP speeded up exceeding a 9 percent average real growth rate per year<br />
(Chow G., 2004). Figure 1 shows the Chinese GDP average yearly growth rate<br />
from 1979 to 2<strong>01</strong>3. The average level thereby proves to be continuously high.<br />
In 1979, China promoted foreign trade and investment and implemented free<br />
market reforms turning it into one of the world’s fastest-growing economies.<br />
China has recently emerged as a leading global economic and trade power. It<br />
is today the world’s second-largest economy, largest trading economy, largest<br />
holder of foreign exchange reserves, largest manufacturer and second largest<br />
destination of foreign direct investment (FDI) (Morrison, 2<strong>01</strong>4). Figure 2<br />
shows the largest recipients of global foreign direct investment in billions of<br />
US dollars.<br />
In the year 2008, the global economic crisis had a high impact on China’s economy.<br />
Imports, exports, and FDI inflows decreased, consequently the Chinese<br />
GDP growth stalled, and unemployment increased. As a measure to counteract<br />
this negative impact, the Chinese government geared up a USD 586 billion<br />
economic incentive program to promote domestic consumption by loosening<br />
monetary policies to increase bank lending. This program helped to prevent a<br />
demand recession for Chinese products and the potentially resulting negative<br />
or idle economic growth. During this period of time until year 2<strong>01</strong>1, the Chinese<br />
GDP grew at an average of 9.6 percent; but in the past two years economic<br />
growth has slowed down to 7.7 percent as shown in Figure 1 (Morrison, 2<strong>01</strong>4).<br />
16<br />
14<br />
12<br />
10<br />
8<br />
9<br />
15,2<br />
13,5<br />
10,9<br />
8,9<br />
9,2<br />
14,2 13,9 13,1<br />
10,9<br />
11,3<br />
10 9,3<br />
7,8 7,6 8,4 8,3 9,1 10 10,1<br />
12,7<br />
14,2<br />
9,6 9,2<br />
10,4<br />
9,2<br />
7,7 7,7<br />
7,6 7,9 5,3<br />
11,6 11,3<br />
4,1<br />
6<br />
4<br />
3,8<br />
2<br />
0<br />
1979<br />
1981<br />
1983<br />
1985<br />
1987<br />
1989<br />
1991<br />
1993<br />
1995<br />
1997<br />
1999<br />
20<strong>01</strong><br />
2003<br />
2005<br />
2007<br />
2009<br />
2<strong>01</strong>1<br />
2<strong>01</strong>3<br />
1 | Chinese Real GDP Growth (Percent): 1979-2<strong>01</strong>3 (Source: Morrison, 2<strong>01</strong>4)<br />
11