01 | 2015 msg systems study
Sourcing in China
Sourcing in China

Create successful ePaper yourself
Turn your PDF publications into a flip-book with our unique Google optimized e-Paper software.
Methodology and Sample<br />
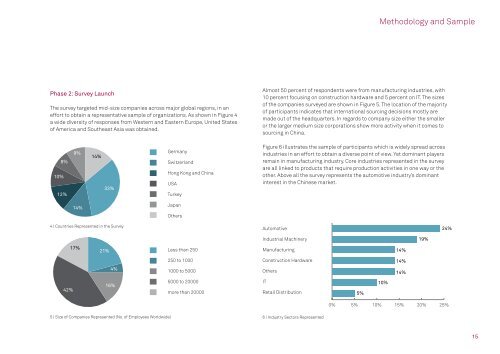
Phase 2: Survey Launch<br />
The survey targeted mid-size companies across major global regions, in an<br />
effort to obtain a representative sample of organizations. As shown in Figure 4<br />
a wide diversity of responses from Western and Eastern Europe, United States<br />
of America and Southeast Asia was obtained.<br />
Almost 50 percent of respondents were from manufacturing industries, with<br />
10 percent focusing on construction hardware and 5 percent on IT. The sizes<br />
of the companies surveyed are shown in Figure 5. The location of the majority<br />
of participants indicates that international sourcing decisions mostly are<br />
made out of the headquarters. In regards to company size either the smaller<br />
or the larger medium size corporations show more activity when it comes to<br />
sourcing in China.<br />
10%<br />
8%<br />
12%<br />
9%<br />
14%<br />
33%<br />
Germany<br />
Switzerland<br />
Hong Kong and China<br />
USA<br />
Turkey<br />
Figure 6 illustrates the sample of participants which is widely spread across<br />
industries in an effort to obtain a diverse point of view. Yet dominant players<br />
remain in manufacturing industry. Core industries represented in the survey<br />
are all linked to products that require production activities in one way or the<br />
other. Above all the survey represents the automotive industry’s dominant<br />
interest in the Chinese market.<br />
14%<br />
Japan<br />
Others<br />
4 | Countries Represented in the Survey<br />
Automotive<br />
24%<br />
Industrial Machinery<br />
19%<br />
17%<br />
21%<br />
Less than 250<br />
Manufacturing<br />
14%<br />
4%<br />
250 to 1000<br />
1000 to 5000<br />
Construction Hardware<br />
Others<br />
14%<br />
14%<br />
42%<br />
16%<br />
5000 to 20000<br />
more than 20000<br />
IT<br />
Retail Distribution<br />
5%<br />
10%<br />
0% 5% 10% 15% 20% 25%<br />
5 | Size of Companies Represented (No. of Employees Worldwide) 6 | Industry Sectors Represented<br />
15