01 | 2015 msg systems study
Sourcing in China
Sourcing in China

Create successful ePaper yourself
Turn your PDF publications into a flip-book with our unique Google optimized e-Paper software.
Results and Outcomes of the Survey – Suppliers and Quality<br />
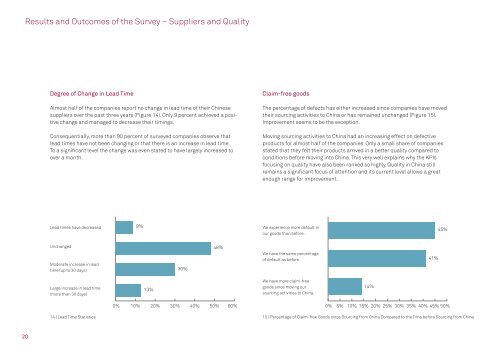
Degree of Change in Lead Time<br />
Almost half of the companies report no change in lead time of their Chinese<br />
suppliers over the past three years (Figure 14). Only 9 percent achieved a positive<br />
change and managed to decrease their timings.<br />
Consequentially, more than 90 percent of surveyed companies observe that<br />
lead times have not been changing or that there is an increase in lead time.<br />
To a significant level the change was even stated to have largely increased to<br />
over a month.<br />
Claim-free goods<br />
The percentage of defects has either increased since companies have moved<br />
their sourcing activities to China or has remained unchanged (Figure 15).<br />
Improvement seems to be the exception.<br />
Moving sourcing activities to China had an increasing effect on defective<br />
products for almost half of the companies. Only a small share of companies<br />
stated that they felt their products arrived in a better quality compared to<br />
conditions before moving into China. This very well explains why the KPIs<br />
focusing on quality have also been ranked so highly. Quality in China still<br />
remains a significant focus of attention and its current level allows a great<br />
enough range for improvement.<br />
Lead times have decreased<br />
9%<br />
We experience more default in<br />
our goods than before.<br />
45%<br />
Unchanged<br />
Moderate increase in lead<br />
time (up to 30 days)<br />
30%<br />
48%<br />
We have the same percentage<br />
of default as before.<br />
41%<br />
Large increase in lead time<br />
(more than 30 days)<br />
13%<br />
We have more claim-free<br />
goods since moving our<br />
sourcing activities to China.<br />
14%<br />
0% 10% 20% 30% 40% 50% 60% 0% 5% 10% 15% 20% 25% 30% 35% 40% 45% 50%<br />
14 | Lead Time Statistics 15 | Percentage of Claim-free Goods since Sourcing from China Compared to the Time before Sourcing from China<br />
20