


Module 3 - Benjamin-Mills
Module 3 - Benjamin-Mills
Module 3 - Benjamin-Mills

Create successful ePaper yourself
Turn your PDF publications into a flip-book with our unique Google optimized e-Paper software.
EP2.3<br />
Using nuclear magnetic<br />
resonance (n.m.r.)<br />
spectroscopy for structure<br />
determination<br />
In this activity you will have practice in analysing<br />
n.m.r. spectra of organic compounds.<br />
Introduction<br />
In Part 1 of this activity you will analyse the n.m.r spectra of a range of simple<br />
organic compounds. In Part 2, the n.m.r spectra of three different nitrogencontaining<br />
compounds, one of which is the analgesic paracetamol, will be<br />
considered. You will then be asked to make predictions about the infrared<br />
spectrum of paracetamol.<br />
The typical resonance positions for various hydrogen atoms, expressed as<br />
chemical shifts, are given in the Data Sheets (Table 23). Some of the compounds<br />
in this activity contain hydrogen atoms attatched to oxygen and nitrogen atoms.<br />
The chemical shifts for both N–H and O–H can be variable, the value depending<br />
on several factors. They are usually broad peaks.<br />
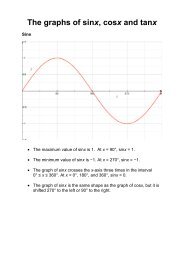
The shape of the signal given by any particular hydrogen atom is related to the<br />
number of neighbouring hydrogen atoms on adjacent carbons, as summarised in<br />
Table 1. This rule does not always apply to hydrogen atoms on oxygen or nitrogen.<br />
Number of<br />
H atoms on<br />
adjacent Shape of signal<br />
C atoms<br />
0 single peak – singlet<br />
1 two close peaks – doublet<br />
2 three close peaks – triplet<br />
3 four close peaks – quartet<br />
Table 1 Shape of n.m.r. signal in relation to the<br />
number of neighbouring hydrogen atoms on<br />
adjacent carbon atoms. These splittings are only<br />
seen clearly in high resolution spectra.<br />
What you do<br />
Part 1: N.m.r. spectra of simple organic compounds<br />
a<br />
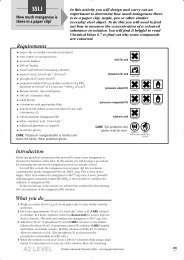
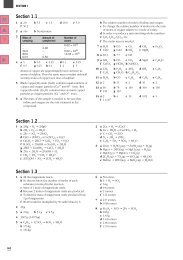
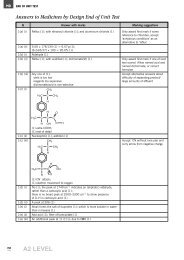
Figures 1, 2 and 3 show the 1 H (proton) n.m.r. spectra of ethanol,<br />
ethanal and ethanoic acid respectively.<br />
i Draw the full structural formula of each of these molecules.<br />
ii Identify the hydrogen atoms responsible for each of the signals in<br />
the spectra.<br />
Absorption<br />
2H<br />
1H<br />
3H<br />
TMS<br />
Figure 1 The n.m.r. spectrum<br />
of ethanol<br />
10<br />
9<br />
8<br />
7<br />
6 5 4<br />
Chemical shift<br />
3<br />
2<br />
1<br />
0<br />
Absorption<br />
1H<br />
3H<br />
TMS<br />
Figure 2 The n.m.r. spectrum<br />
of ethanal<br />
10<br />
9<br />
8<br />
7<br />
6 5 4<br />
Chemical shift<br />
3<br />
2<br />
1<br />
0<br />
Absorption<br />
1H<br />
3H<br />
TMS<br />
Figure 3 The n.m.r. spectrum<br />
of ethanoic acid<br />
12<br />
11<br />
10<br />
9<br />
8<br />
7<br />
6 5<br />
Chemical shift<br />
4<br />
3<br />
2<br />
1<br />
0<br />
„ Salters Advanced Chemistry 2000 – see Copyright restrictions<br />
175


![ISI Web of Knowledge [v.4.10] - All Databases Results - Benjamin-Mills](https://img.yumpu.com/39253071/1/184x260/isi-web-of-knowledge-v410-all-databases-results-benjamin-mills.jpg?quality=85)