


Module 3 - Benjamin-Mills
Module 3 - Benjamin-Mills
Module 3 - Benjamin-Mills

Create successful ePaper yourself
Turn your PDF publications into a flip-book with our unique Google optimized e-Paper software.
Salters Advanced Chemistry<br />
<strong>Module</strong> 3 Activities Booklet<br />
Chemistry of Materials<br />
2849<br />
DP<br />
EP<br />
SS<br />
Designer Polymers<br />
Engineering Proteins<br />
The Steel Story<br />
Unit WM (What’s in a Medicine?) is examined as part of this module (2849), but<br />
we’ve put the activities from WM in the 2848 Activities Booklet (the pink one).
Chemistry of Materials<br />
<strong>Module</strong> 3 – 2849 - Activities Booklet<br />
Designer Polymers<br />
DP2.1 Making nylon 162<br />
DP2.2 Taking nylon apart 163<br />
DP4 Comparing models of nylon-6,6 and Kevlar 166<br />
DP5 Bubble gum – or bubble glass? 167<br />
DP8 Check your notes on Designer Polymers 3<br />
Engineering Proteins<br />
EP2.1 Investigating amines and amino acids 171<br />
EP2.2 What’s in aspartame? 173<br />
EP2.3 Using nuclear magnetic resonance (n.m.r.) spectroscopy for structure determination 175<br />
EP2.4 The shapes of α-amino acids 179<br />
EP2.5 A testing smell 180<br />
EP2.6 Taking note of proteins 181<br />
EP2.7 Modelling DNA 182<br />
EP2.8 Life reveals its twisted secret 183<br />
EP6.1 Testing for glucose 187<br />
EP6.2 Succinate dehydrogenase (Optional extension) 188<br />
EP6.3 The effect of enzyme and substrate concentrations on the rate of a reaction 189<br />
EP6.4 Using the iodine clock method to find the order of a reaction 191<br />
EP6.5 Enzyme kinetics 194<br />
EP7 Check your notes on Engineering Proteins 2<br />
The Steel Story<br />
SS1.1 How much manganese is there in a paper clip? 201<br />
SS1.2 A redox titration 204<br />
SS2.1 Why is blast furnace iron so impure? 206<br />
SS2.2 What changes occur during steelmaking? 207<br />
SS2.3 Getting the ‘heat balance’ right (Optional extension) 209<br />
SS2.4 How much aluminium do we need to add? (Optional extension) 211<br />
SS2.5 Which is the right steel for the job? (Optional extension) 212<br />
SS3.1 A simple redox reaction 215<br />
SS3.2 Simple electrochemical cells 216<br />
SS3.3 More electrochemical cells 218<br />
SS3.4 How does steel rust? 220<br />
SS3.5 Understanding redox reactions 223<br />
SS5.1 Investigating the various oxidation states of vanadium 234<br />
SS5.2 How do transition metal ions act as catalysts? 227<br />
SS5.3 Looking at some transition metal complexes 229<br />
SS6 Check your notes on The Steel Story 3
DP2.1<br />
Making nylon<br />
A nylon is made from its monomers by condensation<br />
polymerisation. You may already have done this or a<br />
similar experiment in an earlier course. If so, you can<br />
omit this activity and go on to Activity DP2.2.<br />
Requirements<br />
●<br />
●<br />
●<br />
●<br />
●<br />
●<br />
●<br />
5cm 3 beaker<br />
decanedioyl dichloride, 5% solution in cyclohexane<br />
(1 cm 3 )<br />
1,6-diaminohexane, 5% solution in 0.5 mol dm –3 sodium<br />
carbonate solution (1 cm 3 )<br />
glass rod or test-tube<br />
tweezers<br />
access to fume cupboard<br />
protective gloves<br />
cyclohexane<br />
decanedioyl dichloride<br />
1,6-diaminohexane<br />
FLAMMABLE<br />
CORROSIVE<br />
IRRITANT<br />
CARE Eye protection and<br />
gloves must be worn.<br />
WEAR EYE<br />
PROTECTION<br />
WEAR<br />
PROTECTIVE<br />
GLOVES<br />
What you do<br />
1 Pour about 1 cm 3 of the 1,6-diaminohexane solution (CARE Irritant) into a<br />
5cm 3 beaker.<br />
2 Carefully add an equal volume of the decanedioyl dichloride solution to the<br />
beaker. (CARE Decanedioyl dichloride has an irritating vapour. The vapour<br />
is a powerful lachrymator (eye irritant) and this effect is often delayed.<br />
Perform this part of the activity in a fume cupboard.)<br />
Two separate layers will form. Do not mix them.<br />
3 Use a pair of tweezers to remove the nylon film which forms where the two<br />
layers are in contact. Do this slowly and hook the nylon thread which forms<br />
onto a glass rod or a test-tube.<br />
Slowly wind the thread around the rod. As the nylon is removed more<br />
forms at the solution interface, so you should be able to keep on winding for<br />
some time.<br />
4 Once you have made some nylon it needs to be washed thoroughly with tap<br />
water. Take care not to touch the nylon because it forms as a hollow tube,<br />
and there will still be some chemicals trapped in the middle.<br />
QUESTIONS<br />
a Write out an equation to show the formation of nylon in this activity.<br />
b What is the name of the nylon you have made?<br />
162<br />
© Salters Advanced Chemistry 2000 – see Copyright restrictions
DP2.2<br />
Taking nylon apart<br />
In this experiment you are going to convert some<br />
nylon-6,6 polymer back into its original di-acid and<br />
di-amine. The linkages in the nylon are broken down<br />
by hydrolysis using sulphuric acid. This activity will<br />
allow you to improve your skill in carrying out an<br />
organic reaction safely. You will learn how to<br />
purify an organic solid and how to measure its<br />
melting point.<br />
Requirements<br />
● nylon-6,6 granules (2 g)<br />
●<br />
●<br />
100 cm 3 boiling flask<br />
condenser<br />
● sulphuric acid, 30% (35 cm 3 )<br />
● 250 cm 3 conical flasks (2)<br />
●<br />
●<br />
watch-glass<br />
thin-walled capillary tubes (or melting-point tubes)<br />
● melting-point apparatus for use up to 150 °C<br />
●<br />
apparatus for vacuum filtration<br />
● saturated sodium hydrogencarbonate solution (20 cm 3 )<br />
sodium hydroxide solution<br />
sulphuric acid<br />
CARE Eye protection must<br />
be worn throughout.<br />
CORROSIVE<br />
CORROSIVE<br />
WEAR EYE<br />
PROTECTION<br />
● sodium hydroxide solution, 2 mol dm –3 (5 cm 3 )<br />
●<br />
●<br />
●<br />
100 cm 3 measuring cylinder<br />
ice<br />
electric heating mantle<br />
● 250 cm 3 beakers (2)<br />
CARE Sulphuric acid of this<br />
concentration is very corrosive.<br />
●<br />
●<br />
10cm 3 measuring cylinder<br />
Universal Indicator paper<br />
Introduction<br />
If you did Activity DP2.1 you will have made a nylon from its monomers by<br />
condensation polymerisation. A reaction like this, in which a new substance is<br />
made from simpler substances, is called a synthesis.<br />
The reverse process, in which a large molecule is broken down into simpler<br />
molecules, is called a degradation. This type of reaction is often used by<br />
chemists to find out about the composition of substances. If they can identify<br />
the degradation products, they may be able to work out the structure of the<br />
original compound.<br />
The amide linkages in nylon can be hydrolysed (split by water) to give the<br />
parent di-acid and di-amine. The reaction with water is very slow indeed, but it can<br />
be speeded up by carrying out the hydrolysis in acid solution (acid hydrolysis).<br />
You will use moderately concentrated sulphuric acid (about 5.5 mol dm –3 ) for<br />
the hydrolysis.<br />
What you do<br />
Part 1: Breaking down the nylon<br />
1 Place 2 g of nylon-6,6 granules into a 100 cm 3 flask to which a reflux<br />
condenser can be attached.<br />
2 Pour 35 cm 3 of 30% sulphuric acid into the flask. (CARE Sulphuric acid of this<br />
concentration is very corrosive.) Fit the condenser to the flask (Figure 1).<br />
3 Place the reaction flask and condenser in the heating mantle. Heat the<br />
reaction mixture under reflux for about 3 hours. (This technique is used<br />
when you want to heat reactants for some time, but not lose either the<br />
reactants or the products by evaporation.) Add a few boiling chips to help<br />
the mixture boil smoothly.<br />
The nylon will all have dissolved after about 45 minutes, but you should<br />
carry on heating to complete the degradation.<br />
condenser<br />
water in<br />
nylon-6,6<br />
granules +<br />
sulphuric<br />
acid<br />
HEAT<br />
Figure 1 Breaking down the nylon<br />
water out<br />
„ Salters Advanced Chemistry 2000 – see Copyright restrictions<br />
163
DP2.2<br />
TAKING NYLON APART<br />
4 Allow the flask and contents to cool, then place them in an ice bath and<br />
leave them overnight for crystals to form.<br />
5 Collect the crystals by vacuum filtration. Keep the filtrate for use later.<br />
Part 2: Purifying the hexanedioic acid by<br />
recrystallisation<br />
Your solid now needs to be purified by recrystallisation.<br />
6 Place your hexanedioic acid crystals in a 250 cm 3 conical flask. Add 10 cm 3 of<br />
distilled water. Hold the neck of the flask with an insulating holder and<br />
gently heat the flask, swirling the contents at the same time. If some crystals<br />
remain when the water starts to boil, add a further 5 cm 3 of water and reheat.<br />
7 Carry on in this way until all the crystals have dissolved in the minimum<br />
quantity of water.<br />
8 If your solution is clear, you can loosely cover the opening to the flask and<br />
leave the solution to cool overnight.<br />
If the solution contains debris, this can be removed by carefully decanting<br />
most of the solution into a second flask, leaving the debris behind. You will<br />
need to reheat the solution to redissolve the crystals before covering it and<br />
leaving it to recrystallise.<br />
9 Collect the crystals by vacuum filtration and leave them to dry on a watchglass.<br />
To speed things up you can place the watch-glass in an oven or on a<br />
food-warming tray.<br />
Part 3: Finding a melting point<br />
Hexanedioic acid melts at 152 °C. Find the melting point of your crystals and<br />
compare it with this value.<br />
This is what you do to determine a melting point.<br />
10 Carefully heat one end of a small thin-walled capillary tube – a melting-point<br />
tube – so that the opening is just sealed. Leave the tube to cool.<br />
11 Grind a small quantity of your dry crystals in one corner of the watch-glass<br />
until you have a fine powder.<br />
Tap the open end of the melting-point tube into the fine powder so that a<br />
little powder packs into the tube. Invert the tube and tap it gently so that the<br />
powder falls to the closed end. Your teacher may show you an effective way<br />
of doing this. Do not try to put too much powder into the tube at once.<br />
12 Repeat the procedure until you have about 1 cm depth of powder in the tube.<br />
13 You may have an electrically-heated melting point apparatus which your<br />
teacher will show you how to use. Another way of determining melting<br />
points is described next.<br />
14 Fix the tube into position in the melting-point apparatus as shown in Figure 2.<br />
groove to allow<br />
air in and out of<br />
the apparatus<br />
thermometer<br />
melting-point tube<br />
rubber band<br />
suitable liquid<br />
HEAT<br />
Figure 2 Melting-point apparatus<br />
15 Slowly heat the side-arm of the apparatus with a very low Bunsen burner<br />
flame. The design of the apparatus should ensure a circulation of warm<br />
liquid around the sample and thermometer. Watch the sample carefully.<br />
When it melts, the powder will collapse into a sticky liquid. Record the<br />
temperature at which this happens.<br />
164<br />
„ Salters Advanced Chemistry 2000 – see Copyright restrictions
TAKING NYLON APART<br />
DP2.2<br />
16 This will be a rough value for the melting point because you were heating<br />
quite quickly. To determine an accurate melting point, allow the apparatus<br />
to cool down to about 10 °C below the value you have just recorded. Prepare<br />
another sample while this is happening. Then repeat the process with the<br />
fresh sample and a slower rate of heating.<br />
17 Record the accurately determined melting point of your hexanedioic acid.<br />
Part 4: Detecting the 1,6-diaminohexane produced<br />
The diamine is still in solution in the filtrate obtained in Part 1 because it has<br />
formed a soluble salt by reacting with the sulphuric acid.<br />
18 Take 5 cm 3 of the filtrate and carefully pour it into 20 cm 3 of saturated<br />
sodium hydrogencarbonate solution in a 250 cm 3 beaker. (CARE Do not add<br />
the filtrate all in one go or the mixture will fizz dangerously.)<br />
Use pH paper to make sure that the mixture is no longer acidic. If necessary<br />
add some more sodium hydrogencarbonate solution to achieve this.<br />
19 Then add 5 cm 3 of 2 mol dm –3 sodium hydroxide solution to make the<br />
solution alkaline. (CARE Sodium hydroxide solution is corrosive.)<br />
Cautiously swirl the contents of the beaker and note the smell of the<br />
solution which contains 1,6-diaminohexane. (For comparison, the trivial<br />
names of 1,4-diaminobutane and 1,5-diaminopentane are putrescine and<br />
cadavarine respectively, both of which are associated with the putrefaction of<br />
proteins in flesh.)<br />
QUESTIONS<br />
a What property of hexanedioic acid is made use of in the<br />
recrystallisation process?<br />
b Melting points are often used to identify compounds. They are also<br />
a good indication of the purity of a compound. Was your sample of<br />
hexanedioic acid pure? Explain your answer.<br />
c Write an equation for the hydrolysis of a short section of nylon-6,6<br />
to produce hexanedioic acid and 1,6-diaminohexane.<br />
„ Salters Advanced Chemistry 2000 – see Copyright restrictions<br />
165
DP4<br />
Comparing models of<br />
nylon-6,6 and Kevlar<br />
One thing you will achieve from studying this unit is<br />
an understanding of how the properties of polymers<br />
relate to their structures. In this activity you can<br />
examine this relationship for nylon and Kevlar.<br />
Requirements<br />
●<br />
molecular model kit<br />
Building the model<br />
The structures of the polymers nylon-6,6 and Kevlar are:<br />
NH (CH 2 ) 6 NHCO (CH 2 ) 4 CO<br />
n<br />
nylon-6,6<br />
NH NHCO CO<br />
n<br />
Kevlar<br />
Use your model kit to make the structures that represent the repeating units for<br />
these polymers. Then join your nylon model together with those from other<br />
students’ kits to make a long-chain model of the polymer. Do the same for the<br />
Kevlar structure. Use your models to help you work through the questions<br />
which follow.<br />
QUESTIONS<br />
a How do the models of the polymer chains behave when stretched?<br />
Which polymer will be more elastic?<br />
b Use the models to explain the following data, which were obtained<br />
in experiments to test the strengths of the two polymers:<br />
Elongation at fracture<br />
nylon-6,6 18%<br />
Kevlar 3%<br />
c The bond lengths in Kevlar and nylon-6,6 can be estimated from<br />
comparable functional groups in other organic molecules:<br />
Bond length/nm<br />
nylon-6,6 Kevlar<br />
N–C (in CONH group) 0.132 0.132<br />
N–C (attached to a hydrocarbon group) 0.147 0.135<br />
C–C (in a hydrocarbon group) 0.154 0.139<br />
C–C (attached to CONH group) 0.150 0.148<br />
There is usually a good correlation in chemistry between bond<br />
length and bond strength: shorter bonds are stronger, longer bonds<br />
are weaker.<br />
i Draw the structures of nylon-6,6 and Kevlar, and mark on each of<br />
them the bond lengths from the table.<br />
ii Use the bond lengths to explain why Kevlar is more stable than<br />
nylon-6,6 when heated.<br />
166<br />
„ Salters Advanced Chemistry 2000 – see Copyright restrictions
DP5<br />
Bubble gum – or bubble<br />
glass?<br />
The polymer in bubble gum can be elastic or glassy,<br />
depending on temperature. You can study both forms<br />
with the help of a domestic freezer.<br />
Requirements<br />
●<br />
●<br />
bubble gum (eg Hubba Bubba)<br />
freezer<br />
CARE Do this experiment at home, not at school.<br />
CARE Do not handle other people’s bubble gum.<br />
What you do<br />
1 Chew a piece of bubble gum until all the taste has gone.<br />
2 Gently pull the gum and then release it.<br />
a<br />
Does it show any elastic properties?<br />
3 Pull it so that it stretches to about eight times its original length.<br />
b<br />
Does it still show elastic properties? Does it completely return to its<br />
original length? What term is used to describe this irreversible<br />
change?<br />
4 Now shape your piece of bubble gum so it’s about the same size as a 5p coin.<br />
Wrap it in some plastic film and place it in the coldest part of your freezer for<br />
about 15 minutes.<br />
When you remove the gum from the freezer, quickly bend it.<br />
c<br />
What happens? Can you explain the result? What happens as it<br />
returns to room temperature?<br />
„ Salters Advanced Chemistry 2000 – see Copyright restrictions<br />
167
DP8<br />
Check your notes on<br />
Designer Polymers<br />
This activity helps you get your notes in order at the<br />
end of this unit.<br />
Use this list as the basis of a summary of the unit by<br />
collecting together the related points and arranging them in<br />
groups. You may also wish to check how this unit has further<br />
developed ideas first met in The Polymer Revolution. You<br />
may want to link the summaries of parts of The Polymer<br />
Revolution to the summaries you prepare for this unit.<br />
Most of the points are covered in the Chemical Ideas,<br />
with supporting information in the Storyline or Activities.<br />
However, if the main source of information is the Storyline<br />
or an Activity, this is indicated.<br />
●<br />
●<br />
●<br />
●<br />
●<br />
●<br />
The historical development of condensation polymers<br />
(polyamides and polyesters) (Storyline DP2 and DP3).<br />
How to distinguish between addition and condensation<br />
polymerisation.<br />
Predicting the structural formula of the condensation<br />
polymer formed from given monomer(s) and vice versa.<br />
The hydrolysis of esters.<br />
Be able to recognise members of the following<br />
homologous series: amines and amides.<br />
The use of systematic nomenclature to name primary<br />
amines.<br />
●<br />
●<br />
●<br />
●<br />
●<br />
●<br />
●<br />
●<br />
●<br />
●<br />
The characteristic properties of the amino group,<br />
including: basic nature and acylation.<br />
The reaction between a primary amine and an acyl<br />
chloride to produce an amide.<br />
The hydrolysis of an amide (Activity DP2.2).<br />
The procedure for purifying an organic solid product<br />
(Activity DP2.2).<br />
The properties of condensation polymers in terms of<br />
intermolecular attractions.<br />
The effect of temperature changes on polymers.<br />
The relationship between the properties of polymers and<br />
their molecular structure.<br />
The ways that chemists can modify the properties of a<br />
polymer by physical and chemical means (including the<br />
use of co-polymers), to meet particular needs.<br />
The use of given data to design a polymer for a particular<br />
purpose.<br />
The disposal and recycling of polymers (Storyline DP7).<br />
DP<br />
© Harcourt Education Ltd 2004 Salters Advanced Chemistry<br />
These pages have been downloaded from www.heinemann.co.uk/science<br />
3
EP2.1<br />
Investigating amines and<br />
amino acids<br />
In this activity you will compare the properties of<br />
amines and amino acids, using butylamine as an<br />
example of an amine and glycine as an example of an<br />
amino acid.<br />
Requirements<br />
● Universal Indicator paper<br />
● test-tubes (8) and rack<br />
● butylamine (2 cm 3 )<br />
● glycine (aminoethanoic acid) (2 g)<br />
● concentrated hydrochloric acid (a few drops)<br />
● sodium hydroxide solution, 2 mol dm –3 (10 cm 3 )<br />
● hydrochloric acid, 0.01 mol dm –3 (1 cm 3 )<br />
● sodium hydroxide solution, 0.01 mol dm –3 (2 cm 3 )<br />
● copper(II) sulphate solution, 0.1 mol dm –3 (2 cm 3 )<br />
● ethanoyl chloride (2 cm 3 )<br />
butylamine<br />
IRRITANT<br />
HIGHLY<br />
FLAMMABLE<br />
ethanoyl chloride<br />
CORROSIVE<br />
HIGHLY<br />
FLAMMABLE<br />
hydrochloric acid<br />
CORROSIVE<br />
sodium hydroxide solution<br />
CORROSIVE<br />
CARE Butylamine and ethanoyl chloride are volatile and<br />
have unpleasant, highly flammable vapours. Use the<br />
bottles in a fume cupboard and avoid inhaling the vapours.<br />
CARE Eye protection<br />
must be worn.<br />
WEAR EYE<br />
PROTECTION<br />
What you do<br />
Carry out the tests in Part 1 on butylamine, an example of an amine. Then carry<br />
out a similar series of tests in Part 2 on glycine, an example of an amino acid.<br />
Before you start, read through the tests and draw up a suitable table in which to<br />
record your observations. Your table should allow you to compare the behaviour<br />
of the two compounds.<br />
Part 1: Reactions of an amine<br />
1 Solubility Add a few drops of butylamine (CARE Highly flammable; irritant<br />
vapour) to 1 cm depth of water in a test-tube.<br />
a Is butylamine soluble in water? Explain any solubility in terms of<br />
interactions between the particles concerned.<br />
b Record the pH of any solution which has been formed. Write an<br />
equation to explain any change to the pH of the water.<br />
2 Adding acid and alkali Add a few drops of concentrated hydrochloric acid<br />
(CARE Corrosive) to the butylamine solution from test 1. Make a note of<br />
any changes, including smell, before and after addition of the acid (CARE<br />
Take very great care when smelling the vapours. Just gently waft your hand<br />
over the mouth of the test-tube towards your nose. Keep your head well<br />
away from the tube. Do this experiment very cautiously.). Then add about<br />
2 cm depth of 2 mol dm –3 sodium hydroxide solution (CARE Corrosive) and<br />
shake the tube gently; again, note any changes.<br />
c<br />
Write equation(s) for any changes you have noted.<br />
3 Reaction with copper(II) sulphate Add a few drops of butylamine to<br />
1 cm depth of copper(II) sulphate solution in a test-tube. Make a note of any<br />
changes which occur.<br />
„ Salters Advanced Chemistry 2000 – see Copyright restrictions<br />
171
EP2.1<br />
INVESTIGATING AMINES AND AMINO ACIDS<br />
d<br />
Write down the formula of any new copper-containing particles which<br />
may have been formed.<br />
4 Adding ethanoyl chloride Place 10 drops of butylamine in a dry test-tube.<br />
Add 10 drops, one drop at a time, of ethanoyl chloride (CARE Highly<br />
flammable and corrosive. Can react violently).<br />
e<br />
Make a note of the results, and write an equation for any reaction<br />
which occurs.<br />
Add 1 cm depth of water to the tube and carefully stir the mixture. Then add<br />
3 cm depth of 2 mol dm –3 sodium hydroxide solution. Warm the mixture, and<br />
hold a piece of moistened pH paper at the mouth of the test-tube.<br />
f<br />
Explain any change to the pH paper in terms of the process occurring<br />
in the test-tube.<br />
Part 2: Reactions of an amino acid<br />
5 Solubility Add a few crystals of glycine to 1 cm depth of water in a testtube.<br />
g<br />
h<br />
Is glycine soluble in water? Explain any solubility in terms of<br />
interactions between the particles concerned.<br />
Record the pH of any solution which has been formed.<br />
6 Adding acid and alkali Add 1 cm depth of 0.01 mol dm –3 hydrochloric<br />
acid, in two separate 0.5 cm depth portions, to the glycine solution from<br />
test 5. Then add 2 cm depth of 0.01 mol dm –3 sodium hydroxide in four<br />
separate 0.5 cm depth portions. Record the pH after each addition.<br />
i<br />
Use your knowledge of the acid-base properties of an amino acid like<br />
glycine to explain how the pH of the solution behaves during the<br />
addition of acid or alkali.<br />
7 Reaction with copper(II) sulphate Add a few crystals of glycine to 1 cm<br />
depth of copper(II) sulphate solution in a test-tube. Make a note of any<br />
changes which occur.<br />
j<br />
Compare the behaviour of butylamine and glycine with copper(II)<br />
sulphate solution.<br />
8 Adding ethanoyl chloride Place a few crystals of glycine into a dry testtube,<br />
and repeat the procedure in test 4.<br />
k<br />
Compare the behaviour of butylamine and glycine with ethanoyl<br />
chloride.<br />
Comparison<br />
l<br />
Make a note of the similarities between the reactions of butylamine<br />
(an amine) and glycine (an amino acid).<br />
m Explain any differences in the chemical properties of the two types of<br />
compound.<br />
n<br />
Suggest why butylamine is a low-boiling liquid but glycine is a highmelting<br />
crystalline solid.<br />
172<br />
„ Salters Advanced Chemistry 2000 – see Copyright restrictions
EP2.2<br />
What’s in aspartame?<br />
Is this activity you will apply your skills at<br />
chromatography to help you investigate the conditions<br />
needed for the hydrolysis of peptide bonds. You will be<br />
looking at a simple example: aspartame, a dipeptide<br />
used as an artificial sweetener. You will be<br />
investigating what concentration of acid, and what<br />
reflux time, are needed to hydrolyse the dipeptide.<br />
Requirements<br />
● aspartame, eg Searle ‘Canderel’ tablets (1–3 tablets)<br />
● hydrochloric acid: various concentrations, eg 4 mol dm –3 ,<br />
2 mol dm –3 , 1 mol dm –3 (25 cm 3 each)<br />
● 10 cm 3 measuring cylinder<br />
● apparatus for heating under reflux, eg 50 cm 3 pear-shaped<br />
flask and water condenser<br />
● anti-bumping granules<br />
● apparatus for paper chromatography<br />
● 250 cm 3 beaker<br />
● butan-1-ol (20 cm 3 )<br />
● glacial ethanoic acid (4 cm 3 )<br />
● separating funnel<br />
● aspartic acid solution,<br />
0.01 mol dm –3 small amounts<br />
● phenylalanine solution, for chromatography<br />
0.01 mol dm –3<br />
● ninhydrin in butan-1-ol, 0.5% solution in spray bottle<br />
● mortar and pestle<br />
● hair dryer<br />
● protective gloves<br />
Ï<br />
Ì<br />
Ó<br />
butan-1-ol<br />
ethanoic acid<br />
hydrochloric acid<br />
ninhydrin solution<br />
CARE Eye protection<br />
must be worn.<br />
CARE Ninhydrin solution<br />
must be used in a fume<br />
cupboard. Gloves must be<br />
worn. Wash the solution off<br />
with lots of soap and water<br />
if it contacts your skin.<br />
HARMFUL<br />
CORROSIVE<br />
CORROSIVE<br />
HARMFUL<br />
WEAR EYE<br />
PROTECTION<br />
WEAR<br />
PROTECTIVE<br />
GLOVES<br />
FLAMMABLE<br />
FLAMMABLE<br />
Introduction<br />
Peptide bonds in proteins can be hydrolysed by refluxing with hydrochloric acid.<br />
You will use the artificial sweetener aspartame as a substitute for a protein in this<br />
activity. Aspartame is the methyl ester of the dipeptide Asp Phe. The ester link in<br />
aspartame will also be hydrolysed under these conditions, so you will get<br />
aspartic acid and phenylalanine just as you would from the dipeptide itself.<br />
The skeletal formula for aspartame is shown below.<br />
O<br />
HO<br />
H 2 N<br />
N<br />
H<br />
O<br />
OCH 3<br />
O<br />
aspartame<br />
aspartame<br />
„ Salters Advanced Chemistry 2000 – see Copyright restrictions<br />
173
EP2.2<br />
WHAT’S IN ASPARTAME?<br />
What you do<br />
You are to investigate what concentration of acid and what reflux time are<br />
sufficient to hydrolyse the aspartame in one tablet.<br />
You can use your skill at chromatography to analyse your reaction products<br />
to find out whether the free amino acids are present in reasonable quantities.<br />
(Some tablets contain phenylalanine with the aspartame so you must detect both<br />
phenylalanine and aspartic acid to be sure hydrolysis has occurred.)<br />
The chromatography solvent can be made by shaking together butan-1-ol<br />
(CARE Harmful and flammable), glacial ethanoic acid (CARE Corrosive; avoid<br />
inhaling the vapour) and water in the ratio 5:1:4 by volume in a separating<br />
funnel. When the mixture settles, two layers will form. Use the upper, nonaqueous<br />
layer as your solvent.<br />
Amino acids can be detected by spraying the paper with ninhydrin solution<br />
(CARE Harmful, flammable; observe the safety warnings above) and then<br />
warming the paper, for example using a hair dryer. Do not use a flame. The<br />
spots may be slow to develop. Circle them with pencil when they appear, as they<br />
will fade.<br />
QUESTION<br />
Write an equation for the hydrolysis of aspartame, showing the<br />
skeletal formulae of the three products formed.<br />
174<br />
„ Salters Advanced Chemistry 2000 – see Copyright restrictions
EP2.3<br />
Using nuclear magnetic<br />
resonance (n.m.r.)<br />
spectroscopy for structure<br />
determination<br />
In this activity you will have practice in analysing<br />
n.m.r. spectra of organic compounds.<br />
Introduction<br />
In Part 1 of this activity you will analyse the n.m.r spectra of a range of simple<br />
organic compounds. In Part 2, the n.m.r spectra of three different nitrogencontaining<br />
compounds, one of which is the analgesic paracetamol, will be<br />
considered. You will then be asked to make predictions about the infrared<br />
spectrum of paracetamol.<br />
The typical resonance positions for various hydrogen atoms, expressed as<br />
chemical shifts, are given in the Data Sheets (Table 23). Some of the compounds<br />
in this activity contain hydrogen atoms attatched to oxygen and nitrogen atoms.<br />
The chemical shifts for both N–H and O–H can be variable, the value depending<br />
on several factors. They are usually broad peaks.<br />
The shape of the signal given by any particular hydrogen atom is related to the<br />
number of neighbouring hydrogen atoms on adjacent carbons, as summarised in<br />
Table 1. This rule does not always apply to hydrogen atoms on oxygen or nitrogen.<br />
Number of<br />
H atoms on<br />
adjacent Shape of signal<br />
C atoms<br />
0 single peak – singlet<br />
1 two close peaks – doublet<br />
2 three close peaks – triplet<br />
3 four close peaks – quartet<br />
Table 1 Shape of n.m.r. signal in relation to the<br />
number of neighbouring hydrogen atoms on<br />
adjacent carbon atoms. These splittings are only<br />
seen clearly in high resolution spectra.<br />
What you do<br />
Part 1: N.m.r. spectra of simple organic compounds<br />
a<br />
Figures 1, 2 and 3 show the 1 H (proton) n.m.r. spectra of ethanol,<br />
ethanal and ethanoic acid respectively.<br />
i Draw the full structural formula of each of these molecules.<br />
ii Identify the hydrogen atoms responsible for each of the signals in<br />
the spectra.<br />
Absorption<br />
2H<br />
1H<br />
3H<br />
TMS<br />
Figure 1 The n.m.r. spectrum<br />
of ethanol<br />
10<br />
9<br />
8<br />
7<br />
6 5 4<br />
Chemical shift<br />
3<br />
2<br />
1<br />
0<br />
Absorption<br />
1H<br />
3H<br />
TMS<br />
Figure 2 The n.m.r. spectrum<br />
of ethanal<br />
10<br />
9<br />
8<br />
7<br />
6 5 4<br />
Chemical shift<br />
3<br />
2<br />
1<br />
0<br />
Absorption<br />
1H<br />
3H<br />
TMS<br />
Figure 3 The n.m.r. spectrum<br />
of ethanoic acid<br />
12<br />
11<br />
10<br />
9<br />
8<br />
7<br />
6 5<br />
Chemical shift<br />
4<br />
3<br />
2<br />
1<br />
0<br />
„ Salters Advanced Chemistry 2000 – see Copyright restrictions<br />
175
EP2.3<br />
USING NUCLEAR MAGNETIC RESONANCE (n.m.r.) SPECTROSCOPY FOR STRUCTURE DETERMINATION<br />
b<br />
Figures 4–7 show the n.m.r. spectra of propan-1-ol, propanal,<br />
propanone and propanoic acid, but not necessarily in this order.<br />
i Draw the full structural formula of each of these molecules.<br />
ii Identify, with reasons, which of the spectra, labelled A, B, C, D<br />
in Figures 4–7, corresponds to each of the structures you have<br />
drawn.<br />
3H<br />
Figure 4 The n.m.r.<br />
spectrum A<br />
Absorption<br />
1H<br />
2H<br />
TMS<br />
10<br />
9<br />
8<br />
7<br />
6 5 4<br />
Chemical shift<br />
3<br />
2<br />
1<br />
0<br />
1H<br />
3H<br />
Figure 5 The n.m.r.<br />
spectrum B<br />
Absorption<br />
2H<br />
TMS<br />
13<br />
12<br />
11<br />
10<br />
9<br />
8<br />
7 6<br />
Chemical shift<br />
5<br />
4<br />
3<br />
2<br />
1<br />
0<br />
Absorption<br />
TMS<br />
Figure 6 The n.m.r.<br />
spectrum C<br />
10<br />
9<br />
8<br />
7<br />
6 5 4<br />
Chemical shift<br />
3<br />
2<br />
1<br />
0<br />
Absorption<br />
2H<br />
3H<br />
TMS<br />
Figure 7 The n.m.r.<br />
spectrum D<br />
2H<br />
1H<br />
10<br />
9<br />
8<br />
7<br />
6 5 4<br />
Chemical shift<br />
3<br />
2<br />
1<br />
0<br />
176<br />
„ Salters Advanced Chemistry 2000 – see Copyright restrictions
USING NUCLEAR MAGNETIC RESONANCE (n.m.r.) SPECTROSCOPY FOR STRUCTURE DETERMINATION<br />
EP2.3<br />
c<br />
Figures 8, 9 and 10 show the n.m.r. spectra of aminoethane,<br />
1-aminopropane and propanamide respectively.<br />
i Draw the full structural formula of each of these molecules.<br />
ii Identify the hydrogen atoms responsible for each of the signals in the<br />
n.m.r. spectra and, where possible, comment on the shape of these<br />
signals.<br />
3H<br />
Figure 8 The n.m.r. spectrum of aminoethane<br />
Absorption<br />
2H<br />
2H<br />
TMS<br />
10<br />
9<br />
8<br />
7<br />
6<br />
5<br />
4<br />
3<br />
2<br />
1<br />
0<br />
Chemical shift<br />
3H<br />
Figure 9 The n.m.r. spectrum of 1-aminopropane<br />
Absorption<br />
2H<br />
2H<br />
2H<br />
TMS<br />
10<br />
9<br />
8<br />
7<br />
6<br />
5<br />
4<br />
3<br />
2<br />
1<br />
0<br />
Chemical shift<br />
3H<br />
Figure 10 The n.m.r. spectrum of propanamide<br />
Absorption<br />
2H<br />
TMS<br />
2H<br />
10<br />
9<br />
8<br />
7<br />
6<br />
5<br />
4<br />
3<br />
2<br />
1<br />
0<br />
Chemical shift<br />
„ Salters Advanced Chemistry 2000 – see Copyright restrictions<br />
177
EP2.3<br />
USING NUCLEAR MAGNETIC RESONANCE (n.m.r.) SPECTROSCOPY FOR STRUCTURE DETERMINATION<br />
Part 2: N.m.r. spectra of other nitrogen-containing<br />
compounds<br />
d<br />
Use the information provided in the Data Sheets, together with your<br />
knowledge of n.m.r. spectra in Part 1 to match the following<br />
structures 1–3 with the n.m.r. spectra E–G in Figures 11–13.<br />
CH 3 CH 2 O NH 2<br />
1<br />
O<br />
HO NH C CH 3<br />
2<br />
HO<br />
O<br />
NH C CH 3<br />
3<br />
3H<br />
Figure 11 The n.m.r. spectrum E<br />
Absorption<br />
1H<br />
1H<br />
2H 2H<br />
TMS<br />
10<br />
9<br />
8<br />
7<br />
6 5 4<br />
Chemical shift<br />
3<br />
2<br />
1<br />
0<br />
3H<br />
Figure 12 The n.m.r. spectrum F<br />
Absorption<br />
2H<br />
2H<br />
2H<br />
2H<br />
TMS<br />
10<br />
9<br />
8<br />
7<br />
6 5 4<br />
Chemical shift<br />
3<br />
2<br />
1<br />
0<br />
3H<br />
Figure 13 The n.m.r. spectrum G<br />
Absorption<br />
1H<br />
1H<br />
1H<br />
1H<br />
1H<br />
1H<br />
TMS<br />
10<br />
9<br />
8<br />
7<br />
6 5 4<br />
Chemical shift<br />
3<br />
2<br />
1<br />
0<br />
e<br />
For the analgesic paracetamol, structure 2, use the information in the<br />
Data Sheets to predict the main features of its i.r. spectrum.<br />
178<br />
„ Salters Advanced Chemistry 2000 – see Copyright restrictions
EP2.4<br />
The shapes of a-amino<br />
acids<br />
This activity reinforces your reading of Chemical<br />
Ideas 3.3 and 3.6 on the shapes of molecules and<br />
optical isomerism.<br />
Requirements<br />
●<br />
●<br />
molecular model kit<br />
molecular modelling software (optional)<br />
What you do<br />
1 Draw a full structural formula for glycine. Mark on it the values you would<br />
expect for the bond angles.<br />
2 Draw full structural formulae for the following amino acid –R groups,<br />
showing clearly any lone pairs. Mark on each structure the values you would<br />
expect for the bond angles.<br />
a valine b serine c methionine d aspartic acid.<br />
3 Build models of the structures in steps 1 and 2. Check that the bond angles<br />
you predicted were correct, and see how the representations of the structures<br />
on flat pieces of paper compare with their three-dimensional shapes.<br />
4 Build a simplified model of a general a-amino acid by using:<br />
● a hydrogen atom for hydrogen<br />
● a carbon atom for the –R group<br />
● an oxygen atom for the –COOH group<br />
● a nitrogen atom for the –NH 2<br />
group.<br />
You now have a central carbon atom surrounded by four different groups.<br />
Each group (–H, –R, –COOH and –NH 2<br />
) is represented by a different<br />
coloured atom. (This removes some of the ‘clutter’ of bulky groups so that<br />
you can see the arrangement round the central carbon atom clearly.)<br />
Build a second model which is the mirror image of the model you have<br />
just built. Confirm to yourself that the two structures represent<br />
enantiomers (optical isomers).<br />
5 Stand your two models from step 4 so that the H atoms point upwards. Look<br />
down each one from the H atom towards the central carbon atom. One<br />
enantiomer will have the sequence<br />
COOH, R, NH 2<br />
(CORN)<br />
in a clockwise direction. This is the L-amino acid, the configuration that<br />
occurs in proteins. The other structure corresponds to the D-amino acid;<br />
D-amino acids occur in some bacterial peptides.<br />
COOH<br />
COOH<br />
H<br />
H<br />
C<br />
C<br />
H 2 N<br />
R<br />
R<br />
NH 2<br />
CORN<br />
L-isomer<br />
CORN<br />
D-isomer<br />
Figure 1 Looking down the H–C bond from hydrogen towards the central carbon<br />
atom<br />
6 Replace the –R groups of your amino acid structures with H atoms, so that<br />
you have two models of glycine. Confirm that optical isomerism is no longer<br />
possible without four different groups around the central atom.<br />
„ Salters Advanced Chemistry 2000 – see Copyright restrictions<br />
179
EP2.5<br />
A testing smell<br />
This activity makes use of a naturally occurring pair<br />
of enantiomers to illustrate how optical isomers can<br />
have different properties.<br />
Requirements<br />
●<br />
spearmint chewing gum (a half of a piece)<br />
● caraway seeds, crushed (about 20)<br />
●<br />
●<br />
test-tubes wrapped in foil or paper to obscure their contents<br />
stoppers or clingfilm<br />
What you do<br />
1 Label the test-tubes and their stoppers X, Y and Z. Place about a quarter of a<br />
piece of chewing gum into one of the tubes, and about 10 caraway seeds into<br />
another. Make sure you keep a record of which material goes into which tube.<br />
2 Then place either another piece of chewing gum or another 10 caraway<br />
seeds into the third tube. Seal all three tubes with the correct stoppers.<br />
3 Get other members of your group to close their eyes and smell the contents<br />
of each tube in turn, telling you which tubes smell the same and which is<br />
different.<br />
What it means<br />
The principal smell of chewing gum is due to L-carvone which smells of<br />
spearmint. Caraway seeds smell of the enantiomer, D-carvone. It is claimed that<br />
about 20% of people cannot distinguish between these two smells.<br />
C<br />
CH<br />
CH 2<br />
CH 2<br />
CH<br />
C<br />
CH 3<br />
CH 3<br />
O<br />
C<br />
CH 2<br />
C<br />
H<br />
H<br />
C<br />
C CH 3 CH 3 C CH 2<br />
CH 2 CH 2<br />
C<br />
O<br />
L-carvone<br />
D-carvone<br />
QUESTIONS<br />
a Which two functional groups are present in carvone?<br />
b i Draw skeletal formulae for D- and L-carvone.<br />
ii On your skeletal formulae, use an asterisk (*) to denote the chiral<br />
carbon atom.<br />
c i What is the molecular formula of carvone?<br />
ii Write down the molecular formula of the product of the reaction<br />
of D-carvone with bromine molecules, Br 2<br />
(l).<br />
iii Would you expect L-carvone to react in the same way with<br />
bromine? Explain your answer.<br />
iv Draw a skeletal formula for the product of the reaction in cii.<br />
v How many chiral carbon atoms are there in the structure in civ?<br />
Mark each one with an asterisk.<br />
d D- and L-carvone are different in the way they smell to the majority<br />
of people. Suggest a reason why the enantiomers produce different<br />
responses from the smell receptors in the body.<br />
e Work out the percentage of people in your class survey who fail to<br />
detect a difference between the two forms of carvone. How does<br />
your result compare with the figure of 20% quoted earlier in this<br />
activity? Comment on the fairness of the comparison.<br />
180<br />
„ Salters Advanced Chemistry 2000 – see Copyright restrictions
EP2.6<br />
Taking note of proteins<br />
This activity will help you summarise the information<br />
in the first part of Storyline EP2.<br />
Making a summary<br />
Very early in this course, in the unit The Elements of Life, you probably<br />
carried out an activity – ‘Making the most of your study of chemistry’ (Activity<br />
EL2.2) – about recording information. This introduced the idea of writing<br />
‘branched notes’.<br />
Below is the basis of some branched notes on amino acids and proteins. Each<br />
of the points needs to be branched out further with more information. Add the<br />
branches you think are necessary, and so build up a summary of the work you<br />
have done so far in Storyline EP2.<br />
proteins in<br />
our foods<br />
proteins in<br />
our bodies<br />
amino acids<br />
condensation<br />
abbreviations<br />
structures<br />
representing<br />
sequences<br />
optical<br />
isomerism<br />
bond angles<br />
„ Salters Advanced Chemistry 2000 – see Copyright restrictions<br />
181
EP2.7<br />
Modelling DNA<br />
The double-helix arrangement of DNA can be<br />
explained in terms of intermolecular forces. This<br />
activity helps you work out these explanations, and<br />
become more familiar with the DNA structure.<br />
Requirements<br />
●<br />
molecular model kit<br />
● plastic-coated wire, e.g. RS30 ¥ 0.25 mm strand (1 m)<br />
● plastic pegs, eg Cochrane’s ‘Minit’ peg, type a (30)<br />
● plastic straws to fit pegs, 10 cm (15)<br />
●<br />
RASMOL molecular visualisation application and files of nucleic acid<br />
structures (optional)<br />
Base pairing<br />
1 Refer to Storyline EP2 and use a molecular model kit to build models of<br />
the structures of the four bases in DNA. Leave spare bonds to indicate the<br />
connections to the sugar–phosphate ‘backbone’.<br />
2 Try different combinations of pairs of bases to investigate which molecules<br />
form strong hydrogen bonds with one another. Remember:<br />
● the bonds to the sugar–phosphate ‘backbone’ must be at opposite sides of<br />
the bases<br />
● the hydrogen bonds should be about 50% longer than the covalent bonds<br />
● the bases interact in a flat arrangement.<br />
3 Draw diagrams for the structures of the base pairs which fit well together.<br />
The double helix<br />
4 Use the plastic-coated wire, plastic straws and pegs supplied to make a<br />
ladder like the one shown in Figure 1. Use about 15 pegs on each side.<br />
a What feature of DNA is represented by:<br />
i the plastic-coated wire?<br />
ii the straws?<br />
5 Twist your model to form a double helix with ten straws to a turn – that is<br />
the eleventh straw should lie directly over the first straw. This represents the<br />
extent to which DNA is twisted.<br />
6 Compare your model with the space-filling representation of DNA shown in<br />
Figure 2.<br />
7 You might take the opportunity to investigate the DNA structure further by<br />
using a molecular visualisation package (eg RASMOL).<br />
b<br />
c<br />
d<br />
e<br />
What do you notice about the region in the centre of the double helix<br />
– the region occupied by the bases? (These are shown as unshaded<br />
atoms in the figure.)<br />
Explain why the DNA double helix could not be twisted more tightly<br />
than it is.<br />
As you have seen, hydrogen bonding is responsible for the<br />
interactions between the bases in a direction across the axis of the<br />
double helix – in other words, horizontally in Figure 2. Explain what<br />
type of intermolecular bonding is responsible for the interactions<br />
between the bases along the axis of the double helix – in other words,<br />
vertically in Figure 2.<br />
Your answer to d should help you to understand why the DNA double<br />
helix is twisted to the extent shown by your model. Explain why a<br />
less tightly twisted DNA double helix would be unlikely to form.<br />
Figure 1 Building a double helix<br />
182<br />
„ Salters Advanced Chemistry 2000 – see Copyright restrictions<br />
Figure 2 Space-filling model of DNA
EP2.8<br />
Life reveals its twisted<br />
secret<br />
This activity will give you practice at composing a<br />
piece of scientific writing from a range of source<br />
materials.<br />
What you do<br />
Imagine that it is 1953. Francis Crick and James Watson have just announced a<br />
momentous discovery about the structure of DNA. You have been<br />
commissioned to write an article of 400–500 words for a science magazine. Your<br />
article should review the various structures which have been proposed for DNA,<br />
and explain why the Crick-Watson structure seems most appropriate.<br />
To help you, you have collected together some clippings from books and<br />
magazines, and some brief details about the principal research scientists in the<br />
field. You may include illustrations in your article. Remember – your audience<br />
will have some understanding of science, though they will not be experts in this<br />
particular field.<br />
When you have finished, write a short abstract (no more than 50 words)<br />
which summarises the main points of your article.<br />
Setting the scene<br />
By the early 1950s, protein structure had been well worked out. Several groups<br />
were turning their attention to DNA, the one remaining cell polymer with an<br />
unknown structure.<br />
The following people were foremost among those involved.<br />
Maurice Wilkins<br />
He was a respected physicist working at<br />
King’s College, London. He had decided<br />
to tackle the DNA structure using X-ray<br />
diffraction as his research technique. At a<br />
conference in Naples in Spring 1951 he<br />
showed a slide of the X-ray diffraction<br />
pattern of DNA which, in spite of<br />
Wilkins’ dry delivery, excited James<br />
Watson to the possibilities of X-ray study<br />
of the molecule.<br />
Rosalind Franklin<br />
She was a young, brilliant X-ray<br />
crystallographer, and an ardent feminist,<br />
who also worked at King’s College,<br />
London. Called in by Wilkins to assist<br />
with his DNA work, she soon became an<br />
equal partner in the research.<br />
Linus Pauling<br />
He was a very successful and established<br />
chemist working at the California<br />
Institute of Science and Technology (Cal<br />
Tech). He had recently discovered (with<br />
Robert Corey) the a-helical structure for<br />
proteins. This he revealed in a lecture<br />
with a distinct ‘show business’ flair,<br />
proudly unveiling his model with a<br />
flourish near the end of the lecture.<br />
James Watson<br />
A young fun-loving American biologist<br />
who came to Cambridge in 1951 to<br />
pursue his hunch that X-ray diffraction<br />
was the clue to understanding the<br />
structure of macromolecules. He joined<br />
the Cavendish laboratory in a group<br />
working on protein structure, but his<br />
thoughts were always turning to DNA.<br />
Francis Crick<br />
A maverick English physicist who had<br />
worked on magnetic mines in the Second<br />
World War. He was supposed to be<br />
researching for a PhD in the Cavendish<br />
group which Watson joined. In practice,<br />
though, he was constantly picking up and<br />
attempting to improve the ideas of<br />
others, and he too had his sights set on<br />
the DNA structure.<br />
„ Salters Advanced Chemistry 2000 – see Copyright restrictions<br />
183
EP2.8<br />
LIFE REVEALS ITS TWISTED SECRET<br />
The clippings<br />
Rosalind Franklin’s early ideas about DNA (November<br />
1951)<br />
The general characteristics of the diagram suggest that the DNA chains are<br />
in a helical form.<br />
… The results suggest a helical structure (which must be very closely<br />
packed) containing probably 2, 3 or 4 co-axial nucleic acid chains per<br />
helical unit, and having the phosphate groups near the outside.<br />
Crick and Watson’s 3-chain model (1951/1952)<br />
Decisions had to be made about the number of polynucleotide chains<br />
within the DNA molecule. Superficially, the X-ray data were compatible<br />
with two, three, or four strands. It was all a question of the angle and radii<br />
at which the DNA strands twisted about the central axis.<br />
… we had decided upon models in which the sugar-phosphate<br />
backbone was in the center of the molecule.<br />
… we looked at the pros and cons of one, two, three, and four chains,<br />
quickly dismissing one-chain helices as incompatible with the evidence in<br />
our hands. As to the forces that held the chains together, the best guess<br />
seemed to be salt bridges in which divalent cations like Mg ++ held together<br />
two or more phosphate groups. Admittedly there was no evidence that<br />
Rosy’s samples contained any divalent ions, and so we might be sticking our<br />
necks out. … with luck, the addition of magnesium or possibly calcium ions<br />
to the sugar-phosphate backbone would quickly generate an elegant<br />
structure, the correctness of which would not be debatable.<br />
… a shape began to emerge which brought back our spirits. Three<br />
chains twisted about each other in a way that gave rise to crystallographic<br />
repeat every 28 Å along the helical axis.<br />
Note: An ångström (Å) is 1 ¥ 10 –10 m, so 28 Å is 2.8 nm.<br />
Franklin’s response to the Crick-Watson 3-chain model<br />
(1952)<br />
Wilkins was invited to Cambridge to witness the triumph; William Seeds, who<br />
worked with Wilkins, came along, and Rosalind and Gosling as well. The<br />
session was opened by Crick with an exposition of helical diffraction theory,<br />
a subject upon which he was very expert, and went on to a description of the<br />
model, of which Rosalind plainly did not think much. Her disdain of it<br />
Watson accounts for on the grounds that what was proposed was a helical<br />
structure, while Rosalind did not admit that a shred of evidence existed to<br />
indicate that DNA was helical – a curious statement, considering that very<br />
shortly before she had presented a good deal of evidence suggesting that the<br />
B form of DNA was exactly that. What she did object to in the proposed<br />
structure – and aggressively, we are told – was that the three-chain model<br />
had its phosphate groups held together by Mg ++ ions in a way she thought<br />
unlikely, considering that by her calculations the Mg ++ ions would be<br />
surrounded by tight shells of water molecules.<br />
And as Watson was required to confess, her objections, though very<br />
annoying, were not mere perversity.<br />
A. Sayre 1975. Rosalind Franklin and<br />
DNA (New York: Norton, pp. 125–6).<br />
Reprinted 1978.<br />
James D. Watson 1968. The Double Helix<br />
(London: Weidenfeld & Nicolson,<br />
pp. 77–89). With new introduction, 1999<br />
(London: Penguin Books).<br />
A. Sayre 1975. Rosalind Franklin and<br />
DNA (New York: Norton, pp. 135–6).<br />
Reprinted 1978.<br />
184<br />
„ Salters Advanced Chemistry 2000 – see Copyright restrictions
LIFE REVEALS ITS TWISTED SECRET<br />
EP2.8<br />
Pauling’s 3-helix model (1952/1953)<br />
We have formulated a structure for the nucleic acids which is compatible<br />
with the main features of the X-ray diagram and with the general<br />
principles of molecular structure, and which accounts satisfactorily for<br />
some of the chemical properties of the substances. The structure involves<br />
three intertwined helical polynucleotide chains. Each chain, which is<br />
formed by phosphate di-ester groups and linking b-D-ribofuranose<br />
[D-ribose] or b-D-deoxyribofuranose [D-deoxyribose] residues with 3', 5'<br />
linkages, has approximately twenty-four nucleotide residues in seven turns<br />
of the helix. The helixes have the sense of a right handed screw. The<br />
phosphate groups are closely packed about the axis of the molecule, with<br />
the pentose residues surrounding them, and the purine and pyrimidine<br />
groups projecting radially, their planes being approximately perpendicular<br />
to the molecular axis. The operation that converts one residue to the next<br />
residue in the polynucleotide chain is rotation by about 105° and<br />
translation by 3.4 Å.<br />
A detailed description of the structure is appearing in the February<br />
1953 issue of the Proceedings of the National Academy of Sciences of the<br />
United States of America.<br />
Watson’s response to Pauling’s ideas (1953)<br />
At once I felt something was not right. I could not pinpoint the mistake,<br />
however, until I looked at the illustrations for several minutes. Then I<br />
realized that the phosphate groups in Linus’ model were not ionized, but<br />
that each group contained a bound hydrogen atom and so had no net<br />
charge. Pauling’s nucleic acid in a sense was not an acid at all. Moreover,<br />
the uncharged phosphate groups were not incidental features. The<br />
hydrogens were part of the hydrogen bonds that held together the three<br />
intertwined chains. Without the hydrogen atoms, the chains would<br />
immediately fly apart and the structure vanish.<br />
Everything I knew about nucleic-acid chemistry indicated that<br />
phosphate groups never contained bound hydrogen atoms.<br />
Pauling’s later comments<br />
I calculated the number of polynucleotide chains per unit to be exactly<br />
three. This result surprised me, because I had expected the value 2 if the<br />
nucleic acid fibres really represented genes … During the next month I<br />
strove to find a way of arranging the polynucleotide chains in a triple<br />
helix, and was successful, although the structure was described as “an<br />
extraordinarily tight one, with little opportunity for change in positions of<br />
the atoms” …<br />
In hindsight, it is evident that I made a mistake … in having decided to<br />
study the triple helix rather than the double helix. … I am now astonished<br />
that I began work on the triple helix structure, rather than on the double<br />
helix. I had not forgotten … that the gene might consist of two<br />
complementary molecules, but for some reason, not clear to me now, the<br />
triple chain structure apparently appealed to me, possibly because the<br />
assumption of a three-fold axis simplified the search for an acceptable<br />
structure.<br />
Crick and Watson’s crucial paper<br />
They acknowledge the contribution of Rosalind Franklin and Maurice Wilkins at<br />
the end of the paper. (See next sheet.)<br />
Linus Pauling, Robert B. Corey 1953.<br />
Structure of the Nucleic Acids. In Nature,<br />
February 21, vol. 171, p.346.<br />
James D. Watson 1968. The Double Helix<br />
(London: Weidenfeld & Nicolson, p. 160).<br />
With new introduction, 1999 (London:<br />
Penguin Books).<br />
Linus Pauling 1974. Molecular Basis of<br />
Biological Specificity. In Nature, vol. 248,<br />
p. 771.<br />
„ Salters Advanced Chemistry 2000 – see Copyright restrictions<br />
185
EP2.8<br />
LIFE REVEALS ITS TWISTED SECRET<br />
MOLECULAR STRUCTURE OF<br />
NUCLEIC ACIDS<br />
A Structure for Deoxyribose Nucleic Acid<br />
WE wish to suggest a structure for the salt<br />
of deoxyribose nucleic acid (D.N.A). This<br />
structure has novel features which are of considerable<br />
biological interest.<br />
A structure for nucleic acid has already been<br />
proposed by Pauling and Corey 1 . They kindly made<br />
their manuscript available to us in advance of<br />
publication. Their model consists of three intertwined<br />
chains, with the phosphates near the fibre<br />
axis, and the bases on the outside. In our opinion,<br />
this structure is unsatisfactory for two reasons:<br />
(1) We believe that the material which gives the<br />
X-ray diagrams is the salt, not the free acid. Without<br />
the acidic hydrogen atoms it is not clear what forces<br />
would hold the structure together, especially as the<br />
negatively charged phosphates near the axis will<br />
repel each other. (2) Some of the van der Waals<br />
distances appear to be too small.<br />
Another three-chain structure has also been suggested<br />
by Fraser (in the press). In his model the<br />
phosphates are on the outside and the bases on the<br />
inside, linked together by hydrogen bonds. This<br />
structure as described is rather ill-defined, and for<br />
this reason we shall not comment<br />
on it.<br />
We wish to put forward a<br />
radically different structure for<br />
the salt of deoxyribose nucleic<br />
acid. This structure has two<br />
helical chains each coiled round<br />
the same axis (see diagram). We<br />
have made the usual chemical<br />
assumptions, namely, that each<br />
chain consists of phosphate diester<br />
groups joining ß-D-deoxyribofuranose<br />
residues with 3',5'<br />
linkages. The two chains (but<br />
not their bases) are related by a<br />
dyad perpendicular to the fibre<br />
axis. Both chains follow righthanded<br />
helices, but owing to<br />
the dyad the sequences of the<br />
atoms in the two chains run<br />
in opposite directions. Each<br />
chain loosely resembles Furberg’s<br />
2 model No. 1; that is,<br />
the bases are on the inside of<br />
the helix and the phosphates on<br />
This figure is purely<br />
diagrammatic. The two the outside. The configuration<br />
ribbons symbolize the<br />
of the sugar and the atoms<br />
two phosphate—sugar<br />
chains, and the horizontal<br />
rods the pairs of<br />
near it is close to Furberg’s<br />
‘standard configuration’, the<br />
bases holding the chains<br />
together. The vertical sugar being roughly perpendicular<br />
to the attached base. There<br />
line marks the fibre axis.<br />
is a residue on each chain every 3·4 A. in the z-direction.<br />
We have assumed an angle of 36° between<br />
adjacent residues in the same chain, so that the<br />
structure repeats after 10 residues on each chain, that<br />
is, after 34 A. The distance of a phosphorus atom from<br />
the fibre axis is 10 A. As the phosphates are on the<br />
outside, cations have easy access to them.<br />
The structure is an open one, and its water content<br />
is rather high. At lower water contents we would<br />
expect the bases to tilt so that the structure could<br />
become more compact.<br />
The novel feature of the structure is the manner<br />
in which the two chains are held together by the<br />
purine and pyrimidine bases. The planes of the bases<br />
are perpendicular to the fibre axis. They are joined<br />
together in pairs, a single base from one chain being<br />
hydrogen-bonded to a single base from the other<br />
chain, so that the two lie side by side with identical<br />
z-co-ordinates. One of the pair must be a purine and<br />
the other a pyrimidine for bonding to occur. The<br />
hydrogen bonds are made as follows: purine position<br />
1 to pyrimidine position 1; purine position 6 to<br />
pyramidine position 6.<br />
If it is assumed that the bases only occur in the<br />
structure in the most plausible tautomeric forms<br />
(that is, with the keto rather than the enol configurations)<br />
it is found that only specific pairs of<br />
bases can bond together. These pairs are: adenine<br />
(purine) with thymine (pyrimidine), and guanine<br />
(purine) with cytosine (pyrimidine).<br />
In other words, if an adenine forms one member of<br />
a pair, on either chain, then on these assumptions<br />
the other member must be thymine; similarly for<br />
guanine and cytosine. The sequence of bases on a<br />
single chain does not appear to be restricted in any<br />
way. However, if only specific pairs of bases can be<br />
formed, it follows that if the sequence of bases on<br />
one chain is given, then the sequence on the other<br />
chain is automatically determined.<br />
It has been found experimentally 3,4 that the ratio<br />
of the amounts of adenine to thymine, and the ratio<br />
of guanine to cytosine, are always very close to unity<br />
for deoxyribose nucleic acid.<br />
It is probably impossible to build this structure<br />
with a ribose sugar in place of the deoxyribose, as<br />
the extra oxygen atom would make too close a van<br />
der Waals contact.<br />
The previously published X-ray data 5,6 on deoxyribose<br />
nucleic acid are insufficient for a rigorous test<br />
of our structure. So far as we can tell, it is roughly<br />
compatible with the experimental data, but it must<br />
be regarded as unproved until it has been checked<br />
against more exact results. Some of these are given<br />
in the following communications. We were not aware<br />
of the details of the results presented there when we<br />
devised our structure, which rests mainly though not<br />
entirely on published experimental data and stereochemical<br />
arguments.<br />
It has not escaped our notice that the specific<br />
pairing we have postulated immediately suggests a<br />
possible copying mechanism for the genetic material.<br />
Full details of the structure, including the conditions<br />
assumed in building it, together with a set<br />
of co-ordinates for the atoms, will be published<br />
elsewhere.<br />
We are much indebted to Dr. Jerry Donohue for<br />
constant advice and criticism, especially on interatomic<br />
distances. We have also been stimulated by<br />
a knowledge of the general nature of the unpublished<br />
experimental results and ideas of Dr. M. H. F.<br />
Wilkins, Dr. R. E. Franklin and their co-workers at<br />
King’s College, London. One of us (J. D. W.) has been<br />
aided by a fellowship from the National Foundation<br />
for Infantile Paralysis.<br />
J. D. Watson<br />
F. H. C. Crick<br />
Medical Research Council Unit for the<br />
Study of the Molecular Structure of<br />
Biological Systems.<br />
Cavendish Laboratory, Cambridge.<br />
April 2.<br />
1 Pauling, L., and Corey, R. B.. Nature, 171, 346 (1953); Proc. U.S.<br />
Nat. Acad. Sci., 39, 84 (1953).<br />
2 Furberg, S., Acta Chem. Scand., 6, 634 (1952).<br />
3 Chargaff, E., for references see Zamenhof, S., Brawerman, G. and<br />
Chargaff, E., Biochim. et Biophys. Acta, 9, 402 (1952).<br />
4 Wyatt, G. R., J. Gen. Physiol., 36, 201 (1952).<br />
5 Astbury. W. T., Symp. Soc. Exp. Biol. 1, Nucleic acid, 66 (Camb.<br />
Univ. Press, 1947).<br />
6 Wilkins, M. H. F., and Randell, J. T., Biochim. et Biophys. Acta,<br />
10, 192 (1953).<br />
NATURE<br />
NO. 4356 April 25, 1953<br />
186<br />
„ Salters Advanced Chemistry 2000 – see Copyright restrictions
EP6.1<br />
Testing for glucose<br />
Diabetes can be diagnosed by detecting glucose in the<br />
urine. The test must be specific to avoid confusion<br />
with other compounds which may be present. The<br />
specificity of an enzyme in its reaction with a<br />
particular substrate is therefore a useful basis for<br />
such a test. In this activity you can find out about the<br />
specificity of the enzyme glucose oxidase and<br />
investigate some of its other properties.<br />
Requirements<br />
● glucose test strips (such as Clinistix TM or Diastix TM )<br />
● hydrochloric acid, 1 mol dm –3<br />
● sodium hydroxide solution, 1 mol dm –3<br />
● glucose solution, 0.02 mol dm –3<br />
●<br />
solutions or samples of other sugars<br />
sodium hydroxide solution<br />
CARE Eye protection<br />
must be worn.<br />
IRRITANT<br />
WEAR EYE<br />
PROTECTION<br />
What you do<br />
Carefully read the instructions which come with the glucose test strips, and<br />
make sure you know how they work (see also Storyline EP6).<br />
1 The glucose solution you are supplied with has a similar concentration to the<br />
glucose in the urine of someone who is diabetic. Check that the test strips<br />
work with the glucose solution.<br />
2 Investigate how the activity of the enzyme glucose oxidase is affected by<br />
changing:<br />
●<br />
●<br />
●<br />
pH<br />
temperature<br />
substrate (the sugar used).<br />
Record your results in the form of a table.<br />
3 You might like to go on to refine your experiments in order to discover in<br />
more detail how the enzyme’s activity depends on pH and temperature.<br />
4 Summarise your findings and suggest explanations for the effects you have<br />
noted.<br />
„ Salters Advanced Chemistry 2000 – see Copyright restrictions<br />
187
EP6.2<br />
Succinate<br />
dehydrogenase<br />
(Optional extension)<br />
In this activity you will use models to investigate the<br />
binding of a substrate to the active site of an enzyme.<br />
This will help you to understand why enzymes are so<br />
specific, and how some compounds can act as enzyme<br />
inhibitors.<br />
Requirements<br />
●<br />
molecular model kit<br />
Introduction<br />
Butanedioic acid (succinic acid) is oxidised to trans-butenedioic acid by removal<br />
of hydrogen. This reaction is catalysed by the enzyme succinate dehydrogenase.<br />
HOOC–CH 2<br />
–CH 2<br />
–COOH Æ HOOC–CH–CH–COOH<br />
butanedioic acid<br />
trans-butenedioic acid<br />
The enzyme is inhibited by propanedioic acid: HOOC–CH 2<br />
–COOH; in other<br />
words, its catalytic activity is less in the presence of propanedioic acid. This,<br />
together with other evidence, suggests that two –COOH groups are involved in<br />
binding the substrate to the active site.<br />
The action of the enzyme is summarised in Figure 1.<br />
butanedioic acid<br />
succinate<br />
dehydrogenase<br />
succinate dehydrogenase–<br />
butanedioic acid complex<br />
2H +<br />
trans-butenedioic acid<br />
succinate<br />
dehydrogenase<br />
Figure 1 The action of succinate dehydrogenase<br />
succinate dehydrogenase–<br />
trans-butenedioic acid complex<br />
What you do<br />
1 Make molecular models of the three acids (butanedioic<br />
acid, trans-butenedioic acid, and propanedioic acid).<br />
2 Place the molecule of trans-butenedioic acid on a piece of<br />
paper so that all the atoms are touching the paper. Draw<br />
circles on the paper to mark the positions of the oxygen<br />
and hydrogen atoms of the –COOH groups. Note the<br />
position of the other hydrogen atoms. (Remember, this is<br />
the product of the oxidation reaction.)<br />
3 Now manipulate your structure of butanedioic acid so that<br />
the hydrogens and oxygens of its –COOH groups can be<br />
placed on the same marks. One H atom of each –CH 2<br />
–<br />
group should also be touching the paper. Note the<br />
positions of the other two H atoms – the ones which are<br />
removed by the enzyme.<br />
4 Leave the model of butanedioic acid in place and<br />
superimpose your model of propanedioic acid on it so that<br />
the –COOH groups coincide. (You will need to ‘close up’<br />
the butanedioic acid structure a little to achieve this.)<br />
Using a different colour, mark the new positions of the<br />
oxygen and hydrogen atoms of the –COOH groups.<br />
This should show you that both butanedioic acid and<br />
propanedioic acid can be bound by their –COOH groups<br />
to the same site on the enzyme. The product of the<br />
oxidation reaction, trans-butenedioic acid, binds to this<br />
site less well and is released from the enzyme.<br />
The oxidation (removal of hydrogen) occurs at another<br />
part of the active site. This must be where the C–C bond<br />
between the two central carbons of butanedioic acid<br />
naturally comes when it is placed as above.<br />
Propanedioic acid is an inhibitor because it has no C–C<br />
bond to oxidise, but it can bind onto the site and block it.<br />
5 Now consider pentanedioic acid:<br />
HOOC–CH 2<br />
–CH 2<br />
–CH 2<br />
–COOH.<br />
Make a model of its structure. Try to fit it onto the<br />
marks you made in 4. Decide whether you would expect<br />
it to:<br />
● bind to the enzyme or not<br />
● be oxidised by the enzyme to<br />
HOOC–CH 2<br />
–CH–CH–COOH<br />
● be an inhibitor.<br />
188<br />
„ Salters Advanced Chemistry 2000 – see Copyright restrictions
EP6.3<br />
The effect of enzyme<br />
and substrate<br />
concentrations on the<br />
rate of a reaction<br />
In this activity you will follow the progress of a<br />
catalysed reaction by measuring the volume of gas<br />
produced as the reaction proceeds. You will use the<br />
initial rates of a series of experiments to find the<br />
orders of the reaction with respect to enzyme and<br />
substrate.<br />
Requirements<br />
● burette (50 cm 3 )<br />
● trough or bowl<br />
● boiling tube with bung and delivery tube<br />
● graduated pipette (5 cm 3 ) and safety filler<br />
● measuring cylinder (10 cm 3 )<br />
● hydrogen peroxide solution, 5 vol (25 cm 3 )<br />
● yeast suspension (20 cm 3 ), made from 2 g dried yeast in<br />
160 cm 3 water aerated for several hours<br />
● stopwatch<br />
CARE Eye protection<br />
must be worn.<br />
WEAR EYE<br />
PROTECTION<br />
Introduction<br />
In this activity, the substrate is hydrogen peroxide (H 2<br />
O 2<br />
) and the enzyme is<br />
catalase. You will use yeast as a source of catalase.<br />
Hydrogen peroxide is formed as a waste product of metabolism by many<br />
organisms. It is toxic and must be rapidly removed from the cells. The enzyme<br />
catalase catalyses the decomposition of hydrogen peroxide to produce water<br />
and oxygen.<br />
2H 2<br />
O 2<br />
(aq) Æ 2H 2<br />
O(l) + O 2<br />
(g)<br />
The reaction can be monitored by measuring the volume of oxygen produced as<br />
the reaction proceeds, and plotting a graph of the volume of oxygen produced<br />
against time. You can find the rate of the reaction (in terms of the volume of<br />
oxygen produced per second) at any time by measuring the gradient of the<br />
curve.<br />
You may like to practise your IT skills and make use of graph-plotting<br />
computer software to plot your results. It is usually best, however, to draw the<br />
best-fitting line or curve by hand.<br />
It is important when investigating rates of reaction to vary one factor at a<br />
time. All other factors which could affect the rate should be kept constant.<br />
What you do<br />
It will be best to work in groups. One group should tackle Part 1 while another<br />
group does Part 2. Combine your results at the end.<br />
Take the opportunity to use a spreadsheet to collect your data. The graphplotting<br />
function will help you to find the initial rate of each reaction.<br />
inverted<br />
burette<br />
Part 1: Varying the concentration of hydrogen peroxide<br />
1 Fill a burette with water and invert it in a trough of water. Hold it in place with<br />
a clamp and check that the burette is leak-proof. Make sure you leave enough<br />
room in the trough for water which will be displaced from the burette.<br />
2 Place 2.5 cm 3 of well-stirred yeast suspension in a boiling tube and set up<br />
the apparatus in Figure 1. Carefully open the tap on the burette until<br />
the meniscus falls to the 50 cm 3 mark (i.e. zero for this experiment as the<br />
burette is upside down).<br />
3 Measure out 5 cm 3 of hydrogen peroxide in a 10 cm 3 measuring cylinder.<br />
Organise yourselves for taking and recording readings of volume at<br />
10-second intervals for 4 minutes.<br />
yeast suspension +<br />
hydrogen peroxide<br />
solution<br />
Figure 1 Measuring the volume of oxygen<br />
produced<br />
water<br />
„ Salters Advanced Chemistry 2000 – see Copyright restrictions<br />
189
EP6.3<br />
THE EFFECT OF ENZYME AND SUBSTRATE CONCENTRATIONS ON THE RATE OF A REACTION<br />
4 Add 5 cm 3 of hydrogen peroxide to the yeast suspension and quickly replace<br />
the bung. Zero time is counted as the time the first bubble appears in the<br />
burette. Take a reading of the volume of gas in the burette every 10 seconds<br />
for 4 minutes.<br />
5 Wash out the boiling tube, refill the burette, and repeat steps 1–4 four more<br />
times, using:<br />
4cm 3 H 2<br />
O 2<br />
+ 1 cm 3 distilled H 2<br />
O<br />
3cm 3 H 2<br />
O 2<br />
+ 2 cm 3 distilled H 2<br />
O<br />
2cm 3 H 2<br />
O 2<br />
+ 3 cm 3 distilled H 2<br />
O<br />
1cm 3 H 2<br />
O 2<br />
+ 4 cm 3 distilled H 2<br />
O<br />
in the measuring cylinder. Everything else should be the same in each<br />
experiment.<br />
6 Plot the volume of O 2<br />
given off (vertical axis) against time (horizontal axis)<br />
for each experiment, drawing all the curves on the same axes.<br />
QUESTIONS<br />
a How does the rate of the reaction change as the reaction proceeds?<br />
Explain why the rate changes in this way.<br />
b Draw a tangent to each curve at t = 0. This represents the initial<br />
rate of the reaction: its rate at the start. How does the initial rate of<br />
the reaction vary with the starting concentration of hydrogen<br />
peroxide?<br />
c Measure the gradient of each tangent. Plot the initial rate for each<br />
experiment against the volume of hydrogen peroxide used. (The<br />
volume of hydrogen peroxide is proportional to its concentration<br />
since the total volume is kept constant.) What is the order of the<br />
reaction with respect to hydrogen peroxide?<br />
Part 2: Varying the concentration of enzyme<br />
7 Follow the procedure in steps 1–4 in Part 1.<br />
8 Wash out the boiling tube, refill the burette, and repeat steps 1–4 four more<br />
times, using:<br />
2.0 cm 3 yeast + 0.5 cm 3 distilled H 2<br />
O<br />
1.5 cm 3 yeast + 1.0 cm 3 distilled H 2<br />
O<br />
1.0 cm 3 yeast + 1.5 cm 3 distilled H 2<br />
O<br />
0.5 cm 3 yeast + 2.0 cm 3 distilled H 2<br />
O<br />
in the boiling tube. Everything else should be the same in each experiment.<br />
9 Plot the volume of O 2<br />
given off (vertical axis) against time (horizontal axis)<br />
for each experiment, drawing all the curves on the same axes.<br />
QUESTIONS<br />
d How does the rate of the reaction change as the reaction proceeds?<br />
Explain why the rate changes in this way.<br />
e Draw a tangent to each curve at t = 0. This represents the initial<br />
rate of the reaction: its rate at the start. How does the initial rate of<br />
the reaction vary with the starting concentration of the enzyme? You<br />
can assume that the starting concentration of the enzyme is<br />
proportional to the volume of yeast used, since the total volume was<br />
kept constant.<br />
f Measure the gradient of each tangent. Plot the initial rate for each<br />
experiment against the volume of yeast used. What is the order of<br />
the reaction with respect to the enzyme?<br />
190<br />
„ Salters Advanced Chemistry 2000 – see Copyright restrictions
EP6.4<br />
Using the iodine clock<br />
method to find the order<br />
of a reaction<br />
This activity illustrates another way in which the<br />
initial rate method can be used to determine the<br />
order of a reaction with respect to one of the<br />
reactants.<br />
Requirements<br />
●<br />
0–110∞C thermometer<br />
● boiling tubes (5)<br />
●<br />
test-tubes<br />
● burettes (or graduated pipettes 1 cm 3 , 2 cm 3 and 5 cm 3 )<br />
● potassium iodide solution, 1.00 mol dm –3 (15 cm 3 )<br />
● potassium peroxodisulphate(VI) (K 2<br />
S 2<br />
O 8<br />
) solution,<br />
0.0400 mol dm –3 (10 cm 3 )<br />
● sodium thiosulphate (Na 2<br />
S 2<br />
O 3<br />
) solution,<br />
0.0100 mol dm –3 (10 cm 3 )<br />
● freshly made starch solution (5 cm 3 )<br />
● stopwatch<br />
potassium peroxodisulphate(VI)<br />
solution<br />
CARE Eye protection<br />
must be worn.<br />
HARMFUL<br />
WEAR EYE<br />
PROTECTION<br />
OXIDISING<br />
About the reaction<br />
Peroxodisulphate(VI) ions and iodide ions react together in solution to form<br />
sulphate(VI) ions and iodine.<br />
S 2<br />
O 8 2– (aq) + 2I – (aq) Æ 2SO 4 2– (aq) + I 2<br />
(aq)<br />
Both reactants and the sulphate ions are colourless, so the progress of the<br />
reaction can be measured by following the colour of the iodine produced. The<br />
iodine can be detected even more clearly by placing some starch in the reaction<br />
mixture: iodine forms an intense blue-black complex with starch.<br />
One way of measuring the initial rate of the reaction is to measure how long<br />
the reaction takes to produce a small, fixed amount of iodine. By answering the<br />
questions which accompany this activity, you can work out what amount of<br />
iodine has been chosen here, and what fraction of the extent of reaction this<br />
represents.<br />
You can make the time taken to produce a particular amount of iodine really<br />
obvious if you add thiosulphate ions to the reaction mixture at the start.<br />
Thiosulphate ions turn iodine back to iodide ions.<br />
2S 2<br />
O 3 2– (aq) + I 2<br />
(aq) Æ S 4<br />
O 6 2– (aq) + 2I – (aq)<br />
So, no starch-iodine colour will appear until all the thiosulphate has been used<br />
up. What you see is a colourless reaction mixture sitting there as though nothing<br />
is happening; then, suddenly, it turns blue. If you measure how long that takes,<br />
you know how long it took to use up all the thiosulphate and, therefore, how<br />
long it took to produce the equivalent amount of iodine.<br />
This method of studying reaction rates is sometimes called the clock method,<br />
and this experiment is an example of an iodine clock experiment. You are going<br />
to use it to investigate how the reaction rate depends on the concentration of<br />
iodide ions in the reaction mixture.<br />
You may like to practise your IT skills and make use of graph-plotting<br />
computer software to plot your results. It is usually best, however, to draw the<br />
best-fitting line or curve by hand.<br />
„ Salters Advanced Chemistry 2000 – see Copyright restrictions<br />
191
EP6.4<br />
USING THE IODINE CLOCK METHOD TO FIND THE ORDER OF A REACTION<br />
What you do<br />
1 First you are going to make up reaction mixture 1 from Table 1, and measure<br />
how long it takes for the blue iodine-starch colour to appear.<br />
Look carefully at Table 1. The five mixtures differ only in the concentration<br />
of iodide ions. Water is added to keep the total volume of solution constant,<br />
so the concentration of everything else is the same in each mixture.<br />
Reaction rates depend upon temperature. Measure the temperature of<br />
each experiment. Make sure that all your results are taken at approximately<br />
the same temperature and record an average value.<br />
You can place the potassium iodide, sodium thiosulphate, starch and (for<br />
later mixtures) water straight into a boiling tube. You must measure out the<br />
potassium peroxodisulphate(VI) solution (CARE Harmful. Oxidiser) into a<br />
separate container, such as a test-tube.<br />
2 When you are ready to start the experiment, pour the potassium<br />
peroxodisulphate(VI) solution into the mixture in the boiling tube.<br />
Immediately start timing, and carefully stir the reaction mixture with a<br />
thermometer to ensure that everything is properly mixed. Record the time<br />
taken for the blue colour to appear.<br />
Mixture Volume of Volume of Volume of Volume of Volume of<br />
KI(aq) water Na 2<br />
S 2<br />
O 3<br />
(aq) starch K 2<br />
S 2<br />
O 8<br />
(aq)<br />
/cm 3 /cm 3 /cm 3 solution/cm 3 /cm 3<br />
1 5 0 2 1 2<br />
2 4 1 2 1 2<br />
3 3 2 2 1 2<br />
4 2 3 2 1 2<br />
5 1 4 2 1 2<br />
Table 1 Mixtures for the iodine clock<br />
experiments<br />
3 Repeat the procedure with mixtures 2–5, and record the time taken for the<br />
blue colour to appear in each case.<br />
Find the order of reaction<br />
You could use a spreadsheet to collect your results and to perform the<br />
calulations.<br />
To find the order of the reaction with respect to iodide ions, you need to<br />
know how the initial rate of the reaction varies with iodide ion concentration.<br />
The steps in the calculation are summarised below:<br />
● Work out [I – ] in each mixture.<br />
● Work out the amount of I 2<br />
produced before the blue-black colour appears.<br />
● Use this amount of I 2<br />
and the clock time to work out the initial rate of reaction<br />
for each mixture.<br />
● Plot a graph of the initial rate of reaction against [I – ].<br />
● Use the graph to determine the order of the reaction with respect to I – ions.<br />
The questions on the next sheet will help you work through these steps.<br />
192<br />
„ Salters Advanced Chemistry 2000 – see Copyright restrictions
USING THE IODINE CLOCK METHOD TO FIND THE ORDER OF A REACTION<br />
EP6.4<br />
QUESTIONS<br />
a Draw up a results table using the headings below:<br />
Mixture Concentration of Clock Rate Temp<br />
I – (aq)/mol dm –3 time /s /mol dm –3 s –1 /°C<br />
Table 2 Results table<br />
b Calculate values for the concentrations of iodide ions in the five<br />
reaction mixtures. Record these in the table, together with the<br />
corresponding times for the blue-black colour to appear (the clock<br />
times).<br />
c Which reactant, I – or S 2<br />
O 2– 8<br />
, is in excess in the reaction mixtures?<br />
The reactant not in excess will be used up in the reaction. It<br />
determines the total amount of iodine which can be produced.<br />
d What is the total amount in moles of iodine which can be produced<br />
by each of the reaction mixtures?<br />
e i What amount in moles of thiosulphate ions is added to each<br />
reaction mixture?<br />
ii What amount of iodine will be used up by thiosulphate ions<br />
during the course of each experiment?<br />
iii What percentage of the extent of reaction is studied during the<br />
experiments? (For the clock method to work well, the extent of<br />
reaction studied should be no more than 10–15% of the total<br />
extent of the reaction.)<br />
f The initial rate of the reaction can be measured in mol dm –3 I 2<br />
produced per second.<br />
i For each mixture, divide your answer to e ii by the time taken for<br />
the appearance of the blue colour, and so calculate the initial<br />
rate (in mol dm –3 s –1 ) at which each mixture reacts.<br />
ii Record the reaction rates in the table.<br />
g i Plot a graph of rate against concentration of iodide ions<br />
(horizontal axis).<br />
ii What is the order of reaction with respect to iodide ions?<br />
h A similar series of experiments shows that the reaction is first order<br />
with respect to S 2<br />
O 2– 8<br />
ions.<br />
i Write a rate equation for the reaction of peroxodisulphate(VI) ions<br />
and iodide ions.<br />
ii What is the overall order of the reaction?<br />
iii Calculate the rate constant for the reaction using the gradient of<br />
the graph you obtained in g i. Make sure you give the correct<br />
units and the temperature at which your measurements were<br />
made.<br />
„ Salters Advanced Chemistry 2000 – see Copyright restrictions<br />
193
EP6.5<br />
Enzyme kinetics<br />
Accurate results in experiments involving enzymes<br />
can be hard to obtain. This activity provides you with<br />
two exercises, based on accurate data, which should<br />
help to reinforce your work about the rates of enzymecatalysed<br />
reactions. Use Storyline EP6 to help you<br />
explain your results.<br />
Introduction<br />
The enzyme urease catalyses the hydrolysis of urea.<br />
H 2<br />
N–CO–NH 2<br />
(aq) + H 2<br />
O(l) Æ CO 2<br />
(aq) + 2NH 3<br />
(aq)<br />
In the exercises which follow, the initial rate of reaction was measured by finding<br />
the number of moles of urea which had been hydrolysed during the first three<br />
minutes of the reaction. The average rate over the first three minutes, in units of<br />
mol dm –3 min –1 , was then found.<br />
Exercise 1<br />
The results described in Table 1 represent a series of experiments in which<br />
the concentration of urea (the substrate) was varied but the concentration of<br />
urease (the enzyme) was kept constant.<br />
Plot a graph of the reaction rate against the substrate concentration<br />
(horizontal axis).<br />
a<br />
b<br />
c<br />
d<br />
When the substrate concentration is high, what is the approximate<br />
order of reaction with respect to substrate?<br />
The following mechanism has been proposed for enzyme-catalysed<br />
reactions (E = enzyme, S = substrate, P = product):<br />
E + S Æ ES Æ EP Æ E + P<br />
Explain why your answer to a tells you that the first step in this<br />
mechanism is not the rate-determining step at high substrate<br />
concentration.<br />
At high substrate concentrations, all the enzyme active sites are<br />
occupied. This is known as active site saturation. Explain how this<br />
idea supports your answers to a and b.<br />
At lower substrate concentrations, there is a change in the way the<br />
rate depends on concentration. At very low substrate concentrations,<br />
the reaction is approximately first order with respect to the substrate.<br />
Suggest a reason for this.<br />
Exercise 2<br />
The results in Table 2 come from an experiment in which the concentration of<br />
urea (the substrate) was kept fixed and the concentration of urease (the<br />
enzyme) was varied. This was achieved by adding different volumes of urease<br />
solution to the reaction mixture, and keeping the total volume constant by<br />
making up with the appropriate volume of water.<br />
Plot a graph of the reaction rate against the volume of urease solution, which is a<br />
measure of the urease concentration (horizontal axis).<br />
e<br />
f<br />
What is the order of reaction with respect to the enzyme?<br />
Describe how your answer to e can be explained in terms of the<br />
mechanism proposed in b.<br />
Concentration of<br />
urea/mol dm –3 Rate/mol dm –3 min –1<br />
0 0<br />
0.005 1.7 ¥ 10 –6<br />
0.010 2.3 ¥ 10 –6<br />
0.020 3.2 ¥ 10 –6<br />
0.050 4.4 ¥ 10 –6<br />
0.100 5.9 ¥ 10 –6<br />
0.200 7.2 ¥ 10 –6<br />
0.300 7.7 ¥ 10 –6<br />
0.400 8.0 ¥ 10 –6<br />
0.500 8.1 ¥ 10 –6 Table 1<br />
Volume of urease<br />
solution/cm 3 Rate/mol dm –3 min –1<br />
0 0<br />
0.050 0.6 ¥ 10 –6<br />
0.100 0.8 ¥ 10 –6<br />
0.200 1.8 ¥ 10 –6<br />
0.300 3.2 ¥ 10 –6<br />
0.500 4.8 ¥ 10 –6<br />
1.000 10.4 ¥ 10 –6<br />
1.500 14.9 ¥ 10 –6<br />
2.000 19.5 ¥ 10 –6 Table 2<br />
194<br />
„ Salters Advanced Chemistry 2000 – see Copyright restrictions
EP7<br />
Check your notes on<br />
Engineering Proteins<br />
This activity helps you get your notes in order at the<br />
end of this unit.<br />
Use this list as the basis of a summary of the unit by<br />
collecting together the related points and arranging them in<br />
groups. Check that your notes cover the points and are<br />
organised in appropriate ways. Remember that you will be<br />
coming back to some of the ideas in later units.<br />
Most of the points are covered in the Chemical Ideas,<br />
with supporting information in the Storyline or Activities.<br />
However, if the main source of information is the Storyline<br />
or an Activity, this is indicated.<br />
●<br />
●<br />
●<br />
●<br />
●<br />
●<br />
●<br />
●<br />
●<br />
●<br />
●<br />
●<br />
Proteins are condensation polymers formed from amino<br />
acid monomers.<br />
The general structure of amino acids.<br />
The acid–base properties of amino acids and the<br />
formation of zwitterions.<br />
The formation and hydrolysis of the peptide link between<br />
amino acid residues in proteins (Storyline EP2; Activity<br />
EP2.2).<br />
The use of paper chromatography to identify amino acids<br />
(Activity EP2.2).<br />
The importance of amino acid sequence in determining<br />
the properties of proteins, and the diversity of proteins in<br />
living things (Storyline EP2).<br />
Stereo-isomers: cis-trans and optical isomers<br />
(enantiomers).<br />
The use of the term chiral as applied to a molecule.<br />
How nuclear magnetic resonance (n.m.r.) spectroscopy<br />
can be used for the elucidation of molecular structure.<br />
The interpretation of n.m.r. spectra for simple compounds<br />
given relevant information (Activity EP2.3).<br />
The expression for the equilibrium constant, K c<br />
, for a given<br />
reaction.<br />
The way in which changes of temperature and pressure<br />
affect the magnitude of the equilibrium constant.<br />
●<br />
●<br />
●<br />
●<br />
●<br />
●<br />
●<br />
●<br />
●<br />
●<br />
●<br />
●<br />
●<br />
●<br />
●<br />
The use of values of K c<br />
, together with given data on<br />
equilibrium concentrations, to calculate the composition<br />
of equilibrium mixtures.<br />
The primary, secondary and tertiary structures of proteins<br />
(Storyline EP4).<br />
The role of hydrogen bonds and other intermolecular<br />
forces in determining the structure and properties of<br />
proteins (Storyline EP4).<br />
The double helix structure of DNA in terms of a<br />
sugar–phosphate backbone and attached bases (Storyline<br />
EP2).<br />
The significance of hydrogen bonding in the pairing of<br />
bases in DNA, and the replication of genetic information<br />
(Storyline EP2; Activities EP2.7 and EP2.8).<br />
How DNA encodes for the amino acid sequence in a<br />
protein.<br />
The use of empirical rate equations of the form:<br />
rate = k[A] m [B] n where m and n are integers.<br />
The meaning of the terms: rate of reaction, rate constant,<br />
order of reaction (both overall and with respect to a given<br />
reagent).<br />
Experimental methods for measuring the rate of reactions.<br />
How to use experimental data to find the order of a<br />
reaction (zero, first or second order).<br />
How to use given data to calculate half-lives for a reaction.<br />
The industrial importance of enzymes (Storyline EP6).<br />
The characteristics of enzyme catalysis, including:<br />
specificity, temperature and pH sensitivity, and inhibition<br />
(Storyline EP6).<br />
The specificity of enzymes in terms of a simple ‘lock and<br />
key’ model of enzyme action.<br />
The technique of ‘genetic engineering’ and its applications<br />
(Storyline EP3 and EP5).<br />
EP<br />
© Harcourt Education Ltd 2004 Salters Advanced Chemistry<br />
These pages have been downloaded from www.heinemann.co.uk/science<br />
2
SS1.1<br />
How much manganese is<br />
there in a paper clip?<br />
Requirements<br />
● paper clip (or similar everyday steel object)<br />
● wire cutters or strong scissors<br />
● accurate balance<br />
● 250 cm 3 beaker<br />
● 10 cm 3 and 100 cm 3 measuring cylinders<br />
● nitric(V) acid, 2.0 mol dm –3 (100 cm 3 )<br />
● phosphoric(V) acid (10 cm 3 )<br />
In this activity you will design and carry out an<br />
experiment to determine how much manganese there<br />
is in a paper clip, staple, pin or other similar<br />
everyday steel object. To do this you will need to find<br />
out how to measure the concentration of a coloured<br />
substance in solution. You will find it helpful to read<br />
Chemical Ideas 6.7 to find out why some compounds<br />
are coloured.<br />
nitric(V) acid<br />
phosphoric(V) acid<br />
IRRITANT<br />
CORROSIVE<br />
● potassium iodate(VII) (periodate) solution (5 g KIO 4<br />
dissolved in 100 cm 3 of 2.0 mol dm –3 HNO 3<br />
) (10 cm 3 )<br />
● Bunsen burner, tripod and gauze<br />
● 100 cm 3 volumetric flask<br />
● small funnel<br />
● colorimeter with appropriate filter<br />
● matched thin-walled (soda) test-tubes for use with<br />
colorimeter (2)<br />
● solid potassium manganate(VII)<br />
● dilute sulphuric acid, 1.0 mol dm –3<br />
●<br />
●<br />
additional glassware as required<br />
protective gloves<br />
CARE Potassium manganate(VII) is harmful and<br />
stains the hands. Wear protective gloves.<br />
potassium iodate(VII)<br />
potassium manganate(VII)<br />
sulphuric acid<br />
CARE Eye protection and<br />
gloves must be worn.<br />
HARMFUL<br />
IRRITANT<br />
OXIDISING<br />
HARMFUL IRRITANT OXIDISING<br />
IRRITANT<br />
WEAR EYE WEAR<br />
PROTECTION PROTECTIVE<br />
GLOVES<br />
Introduction<br />
Steels vary greatly in composition but most will contain some manganese to<br />
increase the hardness of the alloy. In this activity you will develop a procedure<br />
for estimating the amount of manganese present in a sample of steel.<br />
You will first convert the manganese in your paper clip into a solution<br />
containing the purple manganate(VII) ion, MnO 4 – (aq). This is done in two<br />
stages. Nitric acid oxidises the manganese to Mn 2+ (aq) ions. A more powerful<br />
oxidising agent, potassium iodate(VII), KIO 4<br />
, is then needed to complete the<br />
oxidation to manganese(VII).<br />
In the second part of the activity you will develop a method for determining<br />
the concentration of the manganese(VII) solution.<br />
What you do<br />
1 Weigh accurately about 0.2 g of cut-up paper clip or some similar everyday<br />
steel item.<br />
2 Put it into approximately 70 cm 3 of 2.0 mol dm –3 nitric acid (CARE Irritant)<br />
in a beaker. In a fume cupboard, warm but do not boil the acid to help the<br />
steel to dissolve. The nitric acid oxidises the manganese to Mn 2+ (aq) ions.<br />
3 Add about 10 cm 3 of phosphoric(V) acid (CARE Corrosive) to the beaker<br />
followed by about 10 cm 3 of potassium iodate(VII) solution (CARE Harmful<br />
and irritant. Avoid skin contact). Boil the solution carefully for 10 minutes.<br />
Allow the mixture to cool. (The phosphoric(V) acid prevents the<br />
precipitation of insoluble iron(III) salts.)<br />
4 When the solution is cool pour it into a 100 cm 3 volumetric flask using a small<br />
funnel. It is important not to lose any of the solution. Rinse the remaining<br />
„ Salters Advanced Chemistry 2000 – see Copyright restrictions<br />
201
SS1.1<br />
HOW MUCH MANGANESE IS THERE IN A PAPER CLIP?<br />
solution from the beaker and funnel into the flask with distilled water and add<br />
further distilled water to bring the solution in the flask exactly up to the mark.<br />
5 Stopper the flask and shake it to ensure that the solution is uniform. All the<br />
manganese which was in your 0.2 g of paper clip is now in the purple<br />
solution as the manganate(VII) ion (MnO 4 – (aq)).<br />
Determining the concentration of a coloured solution<br />
You now need to find out the concentration of the purple solution so that you<br />
can calculate the amount of manganese originally in the paper clip.<br />
The concentration of a coloured solution can be found quickly and easily<br />
with a colorimeter.<br />
Figure 1 shows a simplified diagram of a colorimeter. A narrow beam of light<br />
passes through the solution under test and towards a sensitive photocell. In<br />
most colorimeters it is possible to select light in the most appropriate region by<br />
turning a knob to select a particular filter or to adjust a diffraction grating.<br />
e –<br />
narrow beam<br />
of light<br />
e –<br />
202<br />
filter or diffraction grating to<br />
select light of wavelengths<br />
absorbed by the solution<br />
solution<br />
under test<br />
The current generated in the photocell depends on the amount of light<br />
transmitted by the solution. This in turn depends on the concentration of the<br />
coloured solution under test. Normally the meter is calibrated to show the<br />
absorbance of the solution, rather than the light transmitted, because the<br />
absorbance is proportional to the concentration of the coloured substance in<br />
solution:<br />
absorbance µ concentration of coloured solution<br />
(You can read in Chemical Ideas 6.7 about why some solutions are coloured.)<br />
Designing your experiment<br />
6 Now plan your experiment. It will be helpful to discuss your ideas in pairs or<br />
small groups.<br />
You will need to produce a calibration graph by plotting the absorbance of<br />
potassium manganate(VII) solution (y-axis) against its concentration (x-axis).<br />
You will need about five or six points on your graph. The absorbance of the<br />
solution from the paper clip can then be measured and its concentration<br />
read off from the graph.<br />
Most steels contain less than 2% of manganese and a typical value for the<br />
steel used in a paper clip is about 0.3%. Use these figures to calculate the<br />
maximum mass of KMnO 4<br />
which could be present in 100 cm 3 of solution<br />
from your paper clip. Use 1.0 mol dm –3 sulphuric acid (CARE Irritant) to<br />
dissolve the potassium manganate(VII) (CARE Powerful oxidiser. Harmful<br />
and irritant. Avoid skin contact).<br />
Consider the following points:<br />
●<br />
●<br />
●<br />
●<br />
●<br />
What range of concentrations of solution will you need to enable you to<br />
plot a calibration curve?<br />
How many different concentrations will you need and what should they<br />
be?<br />
What is the most accurate way of making up these solutions? Remember,<br />
they will be very dilute.<br />
What apparatus will you need?<br />
Which chemicals?<br />
photocell<br />
„ Salters Advanced Chemistry 2000 – see Copyright restrictions<br />
sensitive meter<br />
Figure 1 Simplified diagram of a colorimeter
HOW MUCH MANGANESE IS THERE IN A PAPER CLIP?<br />
SS1.1<br />
7 Write an outline plan of your experiment. Prepare a Risk Assessment for<br />
your planned activity and a list of sources you have used in developing your<br />
plan and your Risk Assessment. Do not start until you have discussed these<br />
with your teacher.<br />
8 Having made your plans you can now go ahead to get some results. From<br />
the results, work out the percentage of manganese in your paper clip.<br />
9 When you have finished, write out your method in such a way that it could<br />
be used by another chemist without further help. Include your result as a<br />
guide to the figure which might be expected.<br />
QUESTIONS<br />
a Explain how the first stages of the procedure you used could give a<br />
qualitative test for manganese in steel.<br />
b You probably made up the potassium manganate(VII) solutions for<br />
your calibration graph using some form of dilution technique.<br />
Explain how diluting solutions in this way can lead to errors in your<br />
measurements.<br />
c Why is it necessary to use carefully matched tubes in a colorimeter?<br />
d Calculate the percentage error for each of the measurements you<br />
have made. In view of these uncertainties and any sources of<br />
procedural errors you have identified, how many significant figures<br />
are you justified in using for the percentage of manganese in the<br />
paper clip?<br />
e Why is a green or yellow-green filter chosen in this experiment?<br />
What general principles should be used when choosing a filter for a<br />
colorimetric investigation?<br />
f This activity illustrates an important aspect of the chemistry of<br />
manganese which is its ability to form compounds in a variety of<br />
oxidation states. What is the oxidation number of manganese in Mn,<br />
Mn 2+ and MnO – 4<br />
? Explain why the conversion of Mn to MnO – 4<br />
is an<br />
oxidation process.<br />
g A solution of manganate(VII) is a powerful oxidising agent and is<br />
often used to titrate substances which are readily oxidised. You may<br />
have used a solution of manganate(VII) to find out the amount of<br />
iron in an iron compound in The Elements of Life, Activity EL2.1.<br />
Explain why a similar redox titration method could not be used to<br />
find the concentration of the manganese(VII) solution from your<br />
paper clip. (Hint: Think about what other chemicals may be in your<br />
solution.)<br />
„ Salters Advanced Chemistry 2000 – see Copyright restrictions<br />
203
SS1.2<br />
A redox titration<br />
In this activity you use a solution of potassium<br />
manganate(VII) to carry out a redox titration to<br />
investigate the oxidisable material present in spinach.<br />
Requirements<br />
● spinach/spinach beet (15 g) or rhubarb leaves (5 g)<br />
●<br />
●<br />
scissors<br />
250 cm 3 beaker<br />
● sulphuric acid, 1.0 mol dm –3 (300 cm 3 )<br />
sulphuric acid<br />
IRRITANT<br />
●<br />
●<br />
●<br />
●<br />
●<br />
●<br />
●<br />
●<br />
100 cm 3 measuring cylinder<br />
Bunsen burner, tripod and gauze<br />
Buchner funnel and vacuum filtration apparatus<br />
100 cm 3 volumetric flask<br />
10 cm 3 pipette amd pipette filler<br />
250 cm 3 conical flask<br />
0–110 °C thermometer<br />
burette<br />
● potassium manganate(VII) solution, 0.01 mol dm –3<br />
(150 cm 3 )<br />
●<br />
protective gloves<br />
CARE Eye protection<br />
must be worn.<br />
WEAR EYE<br />
PROTECTION<br />
CARE Take care when pouring potassium<br />
manganate(VII) solution as it stains the hands.<br />
Wear protective gloves if necessary.<br />
Introduction<br />
Iron is an important mineral element in foods. The recommended intake for<br />
adults is 10–15 mg per day and each person contains about 4 g of iron, mainly in<br />
the haemoglobin of red blood cells. Surprisingly human beings absorb less than<br />
10% of the iron in their diet. The reason for this is that only iron(II) ions are<br />
absorbed whereas most of the iron in foods is iron(III). Vitamin C reduces a<br />
small proportion of the iron(III) to iron(II) and ensures that it does not reoxidise.<br />
Spinach and spinach beet have a high iron(II) content (4 mg per 100 g) but<br />
this cannot be absorbed in the stomach because it is locked up in insoluble<br />
oxalate (ethandioate) complexes.<br />
This experiment investigates the amount of iron(II) and oxalate present in<br />
spinach by means of a redox titration.<br />
204<br />
What you do<br />
1 Weigh approximately 15 g of spinach/spinach beet. (If using rhubarb leaf<br />
substitute, only use 5 g and remember it is poisonous if eaten due to the<br />
high oxalate content.)<br />
2 Using scissors, cut the leaves into small pieces and place in a 250 cm 3 beaker.<br />
(If frozen spinach is used then simply place in the 250 cm 3 beaker.)<br />
3 Using a measuring cylinder, add 50 cm 3 1.0 mol dm –3 sulphuric acid (CARE<br />
Irritant) and boil the mixture gently for 5 minutes.<br />
4 Allow the mixture to cool a little and filter it, using a Buchner funnel and<br />
vacuum filtration. Wash the residue in the funnel once with a little distilled<br />
water and collect all the filtrate.<br />
5 Pour all the filtrate and washings into a 100 cm 3 volumetric flask. Make up to<br />
100 cm 3 with 1.0 mol dm –3 sulphuric acid. Stopper the flask and shake it well.<br />
6 Fill a burette with potassium manganate(VII) solution. (CARE Stains the<br />
hands. Avoid skin contact and wear protective gloves if necessary.)<br />
7 Using a pipette, transfer 10 cm 3 of the spinach extract solution to a 250 cm 3<br />
conical flask and add 50 cm 3 of 1.0 mol dm –3 sulphuric acid using a measuring<br />
cylinder. Heat the mixture to 60 °C.<br />
8 Titrate the solution in the conical flask with 0.01 mol dm –3 potassium<br />
manganate(VII) solution from the burette until the pink colour persists for<br />
30 seconds.<br />
„ Salters Advanced Chemistry 2000 – see Copyright restrictions
A REDOX TITRATION<br />
SS1.2<br />
9 Repeat until there are three titration values (titres) within 0.1 cm 3 of each<br />
other. Record your results.<br />
Record your results<br />
Mass of spinach =<br />
g<br />
Rough 1 2 3 4<br />
Final burette reading / cm 3<br />
Initial burette reading / cm 3<br />
Titration value (titre) / cm 3<br />
Average titre = cm 3<br />
Using your results<br />
The formula of iron(II) oxalate is Fe 2<br />
(C 2<br />
O 4<br />
) 2<br />
(which is more correctly<br />
written as Fe[Fe(C 2<br />
O 4<br />
) 2<br />
(H 2<br />
O) 2<br />
]).<br />
Both the Fe 2+ (aq) ions and the C 2<br />
O 2– 4<br />
(aq) ions react with potassium<br />
manganate(VII). The half equations for these reactions are:<br />
MnO – 4<br />
(aq) + 8H + (aq) + 5e – Æ Mn 2+ (aq) + 4H 2<br />
O(l)<br />
C 2<br />
O 2– 4<br />
(aq) Æ 2CO 2<br />
(g) + 2e –<br />
Fe 2+ (aq) Æ Fe 3+ (aq) + e –<br />
When these half-equations are combined to give an overall equation for<br />
the reaction of MnO 4 – ions with Fe 2<br />
(C 2<br />
O 4<br />
) 2<br />
, it can be shown that 6 moles<br />
of MnO 4 – (aq) react with 5 moles of Fe 2<br />
(C 2<br />
O 4<br />
) 2<br />
.<br />
10 Using your average titration value work out the number of moles of<br />
potassium manganate(VII) used.<br />
11 Assuming that the potassium manganate(VII) has reacted only with<br />
iron(II) oxalate, how many moles of Fe 2<br />
(C 2<br />
O 4<br />
) 2<br />
would be present in the<br />
10 cm 3 sample of extract?<br />
12 What would be the total number of moles of Fe 2<br />
(C 2<br />
O 4<br />
) 2<br />
in the 100 cm 3<br />
sample of extract?<br />
13 What mass of Fe 2<br />
(C 2<br />
O 4<br />
) 2<br />
would be in the sample of spinach?<br />
14 What would be the Fe 2<br />
(C 2<br />
O 4<br />
) 2<br />
content of spinach in g per 100 g?<br />
15 Comment on the value you obtain in 14 in the light of the information<br />
given in the introduction.<br />
QUESTIONS<br />
a At the endpoint of the titration the pink colour persists for about<br />
30 seconds. What is the pink colour due to?<br />
b Suggest why the spinach extract solution has to be heated to 60 °C<br />
for the titration.<br />
„ Salters Advanced Chemistry 2000 – see Copyright restrictions<br />
205
SS2.1<br />
Why is blast furnace iron<br />
so impure?<br />
This activity will help you to understand why the iron<br />
produced in a blast furnace is so impure.<br />
Blast furnace iron is the starting material for making steel. To answer the<br />
questions below you may have to refer back to your earlier work on iron or look<br />
up the blast furnace in a textbook. Use this activity to make brief summary notes<br />
about how iron is produced in a blast furnace.<br />
QUESTIONS<br />
a What raw materials are fed into a blast furnace?<br />
b Explain why the conversion of iron ore to iron is a reduction. Name<br />
the main reducing agent.<br />
c Summarise the chemical reactions which take place, using a series<br />
of chemical equations.<br />
d The iron produced contains 3–5% carbon. Where has this carbon<br />
come from?<br />
e What is the origin of the silicon impurity present? Much silicon has<br />
already been separated out from the iron inside the blast furnace.<br />
Explain how this was done.<br />
f Suggest likely origins for the sulphur, phosphorus and manganese<br />
impurities in the iron produced.<br />
206<br />
„ Salters Advanced Chemistry 2000 – see Copyright restrictions
SS2.2<br />
What changes occur<br />
during steelmaking?<br />
In this activity you will investigate the changes in<br />
composition and temperature as a batch of steel is<br />
made by the BOS process. It will give you an<br />
opportunity to practise using a computer spreadsheet<br />
program to handle data, draw bar charts and plot<br />
graphs. The second part of this activity will also give<br />
you an overview of how steel is made.<br />
Part 1: Plotting the changes<br />
The Corus (formerly British Steel) Works at Scunthorpe produce some steel<br />
suitable for making the carbon dioxide cylinders used in Sodastream fizzy drinks<br />
makers. You may have watched a batch being produced on the The Steel Story<br />
video.<br />
The cylinders are pressed to shape from circular discs cut out of thin steel<br />
plate. The steel must be ductile so that it can be moulded without developing<br />
cracks, but strong enough to hold the gas safely at 28 atmospheres pressure.<br />
You are going to investigate the changes in composition and temperature which<br />
happened while a batch of this steel was being made.<br />
The best way to do this activity is to use a computer with the facility to draw<br />
bar charts and plot graphs from stored data. This is a much easier and quicker<br />
way of handling data than by manual plotting.<br />
You can speed things up by working in groups, so that each group plots one<br />
chart or graph. At the end pool your results.<br />
Changes in composition<br />
Table 1 shows the percentages of the elements carbon, silicon, manganese,<br />
phosphorus and sulphur in the molten metal at five different stages (labelled A<br />
to E) during the BOS process.<br />
1 Draw a bar chart showing how the percentage of carbon changes during the<br />
process. (The five stages A to E should be on the x-axis; the percentage of<br />
carbon should be on the y-axis.)<br />
2 Using a new set of axes, plot a similar chart showing how the percentages of<br />
silicon, manganese and phosphorus change. Plot the values for all three<br />
elements on the same chart.<br />
3 Plot a chart on a third set of axes showing how the percentage of sulphur<br />
changes.<br />
a Write a short explanation of the changes in the percentages of the five<br />
elements shown by your charts.<br />
Table 1 Analysis data for a cast of steel for<br />
Sodastream from the Scunthorpe Works of Corus.<br />
Temp/°C %C %Si %Mn %P %S<br />
Customer’s specification 0.34–0.39 0.15–0.25 1.40–1.50
SS2.2<br />
WHAT CHANGES OCCUR DURING STEELMAKING?<br />
Changes in temperature<br />
4 Using the information in Table 1, plot a graph to illustrate how the<br />
temperature of the metal changes during the BOS process.<br />
5 Draw a dotted line across your graph to show the target tapping<br />
temperature. (This is the ideal temperature for steel leaving the converter at<br />
the end of the oxygen blow.)<br />
b The freezing point of pure iron is 1539°C yet the metal arriving from<br />
the blast furnace is molten at a temperature of 1333°C. Why has it<br />
not solidified?<br />
c Write a short explanation of the changes in temperature shown by<br />
your graph.<br />
Part 2: Making a flow diagram<br />
A flow diagram is one way of summarising the stages in a complex process such<br />
as steelmaking. Flow diagrams can be helpful in picking out the main thread<br />
from a complicated text and giving you a visual picture of the overall scheme.<br />
Starting with blast furnace iron, as shown in the incomplete diagram in Figure<br />
1, construct your own flow diagram to show the steps involved in steelmaking.<br />
Make sure you show the steps in the right order and think about the substances<br />
which leave the process as well as the ones that are added.<br />
You can draw the flow diagram by hand or use a computer drawing program.<br />
You may find it helpful to summarise other parts of your work in this way.<br />
blast furnace iron<br />
Figure 1 A flow diagram to show the production<br />
of steel from iron<br />
magnesium<br />
steel<br />
208<br />
„ Salters Advanced Chemistry 2000 – see Copyright restrictions
SS2.3<br />
Getting the ‘heat<br />
balance’ right<br />
(Optional extension)<br />
Controlling the temperature to keep it within<br />
acceptable limits is an essential part of the BOS process.<br />
It is done by adding scrap steel to the converter along<br />
with the molten iron. In this activity you will work out<br />
how much scrap would be needed for a given batch of<br />
steel to achieve its target tapping temperature.<br />
Introduction<br />
The energy changes which take place in the converter during the BOS process<br />
can be summarised by a ‘heat balance’ equation as shown below:<br />
Energy given out by the<br />
oxidation reactions of<br />
Fe, C, Si, Mn and P<br />
=<br />
Energy used in raising the<br />
temperature of the converter<br />
contents (lime, calcined<br />
dolomite, oxygen, iron and<br />
scrap steel)<br />
+<br />
Energy used in heating<br />
the surroundings<br />
At the steelworks, all these energy changes are estimated using a computer<br />
model. It calculates the amount of scrap steel, lime and calcined dolomite (a<br />
mixture of calcium and magnesium oxides made by heating dolomite) and the<br />
duration of the oxygen blow required to give the chosen specification and the<br />
final temperature of the steel.<br />
In this activity you will carry out this type of calculation for yourself. You are<br />
going to work out first how much energy was generated by the oxidation<br />
reactions when a cast of steel for Sodastream was made at the Corus Works at<br />
Scunthorpe. Then, you will go on to estimate the amount of scrap steel needed<br />
in the converter so that the temperature does not rise above the target tapping<br />
temperature. You will need to consult Table 1 in Activity SS2.2 which gives<br />
information about this batch of steel.<br />
Part 1: The total energy given out by the<br />
oxidation reactions<br />
a<br />
Calculate the enthalpy change for each of the exothermic reactions<br />
taking place in the converter. Do this by filling in Table 1 below using<br />
information from Table 1 in Activity SS2.2. The values for carbon<br />
have already been filled in for you.<br />
You will need to watch the units in your calculation carefully. The<br />
masses in the converter are given in tonnes (1 tonne = 1000 kg =<br />
1 x 10 6 g). The molar enthalpy changes give the enthalpy change<br />
when 1 mole of each element is oxidised; for carbon the mass of<br />
1 mole of atoms is 12.0 g.<br />
(A r<br />
: Fe, 56; C, 12; Si, 28; Mn, 55; P, 31)<br />
Oxidised element Fe C Si Mn P<br />
Percentage of element in molten metal charged to converter (Stage B) – 4.42<br />
Mass of element charged to converter/tonnes (total mass = 278 tonnes) – 12.29<br />
Percentage of element in molten metal at tapping (Stage C) – 0.04<br />
Mass of element at tapping/tonnes (total mass = 303 tonnes) – 0.12<br />
Mass of element oxidised/tonnes 8.5* 12.2<br />
Amount of element oxidised/10 6 mol 1.02<br />
Molar enthalpy change/kJ mol –1 –350 –133 –745 –399 –600<br />
Enthalpy change in converter/10 6 kJ –135.7<br />
* Estimated from iron oxide in slag<br />
Table 1 Exothermic changes in the BOS<br />
converter<br />
b<br />
Now calculate the total enthalpy change in the converter as a result<br />
of these oxidation reactions.<br />
„ Salters Advanced Chemistry 2000 – see Copyright restrictions<br />
209
SS2.3<br />
GETTING THE ‘HEAT BALANCE’ RIGHT<br />
Part 2: How much scrap steel is needed?<br />
This involves a lengthy calculation: we have done some of it for you, and you will<br />
do only the last part.<br />
Look back at the ‘heat balance’ equation on the previous page. Some of the<br />
energy given out by the oxidation reactions is lost from the converter to the<br />
surroundings through normal cooling. It can be estimated that approximately<br />
25 ¥ 10 6 kJ were lost by radiation and convection in this way.<br />
The rest of the energy released by the oxidation reactions is used to raise the<br />
temperature of the converter contents. We can calculate how much energy is<br />
required to raise each of the contents of the converter from their initial<br />
temperatures to the final temperature if we know how much of each substance<br />
was added and its specific heating capacity. The results of such calculations are<br />
shown in Table 2.<br />
Material Quantity added Energy absorbed<br />
to converter<br />
/10 6 kJ<br />
Lime 11.9 tonnes 18.4<br />
Calcined dolomite 9.49 tonnes 16.5<br />
Oxygen gas 16.8 ¥ 10 3 m 3 20.8<br />
Molten iron 278 tonnes 86.3<br />
Scrap steel ? ?<br />
Table 2 Energy absorbed in heating up the<br />
contents of the converter<br />
c<br />
Using the information above, calculate how much scrap steel was<br />
needed in order to achieve the tapping temperature of 1738°C.<br />
Assume that the steel added was at 20°C and that the specific<br />
heating capacity of steel is 0.83 ¥ 10 3 kJ t –1 K –1 . (This value has been<br />
averaged out over the temperature range and allows for the enthalpy<br />
change of fusion on melting. It gives the amount of energy which<br />
must be supplied to raise the temperature of 1 tonne of steel by 1K.)<br />
The energy absorbed by the steel is related to the rise in<br />
temperature in the following way:<br />
energy absorbed = mass ¥ specific heating capacity ¥ temperature rise<br />
210<br />
„ Salters Advanced Chemistry 2000 – see Copyright restrictions
SS2.4<br />
How much aluminium do<br />
we need to add?<br />
(Optional extension)<br />
This activity is about the role of aluminium in<br />
steelmaking. Aluminium is used to remove oxygen<br />
dissolved in the steel but is also one of the elements<br />
added to modify the properties of the metal. You will<br />
calculate the amount of aluminium that must be added<br />
to a batch of steel to perform both these functions.<br />
You will again be using information about the steel cast which you met in<br />
Activities SS2.2 and SS2.3.<br />
The total mass of steel tapped from the converter at the end of the oxygen<br />
blow was 303 tonnes.<br />
Work through the following questions to calculate how much aluminium<br />
must be added to remove dissolved oxygen and meet the customer’s<br />
specification for aluminium content.<br />
You will need to think carefully about units of mass during your calculation.<br />
The mass of steel in the converter is given in tonnes, while the aluminium ingots<br />
are weighed in kilograms. The molar masses of oxygen and aluminium are in<br />
g mol –1 .<br />
(1 tonne = 1000 kg = 1 ¥ 10 6 g) (A r<br />
: O, 16; A1, 27)<br />
QUESTIONS<br />
a Analysis of the steel tapped from the converter showed that it<br />
contained 0.104% oxygen. Calculate the mass of this oxygen in<br />
tonnes.<br />
b Convert this mass of oxygen to the amount in moles of O 2<br />
.<br />
c Write a balanced equation for the reaction between aluminium and<br />
oxygen.<br />
d Calculate the amount in moles of aluminium needed to react with<br />
this dissolved oxygen.<br />
e What is the mass of aluminium needed, in kilograms?<br />
f Assume all of this aluminium is lost as a slag. The customer’s<br />
specification for the batch of steel requires 0.039% aluminium.<br />
Calculate the additional mass of aluminium, in kilograms, which<br />
must be added to achieve this.<br />
g Work out the total mass of aluminium added to the steel.<br />
h The aluminium is thrown into the molten steel as 20 kilogram<br />
ingots. How many ingots should be used?<br />
i In fact, 28 ingots of aluminium were added to this cast to achieve<br />
the specification. Suggest why this is different from the figure you<br />
have just worked out.<br />
„ Salters Advanced Chemistry 2000 – see Copyright restrictions<br />
211
SS2.5<br />
Which is the right steel<br />
for the job?<br />
(Optional extension)<br />
This activity illustrates how the properties and<br />
eventual use of a steel relate to its composition.<br />
Introduction<br />
An army tank and a kitchen sink are each made from steel. The different uses<br />
demand quite different properties from the metal, however. One of the major<br />
factors leading to different properties is the composition of the steel.<br />
What you do<br />
Use the Information Sheet (Some elements and their effects on the properties<br />
of steel) to match the eight steel uses (A–H) to the specifications numbered 1–8<br />
in Table 1.<br />
The first one has been done for you to show you the idea: the steel with<br />
specification number 1 would be suitable for use D, the CO 2<br />
cylinder for a fizzydrinks<br />
maker. The steel must be capable of being moulded into shape without<br />
developing cracks, but must be strong enough to hold the gas safely at high<br />
pressure. So a medium-carbon steel is used with aluminium and manganese<br />
added for toughness and good moulding properties. Low sulphur, phosphorus<br />
and nitrogen reduce its tendency to crack.<br />
Now match the most suitable composition to each of the remaining steel<br />
applications. Briefly explain the reasons for your answers.<br />
Steel uses<br />
A A paper clip (mild steel which can be drawn to form a wire)<br />
B Stainless steel for severe marine environments, such as in living quarters on<br />
oil rigs<br />
C Stainless steel for a surgeon’s knife<br />
D Sodastream CO 2<br />
cylinder<br />
E A high-speed drill tip<br />
F An off-shore gas pipe<br />
G A finely-machined spindle for a galvanometer<br />
H A ring spanner<br />
Steel specification 1 2 3 4 5 6 7 8<br />
C 0.350 0.110 0.100 0.750 0.025 0.043 0.500 0.070<br />
Si 0.200 0.350 0.400 0.400 0.350 0.042 0.300 0.005<br />
Mn 1.400 0.650 1.500 0.400 1.700 0.252 1.000 1.300<br />
P 0.018 0.030 0.009 0.350 0.040 0.013 0.035 0.060<br />
S 0.003 0.010 0.001 0.350 0.007 0.014 0.035 0.350<br />
Cr 0.20 12.50 0.03 4.00 17.20 0.02 1.00 0.03<br />
V 0.15 0.15 0.15 1.20 0.20 0.15 0.15 0.15<br />
Mo 0.002 0.30 0.002
WHICH IS THE RIGHT STEEL FOR THE JOB?<br />
SS2.5<br />
Some help if you need it<br />
●<br />
●<br />
●<br />
●<br />
For each of the steel uses A–H make a list of the important properties the<br />
steel should possess, as well as properties it need not possess.<br />
Now read the Information Sheet carefully and jot down under each steel<br />
use the key elements to look for in the steel specification (eg high Cr or low<br />
S).<br />
Look through the steel specifications in Table 1 and identify the two stainless<br />
steels. Examine carefully the specifications for these two steels and use the<br />
Information Sheet to decide on the most appropriate use for each.<br />
Carbon content is a good initial indicator to the eventual use of the steel.<br />
Divide the remaining steel specifications into relatively high- and low-carbon<br />
steels. Then look for additional elements which confer specific properties,<br />
such as good machinability or resistance to wear.<br />
Low-carbon steel<br />
Medium-carbon steel<br />
High-carbon steel<br />
0.003–0.15% C<br />
0.16–0.40% C<br />
0.41–0.92% C<br />
(High-carbon steels may well extend above 0.92% C in the coming years as<br />
new steels come on stream.)<br />
„ Salters Advanced Chemistry 2000 – see Copyright restrictions<br />
213
SS2.5<br />
WHICH IS THE RIGHT STEEL FOR THE JOB?<br />
Information Sheet: Some elements and their<br />
effects on the properties of steel<br />
Nickel<br />
Nickel promotes toughness at low<br />
temperatures and reduces the<br />
chances of brittle fractures.<br />
Nickel is relatively inert and<br />
improves the corrosion resistance of<br />
steel. Up to 8% nickel is used in<br />
some stainless steels.<br />
Niobium<br />
Niobium forms an extremely hard and stable carbide.<br />
It is added to some stainless steels to increase<br />
resistance to corrosion and is also a constitutent of<br />
abrasion-resistant steels and steels to be used at<br />
high temperatures.<br />
Nitrogen<br />
All steels contain some dissolved nitrogen from the air.<br />
Generally nitrogen is undesirable in steel because it<br />
makes the metal less ductile.<br />
Copper<br />
Copper is added to steel to increase corrosion<br />
resistance. It also increases strength. Scrap electrical<br />
motors are often used as the source of copper.<br />
Aluminium<br />
Aluminium is often added to the molten metal<br />
because it forms a fine precipitate of<br />
aluminium nitride as the steel solidifies; this<br />
limits the size of the crystals formed in the<br />
cooling metal. The resulting material can be<br />
easily shaped, yet is tough and has good<br />
impact resistance. Aluminium is added to steel<br />
for car body panels, but is kept to a minimum<br />
in steel which is to be drawn out into wire, as<br />
regions of aluminium oxide tend to cause<br />
breakages.<br />
Chromium<br />
Chromium makes steel resistant to corrosion.<br />
Stainless steel contains 12-25% chromium.<br />
Chromium also improves wear resistance and<br />
helps steel to retain its strength at high<br />
temperatures (used in high-speed tools).<br />
Carbon<br />
Carbon is the most important alloying element in<br />
steel. By changing the carbon content a wide<br />
variety of mechanical properties can be produced:<br />
• Metal from the blast furnace (4% C) is very<br />
brittle.<br />
• High-carbon steel (1% C) is strong and resistant<br />
to hard wear.<br />
• Low-carbon or mild steel (0.008% C) is less<br />
strong but easily moulded.<br />
Manganese<br />
Manganese is the most used alloying metal in<br />
steel. Manganese improves the quality of steel<br />
by making it easier to work when hot and<br />
increasing hardness when cold. Manganese<br />
combines with residual sulphur to form small,<br />
evenly distributed sulphide crystals. It is present<br />
in all steels but is particularly important in<br />
steels used to make tools and dies.<br />
Silicon<br />
Silicon is added to most steels because small<br />
amounts improve the hardness and strength of<br />
the alloy.<br />
METHANE<br />
Phosphorus<br />
Small amounts of phosphorus severely reduce the<br />
quality of steel by reducing ductility. Ordinary<br />
steels have concentrations less than 0.04% but<br />
many steel specifications where cracking would<br />
be a very serious problem (such as in a gas<br />
pipeline) require the phosphorus concentration to<br />
be as low as 0.005%.<br />
Sulphur<br />
Usually much care is taken by steelmakers to<br />
reduce the sulphur content of steel. Sulphur<br />
increases corrosion rate, promotes stress<br />
corrosion cracking and increases brittleness at<br />
low temperatures. The development of the offshore<br />
and arctic oil industry has increased the<br />
demand for high-grade steels with very low<br />
sulphur content.<br />
However, small amounts of sulphur (0.08-<br />
0.13%) make it easier to machine the metal.<br />
Steel chips break away more easily during<br />
machining if there is iron sulphide present. This<br />
reduces tool wear and the volume of turning<br />
waste.<br />
Vanadium<br />
Vanadium promotes small crystal size in steels<br />
and increases the strength, hardness and wear<br />
resistance. It is an expensive addition to steel<br />
and so it is only used where the steel will<br />
experience exceptionally severe service, such<br />
as in tools and dies, structural steels for<br />
military vehicles, and rails (curves, switches<br />
and points).<br />
Lead<br />
Lead improves the machinability of steel.<br />
Small quantities are added to steel which is<br />
intricately machined into gears and shafts<br />
because it helps to cut down on wear of tools.<br />
Machine operators must take precautions to<br />
avoid lead poisoning when working with these<br />
steels.<br />
Soda Stream<br />
Hydrogen<br />
Steelmakers go to considerable lengths<br />
to limit the hydrogen in steel. Hydrogen<br />
is produced when any moisture comes<br />
into contact with the molten steel.<br />
Fe + H 2<br />
O Æ FeO + H 2<br />
Atomic hydrogen in steel migrates to<br />
internal defects where it forms hydrogen<br />
gas and builds up high pressures. This<br />
can cause flaking at the surface and<br />
even fracturing in such items as<br />
pipelines.<br />
Tellurium<br />
Tellurium is added to steels to improve<br />
machinability, either alone or with lead. Fumes from<br />
tellurium compounds can be noxious and proper<br />
venting must be provided whenever additions are<br />
made – otherwise workers can develop ‘tellurium<br />
breath’, with a strong garlic-like odour.<br />
GALVANOMETER<br />
Molybdenum<br />
Molybdenum is a valuable additive for the hardening of steel. It<br />
retards the softening of steel at high temperatures and improves the<br />
corrosion resistance of stainless steels. Molybdenum is used in steels<br />
for boilers, high-speed tools and for special stainless steels used for<br />
cladding oil-rig modules and for containers for corrosive liquids.<br />
Tungsten<br />
Tungsten is an important additive to<br />
high-speed tool steels. It forms hard<br />
carbides which have high abrasion<br />
resistance. It helps to retain high<br />
strength in steels at high temperature.<br />
It is used in fire-resistant construction<br />
steels.<br />
214<br />
„ Salters Advanced Chemistry 2000 – see Copyright restrictions
SS3.1<br />
A simple redox reaction<br />
In this short activity you will study one redox reaction<br />
in some detail to examine some of the general features<br />
of redox reactions. Chemical Ideas 9.1 and 9.2 will help<br />
you interpret the results of this experiment.<br />
Requirements<br />
●<br />
test-tubes or small beakers<br />
● copper(II) sulphate solution, 1.0 mol dm –3 (20 cm 3 )<br />
● zinc(II) sulphate solution, 1.0 mol dm –3 (20 cm 3 )<br />
● strips of zinc and copper (long enough to reach into the<br />
solutions)<br />
● zinc powder (1 g)<br />
● filter funnel and paper<br />
● 0–110 °C thermometer<br />
copper(II) sulphate<br />
zinc powder<br />
CARE Eye protection<br />
must be worn.<br />
HARMFUL<br />
FLAMMABLE<br />
WEAR EYE<br />
PROTECTION<br />
What you do<br />
1 Half-fill a test-tube with 1.0 mol dm –3 copper(II) sulphate solution (CARE<br />
Harmful). Note its temperature.<br />
2 Dip a strip of zinc into the solution and leave it for a short time. Remove the<br />
zinc, examine its surface, and record the changes you observe.<br />
3 Now add a spatula of zinc powder (CARE Flammable) to the test-tube of<br />
copper(II) sulphate solution. Stir, and record the maximum temperature<br />
reached.<br />
4 Filter the mixture. Compare the appearance of the filtrate with the colour of<br />
the original copper(II) sulphate solution. Be sure to make a fair comparison.<br />
5 Test whether copper reacts with zinc(II) sulphate solution.<br />
QUESTIONS<br />
a A solid coats the surface of the zinc. What do you think it is?<br />
b What ion is responsible for the blue colour of copper(II) sulphate<br />
solution? What has happened to the concentration of this ion during<br />
the reaction?<br />
c Write an overall equation for the reaction of zinc with copper(II)<br />
ions, and then split it into two half-reactions which show clearly<br />
that a redox reaction is involved.<br />
d What does the temperature change tell you about the reaction?<br />
e Does the reverse reaction happen?<br />
„ Salters Advanced Chemistry 2000 – see Copyright restrictions<br />
215
SS3.2<br />
Simple electrochemical<br />
cells<br />
This activity gives you a chance to set up a number of<br />
electrochemical cells. You will need to use your<br />
experimental skills to obtain reliable data on the<br />
cells. You then have an opportunity to develop your<br />
abilities in analysing data. You will learn about the<br />
relationship between the potential differences of<br />
different cells. Chemical Ideas 9.2 will help you<br />
interpret your results.<br />
Requirements<br />
● leads with crocodile clips (2)<br />
● 100 cm 3 beakers (3)<br />
● iron nail<br />
● copper metal strip (long enough to dip into the solution<br />
in the beaker)<br />
● zinc metal strip (long enough to dip into the solution in<br />
the beaker)<br />
● emery paper<br />
● distilled water<br />
● copper(II) sulphate solution, 1.00 mol dm –3 (50 cm 3 )<br />
● iron(II) sulphate solution, 1.00 mol dm –3 (50 cm 3 )<br />
● zinc(II) sulphate solution, 1.00 mol dm –3 (50 cm 3 )<br />
● filter paper strips soaked in saturated potassium<br />
nitrate(V) solution<br />
● high-resistance voltmeter (e.g. pH/mV meter)<br />
copper(II) sulphate<br />
CARE Eye protection<br />
must be worn.<br />
HARMFUL<br />
WEAR EYE<br />
PROTECTION<br />
Introduction<br />
You have probably used batteries in a number of different appliances. They are<br />
often called ‘dry’ cells because, for convenience, pastes rather than solutions are<br />
used in making up the cells. They are all based on redox reactions arranged to<br />
occur in two half-cells. The electricity produced is generated by a chemical<br />
reaction taking place in the cell.<br />
In this activity you will set up a number of metal ion/metal half-cells, combine<br />
them into cells, and measure the potential differences with a high-resistance<br />
voltmeter.<br />
What you do<br />
1 Clean the metal strips by rubbing them with emery paper, rinsing in distilled<br />
water, and drying them.<br />
2 Pour the copper(II) sulphate solution (CARE Harmful) into a beaker and<br />
place the copper metal strip into it. This forms the copper half-cell (Figure<br />
1). You can bend the foil over the edge of the beaker and hold it in place<br />
with the crocodile clip.<br />
copper<br />
metal<br />
copper(ll)<br />
sulphate<br />
solution<br />
The beaker contains both<br />
copper atoms (in the metal)<br />
and copper ions (in the solution)<br />
Figure 1 A copper half-cell, Cu 2+ (aq)/Cu(s)<br />
216<br />
„ Salters Advanced Chemistry 2000 – see Copyright restrictions
SIMPLE ELECTROCHEMICAL CELLS<br />
SS3.2<br />
3 Put the zinc(II) sulphate solution and the zinc strip in the other beaker. This<br />
is the zinc half-cell.<br />
4 Take a strip of filter paper soaked in saturated potassium nitrate(V) solution,<br />
and use it as a salt (ion) bridge to connect the solutions in the two beakers.<br />
5 Make sure that you know how to operate the voltmeter you will be using.<br />
Then complete the circuit by connecting the copper and zinc strips to the<br />
voltmeter as shown in Figure 2.<br />
high-resistance voltmeter<br />
V<br />
copper<br />
electrode<br />
salt bridge<br />
zinc<br />
electrode<br />
1.0 mol dm – 3<br />
solution of<br />
Cu 2+ (aq)<br />
1.0 mol dm – 3<br />
solution of<br />
Zn 2+ (aq)<br />
Figure 2 Arrangement for measuring the voltage of an electrochemical cell<br />
6 Record the voltage of the zinc–copper cell, and note carefully which half-cell<br />
is positive and which negative.<br />
7 Prepare an iron half-cell, Fe 2+ (aq)/Fe(s). Use a fresh salt bridge to connect it<br />
to a copper half-cell. Measure the voltage of the iron–copper cell.<br />
8 Finally, measure the voltage of a zinc–iron cell.<br />
9 If other half-cells are available you could extend your series of<br />
measurements.<br />
10 Do not throw away the metal-ion solutions, but return them to the<br />
containers provided.<br />
QUESTIONS<br />
Use Chemical Ideas 9.2 to help you interpret the results of this<br />
experiment.<br />
a Using the data you have obtained, construct a chart showing the<br />
potential differences between the half-cells you have investigated.<br />
Chemical Ideas 9.2, Figure 10, shows you how to do this.<br />
b The voltage of a silver–iron cell is 1.24 V, with the silver positive.<br />
Include this data on the chart you have constructed, and use it to<br />
calculate the voltage of a silver–copper cell.<br />
„ Salters Advanced Chemistry 2000 – see Copyright restrictions<br />
217
SS3.3<br />
More electrochemical<br />
cells<br />
This activity extends your experience of half-cells to<br />
ones in which both reagents are in solution. You will<br />
investigate whether these half-cells can combine to<br />
make electrochemical cells in a way similar to metal<br />
ion/metal systems. Chemical Ideas 9.2 will help you<br />
interpret your results.<br />
Requirements<br />
● copper(II) sulphate solution, 1.00 mol dm –3 (50 cm 3 )<br />
● copper metal strip (long enough to dip into the solution<br />
in the beaker)<br />
● emery paper<br />
● 100 cm 3 beakers (2)<br />
● leads with crocodile clips (3)<br />
● d.c. power supply able to give 3 V<br />
● clean graphite electrodes (2)<br />
● filter paper strips soaked in saturated potassium<br />
nitrate(V) solution<br />
● high-resistance voltmeter (eg pH/mV meter)<br />
● potassium iodide solution, 1.00 mol dm –3 (50 cm 3 )<br />
● potassium bromide solution, 1.00 mol dm –3 (50 cm 3 )<br />
● potassium chloride solution, 1.00 mol dm –3 (50 cm 3 )<br />
bromine<br />
chlorine<br />
copper(II) sulphate<br />
CARE Eye protection<br />
must be worn.<br />
TOXIC<br />
TOXIC<br />
HARMFUL<br />
WEAR EYE<br />
PROTECTION<br />
CORROSIVE<br />
CORROSIVE<br />
CARE The chlorine and bromine produced in Part 1 of<br />
this activity are toxic and corrosive gases. Avoid inhaling<br />
any fumes and do not let the electrolysis run for more than<br />
1–2 minutes.<br />
Introduction<br />
The half-cells you have looked at so far have involved a metal and its ion. In this<br />
activity you will investigate half-cells where no metal is involved. You will<br />
investigate halogen/halide ion half-cells. You must first make these, as follows.<br />
The halogen is generated by electrolysis, by passing an electric current<br />
through a solution of a metal halide. The halogen is produced at one of the<br />
graphite electrodes, covering its porous surface. The result is a half-cell<br />
consisting of the halogen (X 2<br />
) in contact with a solution of halide ions (X – ). The<br />
graphite electrode provides electrical contact and takes no part in the redox<br />
reaction.<br />
X 2<br />
+ 2e – D 2X –<br />
In the second part of the activity, you will connect the halogen/halide ion<br />
half-cell to a standard copper half-cell to make an electrochemical cell, and then<br />
measure its voltage.<br />
You can use the potential difference between the two half-cells to work out<br />
the electrode potential of the halogen/halide ion half-cell.<br />
Before you start this activity, make sure you understand what is happening in<br />
each part.<br />
What you do<br />
Part 1: Making the two half-cells<br />
1 Clean the copper electrode and set up a copper half-cell. (CARE Copper(II)<br />
sulphate solution is harmful.)<br />
Now make a halogen/halide ion half-cell as described in steps 2–4.<br />
2 Start with the potassium iodide solution. Place two graphite electrodes into<br />
50 cm 3 potassium iodide solution in a beaker and connect them to the d.c.<br />
power supply. Place the salt bridge and the copper half-cell in position<br />
before you start the electrolysis, as shown in Figure 1 on the next sheet.<br />
218<br />
„ Salters Advanced Chemistry 2000 – see Copyright restrictions
MORE ELECTROCHEMICAL CELLS<br />
SS3.3<br />
d.c. power +<br />
supply 3 V —<br />
solution of<br />
halide ions<br />
graphite<br />
electrode<br />
graphite electrode connected<br />
to positive side of power supply;<br />
this is where the halogen is produced<br />
standard copper half-cell<br />
(not used until Part 2)<br />
Figure 1 Arrangement for making the<br />
halogen/halide ion half-cell<br />
3 Set the power supply to 3 V and pass a current through the potassium iodide<br />
solution for about 1 minute. The half-cell now contains both I – ions and I 2<br />
.<br />
4 It is essential that the halogen/halide ion half-cell is not disturbed in any way<br />
before you take the voltage reading in the next part of the activity.<br />
Disconnect the d.c. power supply. Take great care not to disturb the graphite<br />
electrode which was connected to the positive terminal. It is very important<br />
that the halogen deposited on the surface of the electrode is not lost.<br />
Part 2: Making an electrochemical cell and measuring its<br />
voltage<br />
5 Link the halogen/halide ion half-cell to the standard copper half-cell by<br />
connecting a high-resistance voltmeter into the circuit as shown in Figure 2.<br />
Record the voltage of the cell. Note whether the iodine/iodide half-cell is<br />
positive or negative with respect to the copper half-cell.<br />
high-resistance voltmeter<br />
V<br />
halogen/halide<br />
ion half-cell<br />
standard copper<br />
half-cell<br />
Figure 2 Arrangement for measuring the<br />
potential difference between a halogen/halide<br />
ion half-cell and a standard copper half-cell<br />
Part 3: Using other halogen/halide ion half-cells<br />
6 Repeat the procedure in Parts 1 and 2 using potassium bromide solution<br />
instead of potassium iodide solution. You must rinse the graphite electrode<br />
thoroughly to remove iodine, and then reconnect it to the positive terminal<br />
of the power supply.<br />
7 Repeat the procedure once more, using potassium chloride solution.<br />
QUESTIONS<br />
Use Chemical Ideas 9.2 to help you interpret the results of your experiment.<br />
a A colourless gas is given off at the cathode (the negative electrode<br />
where reduction occurs) during the electrolysis in Part 1 of each<br />
experiment. What do you think the gas is?<br />
b The electrode potential of the standard copper half-cell is +0.34 V.<br />
Use the values you obtained in the experiment to calculate electrode<br />
potentials for each of the halogen/halide ion half-cells.<br />
c Compare these with the values of standard electrode potentials<br />
quoted on the Data Sheets.<br />
„ Salters Advanced Chemistry 2000 – see Copyright restrictions<br />
219
SS3.4<br />
How does steel rust?<br />
Requirements<br />
● test-tubes and rack<br />
● watch-glasses (small and large)<br />
● cottonwool<br />
● petri dishes (3)<br />
● iron filings (1 g)<br />
● iron nails (3)<br />
● emery paper<br />
● ethanol<br />
● copper metal foil (narrow strip)<br />
● zinc metal foil (narrow strip)<br />
● hydrochloric acid, 2.0 mol dm –3 (2 cm 3 )<br />
● sodium hydroxide solution, 2.0 mol dm –3 (3 cm 3 )<br />
● ferroxyl indicator solution (200 cm 3 ) (see advance<br />
preparation in the Teacher’s and Technician’s Guide)<br />
● agar gel or gelatin (optional) (6 g)<br />
● Bunsen burner<br />
● dropping pipette<br />
● piece of steel sheet (16 cm 2 )<br />
Rusting is an electrochemical process. This activity<br />
will help you to work out the stages involved and why<br />
rusting takes place. You should then be able to<br />
understand some of the methods used to prevent<br />
corrosion.<br />
ethanol<br />
ferroxyl indicator<br />
sodium hydroxide solution<br />
CARE Eye protection<br />
must be worn.<br />
HIGHLY<br />
FLAMMABLE<br />
HARMFUL<br />
CORROSIVE<br />
WEAR EYE<br />
PROTECTION<br />
Introduction<br />
Steel rusts because it reacts with the oxygen and the water in the atmosphere. In<br />
this activity, you will investigate the chemical changes that take place and find<br />
out how and why rusting happens.<br />
Set out below are a number of experiments. None of them will give a<br />
complete answer, but by putting the information from all of them together, like<br />
pieces of a jigsaw, a complete picture will emerge.<br />
Some of these experiments make use of ‘ferroxyl’ indicator. This is a<br />
solution of sodium chloride containing Phenolphthalein and potassium<br />
hexacyanoferrate(III). It produces a blue colour with Fe 2+ ions and a pink colour<br />
with OH – ions.<br />
What you do<br />
In each experiment, observe carefully what happens and keep a careful record.<br />
In some cases you will need to leave the experiment set up for some time and<br />
make your observations at intervals.<br />
Experiment 1<br />
1 Add a few iron filings to a little 2.0 mol dm –3 hydrochloric acid in a test-tube.<br />
Warm to dissolve the filings. Iron(II) chloride and hydrogen gas are formed.<br />
(The smelly gas also given off is hydrogen sulphide, produced by reaction of<br />
the acid with impurities in the iron.)<br />
2 Pour some of the solution onto a watch-glass. Add an excess of 2.0 mol dm –3<br />
sodium hydroxide solution (CARE Corrosive), and leave the precipitate<br />
which forms exposed to the air for a little while.<br />
a<br />
b<br />
Write a balanced ionic equation with state symbols for the reaction of<br />
iron filings with dilute acid.<br />
Describe and explain what happened when sodium hydroxide solution<br />
was added to the solution on the watch-glass. Write an ionic equation<br />
with state symbols for the reaction you observed.<br />
220<br />
„ Salters Advanced Chemistry 2000 – see Copyright restrictions
HOW DOES STEEL RUST?<br />
SS3.4<br />
c<br />
Describe and explain what happened when the watch-glass was left<br />
exposed to the air. Write a half-equation to show what happened to<br />
the iron.<br />
Experiment 2<br />
3 In Activity SS3.2 you made an electrochemical cell as shown in Figure 1.<br />
(There is no need to repeat the experiment here, but you need to remember<br />
what you did and what happened.)<br />
high-resistance voltmeter<br />
V<br />
copper electrode<br />
salt bridge<br />
iron electrode<br />
1.0 mol dm – 3<br />
solution of<br />
Cu 2+ (aq)<br />
1.0 mol dm – 3<br />
solution of<br />
Fe 2+ (aq)<br />
Figure 1 An electrochemical cell made up of<br />
Cu 2+ (aq)/Cu(s) and Fe 2+ (aq)/Fe(s) half-cells<br />
d Refer back to Activity SS3.2. What was the voltage of the cell (E cell<br />
)?<br />
Which half-cell was positive?<br />
e<br />
If the voltmeter were removed from the circuit and replaced by an<br />
ammeter, a larger current would flow. Write a half-equation for the<br />
reaction taking place in each half-cell when this happens. In which<br />
half-cell is an oxidation taking place?<br />
Experiment 3<br />
4 Clean three iron nails by rubbing them carefully with emery paper, followed<br />
by a cloth moistened with ethanol.<br />
Treat the nails as follows:<br />
Nail A<br />
Nail B<br />
No further treatment.<br />
Fold a narrow strip of copper foil in half, then push a nail between<br />
the two halves, slide the copper strip until it is just below the head<br />
of the nail, then crimp it tightly to make a good electrical contact, as<br />
in Figure 2.<br />
Nail C<br />
Proceed as for nail B, but using zinc foil instead of copper.<br />
5 Pour some ‘ferroxyl’ indicator into three petri dishes, to a depth of about<br />
5 mm, and place the dishes over a sheet of white paper marked with the letters<br />
A, B and C in the positions where you expect to place the nails. Carefully place<br />
each nail in the ‘ferroxyl’ indicator solution above its appropriate letter and<br />
observe what happens over a period of about ten minutes. The ‘ferroxyl’<br />
indicator solution should cover the nail completely.<br />
(Alternatively, you can use ‘ferroxyl’ indicator made up in an agar gel or<br />
gelatin. Add the nails and do not move the dishes until the gel is set. Cover<br />
and leave overnight. The gel will preserve the results.)<br />
6 Record your observations in a table.<br />
f<br />
g<br />
h<br />
Figure 2 An iron nail in contact with copper<br />
For nail A, there are two main colour changes to the ‘ferroxyl’<br />
indicator. Write half-equations for the reactions which have occurred<br />
at the surface of the nail to produce these colour changes.<br />
Compare the rate of corrosion of nail B with that of nail A. Explain<br />
your observations.<br />
Compare the rate of corrosion of nail C with that of nail A. What has<br />
formed on the surface of the zinc? Explain your observations.<br />
„ Salters Advanced Chemistry 2000 – see Copyright restrictions<br />
221
SS3.4<br />
HOW DOES STEEL RUST?<br />
Experiment 4<br />
7 Onto a piece of clean steel put a drop of ‘ferroxyl’ indicator solution, about<br />
2cm in diameter. Cover the steel with a large watch-glass resting on a ring of<br />
cottonwool which is kept damp with water. Observe and record what<br />
happens within the drop. (You will need to leave this undisturbed for at least<br />
half an hour.)<br />
i Explain your observations.<br />
Making sense of your results<br />
Collect together the observations and results of all four experiments. Each one<br />
provides some relevant information about the rusting process. On the basis of<br />
these write a summary explaining how you think rusting takes place.<br />
You should now be able to explain why steel is covered with a thin layer of<br />
zinc (galvanising) to protect it from rusting. The steel does not rust even when<br />
the zinc coating is scratched.<br />
j<br />
k<br />
ADDITIONAL QUESTIONS<br />
Find out why ‘ferroxyl’ indicator solution turns blue in the presence<br />
of Fe 2+ ions and pink in the presence of OH – ions.<br />
Suggest another metal which would behave in a way similar to<br />
zinc in protecting iron. Explain the reasons for your choice.<br />
l Why should copper rivets never be used to join together two pieces<br />
of iron?<br />
m Underwater steel pillars used to support piers are often found to<br />
corrode more severely when they are sunk beneath the sea bed<br />
than where they are in contact with sea water. Suggest a reason<br />
for this.<br />
222<br />
„ Salters Advanced Chemistry 2000 – see Copyright restrictions
SS3.5<br />
Understanding redox<br />
reactions<br />
This activity will help you to make sure that you have<br />
understood the ideas met in Activities SS3.1–SS3.4 and<br />
in Chemical Ideas 9.2.<br />
As you investigate redox reactions in detail, a number of terms are introduced to<br />
help describe exactly what is happening, and to develop a way of recording and<br />
using data.<br />
Go through the text of Chemical Ideas 9.2 and make a list of the words and<br />
terms introduced. You can spot these easily because they are in bold type.<br />
Write a sentence or two explaining what each term means. If you find that<br />
difficult, work with someone else, and try explaining to your partner what you<br />
think each term means. Then write down what you agree is a clear explanation.<br />
„ Salters Advanced Chemistry 2000 – see Copyright restrictions<br />
223
SS5.1<br />
Investigating the<br />
oxidation states of<br />
vanadium<br />
This activity illustrates two characteristic properties<br />
of transition metals: their abilities to form coloured<br />
compounds and to show a variety of oxidation states.<br />
You will use electrode potentials to help you interpret<br />
your results and to make predictions about redox<br />
reactions involving different oxidation states of<br />
vanadium. You can then compare your predictions<br />
with what you observe in practice.<br />
Requirements<br />
●<br />
100 cm 3 conical flask<br />
●<br />
●<br />
test-tubes (5) and rack<br />
25 cm 3 measuring cylinder<br />
ammonium vanadate(V)<br />
TOXIC<br />
IRRITANT<br />
●<br />
ammonium vanadate(V) (ammonium metavanadate,<br />
NH 4<br />
VO 3<br />
) (0.25 g)<br />
● sulphuric acid, 1.0 mol dm –3 (25 cm 3 )<br />
● concentrated sulphuric acid (5 cm 3 )<br />
concentrated sulphuric acid<br />
CORROSIVE<br />
●<br />
zinc powder (1–2 g) or a few pieces of granulated zinc<br />
●<br />
●<br />
cottonwool plug<br />
filter funnel and filter papers<br />
dilute sulphuric acid<br />
IRRITANT<br />
● potassium manganate(VII) solution, 0.02 mol dm –3<br />
(10 cm 3 )<br />
● iron(II) ammonium sulphate solution, 0.1 mol dm –3<br />
(2 cm 3 )<br />
sulphur dioxide solution<br />
HARMFUL<br />
● potassium iodide solution, 0.05 mol dm –3 (2 cm 3 )<br />
● sodium thiosulphate solution, 0.1 mol dm –3 (2 cm 3 )<br />
● solid sodium sulphite, Na 2<br />
SO 3<br />
(1 g)<br />
zinc powder<br />
FLAMMABLE<br />
●<br />
●<br />
●<br />
Bunsen burner<br />
access to fume cupboard<br />
protective gloves<br />
CARE Vanadium compounds are toxic. Avoid skin contact.<br />
CARE Eye protection and<br />
gloves must be worn.<br />
WEAR EYE<br />
PROTECTION<br />
WEAR<br />
PROTECTIVE<br />
GLOVES<br />
Background<br />
Ammonium vanadate(V), NH 4<br />
VO 3<br />
, dissolves in moderately concentrated acid to<br />
give a yellow solution. Under these conditions, the ion present in solution can<br />
be thought of as the dioxovanadium(V) ion VO 2 + (aq), but it actually polymerises<br />
to a more complicated species.<br />
VO 3 – (aq) + 2H + (aq) Æ VO 2 + (aq) + H 2<br />
O(l)<br />
First, you will investigate the reduction of an acidic solution of vanadium(V)<br />
using zinc powder (or granulated zinc) as the reducing agent. Colour changes<br />
will indicate the formation of lower oxidation states of vanadium.<br />
In the second part of the activity, you will investigate some changes between<br />
these oxidation states, using a variety of different oxidising and reducing agents.<br />
You can use the standard electrode potentials in Table 1 to help you to<br />
explain your observations. You will also use this table to make predictions about<br />
some of the redox reactions. But remember, you can only predict whether a<br />
redox reaction is energetically feasible or not. Electrode potentials tell us nothing<br />
about the rate of the reaction. Sometimes reactions which are feasible can take<br />
place very slowly – so slowly that in practice they may not take place at all.<br />
You can read about redox reactions and electrode potentials in Chemical<br />
Ideas 9.2 and about the use of electrode potentials in predicting the direction<br />
of redox reactions in Chemical Ideas 9.3.<br />
224<br />
„ Salters Advanced Chemistry 2000 – see Copyright restrictions
INVESTIGATING THE OXIDATION STATES OF VANADIUM<br />
SS5.1<br />
Half-reaction<br />
E!/V<br />
Zn 2+ (aq) + 2e – Æ Zn(s) –0.76<br />
Fe 2+ (aq) + 2e – Æ Fe(s) –0.44<br />
V 3+ (aq) + e – Æ V 2+ (aq) –0.26<br />
SO 2– 4<br />
(aq) + 4H + (aq) + 2e – Æ SO 2<br />
(aq) + 2H 2<br />
O(l) +0.17<br />
VO 2+ (aq) + 2H + (aq) + e – Æ V 3+ (aq) + H 2<br />
O(l) +0.34<br />
I 2<br />
(aq) + 2e – Æ 2I – (aq) +0.54<br />
S 2<br />
O 2– 6<br />
(aq) + 4H + (aq) + 2e – Æ 2SO 2<br />
(aq) + 2H 2<br />
O(l) +0.57<br />
Fe 3+ (aq) + e – Æ Fe 2+ (aq) +0.77<br />
VO + 2<br />
(aq) + 2H + (aq) + e – Æ VO 2+ (aq) + H 2<br />
O(l) +1.00<br />
MnO – 4<br />
(aq) + 8H + (aq) + 5e – Æ Mn 2+ (aq) + 4H 2<br />
O(l) +1.51<br />
Table 1 Standard electrode potentials at 298 K<br />
Step-by-step reduction of vanadium(V)<br />
1 First make up a solution of vanadium(V) as follows. Put about 0.25 g (one<br />
spatula load) of ammonium vanadate(V), NH 4<br />
VO 3<br />
(CARE Toxic. Avoid skin<br />
contact), into a conical flask and add about 25 cm 3 of 1.0 mol dm –3 sulphuric<br />
acid (CARE Irritant). Carefully add about 5 cm 3 of concentrated sulphuric<br />
acid (CARE Extremely corrosive. Avoid skin contact) and swirl the flask until<br />
you obtain a clear yellow solution.<br />
2 Pour about 2 cm 3 of this vanadium(V) solution into each of three test tubes<br />
and keep for later investigations.<br />
3 To the remaining solution in the conical flask, add a few pieces of granulated<br />
zinc (or a spatula load of zinc powder added a little at a time, with shaking).<br />
Plug the neck of the flask loosely with cottonwool to prevent the escape of<br />
acid spray. Gently swirl the flask until no further changes occur. (If you are<br />
using granulated zinc, heat the solution to speed up the reactions. Even with<br />
zinc powder, you may need to warm the flask gently to get the final colour<br />
change.)<br />
a<br />
b<br />
Describe what happens when the vanadium(V) solution reacts with<br />
zinc.<br />
Complete Table 2 to summarise the changes you have observed.<br />
(Note The first green colour you see is a mixture of the original<br />
vanadium(V) solution and vanadium(IV).)<br />
Ion<br />
+<br />
VO 2<br />
VO 2+ V 3+ V 2+<br />
name dioxovanadium(V) oxovanadium(IV) vanadium(III) vanadium(II)<br />
ion ion ion ion<br />
Oxidation state<br />
Colour<br />
c<br />
Use the electrode potentials in Table 1 to explain your observations.<br />
Table 2 Oxidation states of vanadium and their<br />
colours<br />
Oxidation of vanadium(II)<br />
4 When the solution from step 3 has become violet, filter about<br />
2cm 3 into a test-tube. Keep the remaining mixture in the flask.<br />
5 Add to the test tube, a little at a time, an excess of acidified potassium<br />
manganate(VII) solution, shaking after each addition, until no further change<br />
is observed.<br />
d<br />
Describe what happens. Are your results consistent with the electrode<br />
potentials in Table 1? Explain your answer.<br />
„ Salters Advanced Chemistry 2000 – see Copyright restrictions<br />
225
SS5.1<br />
INVESTIGATING THE OXIDATION STATES OF VANADIUM<br />
Other redox reactions<br />
Before you carry out each of the investigations in this section, first use the<br />
electrode potentials in Table 1 to predict what you think is likely to happen.<br />
Enter your predictions, and the colours you expect to see, in Table 3.<br />
6 To one of the tubes containing 2 cm 3 of vanadium(V) solution, add about<br />
2cm 3 of iron(II) ammonium sulphate solution and mix thoroughly. (Iron(II)<br />
ammonium sulphate is a source of Fe 2+ (aq) ions.) The predictions and<br />
observations for this reaction have been entered in the table for you as a<br />
guide.<br />
7 To the second tube containing 2 cm 3 of vanadium(V) solution, add about<br />
2cm 3 of potassium iodide solution and mix thoroughly. Then add about<br />
2cm 3 of sodium thiosulphate solution. (Thiosulphate ions reduce iodine to<br />
colourless iodide ions.)<br />
8 To the third tube containing 2 cm 3 of vanadium(V) solution, add a little solid<br />
sodium sulphite, Na 2<br />
SO 3<br />
. (Sodium sulphite reacts with acid to produce a<br />
solution of sulphur dioxide, SO 2<br />
(CARE Harmful).) Filter the mixture if<br />
cloudy and carefully boil the solution in a fume cupboard to remove the<br />
excess SO 2<br />
. Then add an equal volume of the violet vanadium(II) solution.<br />
e<br />
Complete the results table (Table 3) for these three investigations.<br />
Interpret your observations carefully. For example, mixing blue and<br />
yellow solutions will give a green solution even if there is no chemical<br />
reaction at all.<br />
Substances mixed Predicted products Predicted Observation Summary of reaction<br />
colour<br />
(+5) (+4)<br />
6 VO + 2<br />
(aq) + Fe 2+ (aq) VO 2+ (aq) and Fe 3+ (aq) green green VO + 2<br />
(aq) Æ VO 2+ (aq)<br />
blue yellow solution as<br />
predicted Fe 2+ (aq) Æ Fe 3+ (aq)<br />
7 VO 2 + (aq) + I – (aq)<br />
Then add<br />
thiosulphate<br />
8 VO 2 + (aq) + SO 2<br />
(aq)<br />
Then add<br />
vanadium(II)<br />
Table 3 Results table<br />
226<br />
„ Salters Advanced Chemistry 2000 – see Copyright restrictions
SS5.2<br />
How do transition metal<br />
ions act as catalysts?<br />
In this activity you will investigate the catalytic<br />
activity of aqueous cobalt(II) ions in the reaction<br />
between hydrogen peroxide and 2,3-dihydroxybutanedioate<br />
ions. You will then use your<br />
observations to suggest a possible reaction pathway.<br />
Requirements<br />
● potassium sodium 2,3-dihydroxybutanedioate<br />
(potassium sodium tartrate or Rochelle salt) (2.5 g)<br />
● 250 cm 3 beaker<br />
● 25 cm 3 measuring cylinder<br />
● Bunsen burner, tripod and gauze<br />
● 0–110 °C thermometer<br />
● hydrogen peroxide solution, 20 vol (20 cm 3 )<br />
● 100 cm 3 beaker<br />
● cobalt(II) chloride, CoCl 2<br />
.6H 2<br />
O (0.25 g)<br />
● test-tubes (2) and rack<br />
● ice bath<br />
cobalt(II) chloride<br />
hydrogen peroxide solution<br />
CARE Eye protection<br />
must be worn.<br />
HARMFUL<br />
IRRITANT<br />
WEAR EYE<br />
PROTECTION<br />
Background<br />
Hydrogen peroxide can oxidise 2,3-dihydroxybutanedioate ions to carbon<br />
dioxide, methanoate ions and water:<br />
H<br />
HO<br />
HO<br />
C<br />
C<br />
COO –<br />
COO –<br />
+<br />
3H 2 O 2 2CO 2 + 2HCOO – + 4H 2 O<br />
H<br />
The reaction is energetically feasible, but takes place very slowly, even when<br />
heated. The problem is the high activation enthalpy which provides a kinetic<br />
barrier to reaction.<br />
The reaction can be speeded up by adding cobalt(II) ions.<br />
What you do<br />
1 Dissolve about 2.5 g of potassium sodium 2,3-dihydroxybutanedioate in<br />
50 cm 3 of water in a 250 cm 3 beaker. Heat the solution to about 70°C.<br />
2 Heat 20 cm 3 of hydrogen peroxide solution (CARE Irritant) to approximately<br />
the same temperature in a 100 cm 3 beaker, and add to the warm solution of<br />
2,3-dihydroxybutanedioate ions from step 1.<br />
3 Remove the beaker from the heat and stand it on a mat. Monitor the<br />
temperature of the solution for a few minutes and note any changes in<br />
appearance.<br />
4 Dissolve about 0.25 g of cobalt(II) chloride (CARE Harmful. Avoid skin<br />
contact) in about 5 cm 3 of distilled water in a test-tube and add this to the<br />
hot solution. Keep the thermometer in the reaction mixture to monitor the<br />
temperature, but do not stir. Stand back until a reaction takes place –<br />
there will be a short delay before anything happens. Note any changes.<br />
5 Repeat the reaction in steps 1–4, but when the solution becomes dark green<br />
quickly transfer about 5 cm 3 to a test-tube which has been immersed in an<br />
ice bath. Replace the tube in the ice bath. After a while allow the mixture to<br />
warm to room temperature.<br />
6 Write a brief summary of the reactions you have carried out and what you<br />
have observed.<br />
„ Salters Advanced Chemistry 2000 – see Copyright restrictions<br />
227
SS5.2<br />
HOW DO TRANSITION METAL IONS ACT AS CATALYSTS?<br />
QUESTIONS<br />
a Describe what happened when you mixed the hydrogen peroxide<br />
solution and the solution of 2,3-dihydroxybutanedioate ions.<br />
b What colour is the aqueous cobalt(II) ion, [Co(H 2<br />
O) 6<br />
] 2+ (aq)?<br />
c Cobalt(III) ions are not stable in aqueous solution. (They are<br />
reduced by water to cobalt(II) ions.) They can be stabilised in<br />
aqueous solution by adding certain ions or molecules, such as<br />
carboxylate ions, which complex with the cobalt.<br />
Suggest a substance which might be responsible for the dark<br />
green colour observed during the reaction.<br />
d Suggest how the substance responsible for the green colour might<br />
have been formed. (There is no need to give any equations.)<br />
e Suggest why the dark green solution eventually returns to its original<br />
pink colour.<br />
f Why does cooling the test-tube preserve the green colour for a<br />
while?<br />
g Suggest a possible mechanism for the catalysed hydrogen peroxide<br />
oxidation of 2,3-dihydroxybutanedioate ions by cobalt(II) ions.<br />
(There is no need to give any equations.)<br />
h Are the cobalt ions behaving as a homogeneous or a hetereogeneous<br />
catalyst? Explain your answer.<br />
i What two properties of cobalt ions are important to their ability to<br />
catalyse this reaction?<br />
j Draw enthalpy profile diagrams (on the same axes) for the catalysed<br />
and uncatalysed reactions.<br />
k In two sentences, summarise the role of a catalyst in a reaction.<br />
228<br />
„ Salters Advanced Chemistry 2000 – see Copyright restrictions
SS5.3<br />
Looking at some<br />
transition metal<br />
complexes<br />
Requirements<br />
● rack with 5 test-tubes and boiling tube<br />
● nickel(II) chloride, NiCl 2<br />
.6H 2<br />
O (1 g)<br />
● concentrated hydrochloric acid (2 cm 3 )<br />
● sodium hydroxide solution, 2.0 mol dm –3 (20 cm 3 )<br />
● concentrated ammonia solution (5 cm 3 )<br />
● disodium salt of H 4<br />
edta (Na 2<br />
H 2<br />
edta), 0.1 mol dm –3<br />
(5 cm 3 )<br />
● copper(II) sulphate solution, 1 mol dm –3 (4 cm 3 )<br />
● ammonia solution, 2 mol dm –3 (20 cm 3 )<br />
● iron(II) sulphate solution, 1 mol dm –3 (4 cm 3 )<br />
● iron(III) chloride solution, 1 mol dm –3 (4 cm 3 )<br />
● access to fume cupboard<br />
This Transition activity metals is designed form to a wide help you variety to understand of complexes, the<br />
important many of which steps are in the highly production coloured. of bromide In the first part of<br />
this activity, you will make some complexes of nickel<br />
and investigate their relative stability. You will then<br />
look at complexes of other transition metal ions and<br />
compare the reactions of copper(II), iron(II) and<br />
iron(III) ions with sodium hydroxide and ammonia.<br />
concentrated ammonia solution<br />
dilute ammonia solution<br />
copper(II) sulphate solution<br />
concentrated hydrochloric acid<br />
CORROSIVE<br />
IRRITANT<br />
HARMFUL<br />
CORROSIVE<br />
iron(III) chloride solution<br />
IRRITANT<br />
nickel(II) chloride<br />
HARMFUL<br />
sodium hydroxide solution<br />
CORROSIVE<br />
CARE Eye protection<br />
must be worn.<br />
WEAR EYE<br />
PROTECTION<br />
Introduction<br />
When you add a substance which can act as a ligand to a solution containing<br />
complex ions, the new ligands will compete with the existing ligands for the<br />
metal ion and a new complex may be formed. Reactions like these, in which one<br />
ligand is replaced by another, are called ligand exchange reactions.<br />
Ligand exchange reactions are easy to observe because a change of ligand<br />
usually results in a change of colour. If one ligand complexes with the metal ion<br />
much more strongly than the other, the position of equilibrium will be in favour<br />
of the more stable complex, and the reaction will appear to go to completion in<br />
that direction.<br />
The stability of a complex can be expressed in terms of the equilibrium<br />
constant for the overall ligand displacement reaction. This is known as the<br />
stability constant, K stab<br />
. The higher the value of the stability constant, the<br />
more stable the complex.<br />
Stability constants can be used to compare the stability of any two complexes,<br />
but the values usually quoted give the stability of a complex relative to the<br />
simple aqueous ions, where water is the ligand.<br />
You can read about ligand displacement reactions and stability constants in<br />
Chemical Ideas 11.6.<br />
„ Salters Advanced Chemistry 2000 – see Copyright restrictions<br />
229
SS5.3<br />
LOOKING AT SOME TRANSITION METAL COMPLEXES<br />
Part 1: Some complexes of nickel(II) ions<br />
Carry out the following reactions in order in the same boiling tube. After each<br />
step, transfer a small quantity of the mixture to one of the test-tubes to keep for<br />
comparison.<br />
1 To a few crystals of solid nickel(II) chloride (CARE Harmful) in a boiling<br />
tube, add about 2 cm 3 of concentrated hydrochloric acid (CARE Corrosive)<br />
and shake gently until the crystals dissolve.<br />
a<br />
A complex ion is formed with the formula [NiCl 4<br />
] 2– (aq). What is the<br />
colour of this complex and what ligand does it contain? What is the<br />
coordination number of the complex?<br />
2 Now add an equal volume of water to the boiling tube.<br />
b<br />
c<br />
What is the colour of the solution now? What ligand is present in the<br />
new complex ion? This ion has a coordination number of 6. Write the<br />
formula of the ion.<br />
Write an equation with state symbols for the reaction you observed in<br />
step 2.<br />
3 Add sodium hydroxide solution (CARE Corrosive) drop by drop to the<br />
solution in the boiling tube until a precipitate just forms.<br />
d<br />
Give the name and formula of the precipitate and write an equation<br />
with state symbols for the reaction you have observed.<br />
4 Now, using a fume cupboard, carefully add concentrated ammonia solution<br />
(CARE Irritant. Gives off irritating vapours) to the precipitate in the boiling<br />
tube. Continue adding until you have a solution again.<br />
e<br />
What is the colour of the solution? What ligand is now present? The<br />
new complex ion formed has a coordination number of 6. Write the<br />
formula of the ion and an equation with state symbols for the reaction.<br />
5 Finally, add a solution of the disodium salt of H 4<br />
edta (Na 2<br />
H 2<br />
edta) to the<br />
mixture in the boiling tube.<br />
f<br />
H 4<br />
edta contains four carboxylic acid groups, –COOH, as well as two<br />
amino groups. In alkaline solution, it forms the edta 4– ion. (Edta is an<br />
abbreviation of its old name.)<br />
Edta 4– is an unusual ligand because it can form six bonds with the<br />
central metal ion. It wraps itself around the nickel ion enclosing it in a<br />
cage-like structure. The complex with nickel has the formula<br />
[Ni edta] 2– . What is the colour of this complex? Write an equation<br />
with state symbols for the reaction you have observed.<br />
6 Summarise your results by filling in a copy of Table 1.<br />
Procedure Observations Formula of nickel complex (or<br />
nickel compound) formed<br />
1 Addition of concentrated hydrochloric<br />
acid to solid nickel(II) chloride<br />
2 Addition of an equal volume of water<br />
3 Addition of sodium hydroxide solution<br />
drop by drop until precipitate just forms<br />
4 Addition of concentrated ammonia<br />
solution<br />
5 Addition of edta 4– ions<br />
g<br />
Are your results in reactions 4 and 5 consistent with the following<br />
overall stability constants for nickel complexes?<br />
ligand<br />
lg K stab<br />
NH 3<br />
8.6<br />
edta 4– 19.3<br />
Table 1 Results table<br />
230<br />
h<br />
For the complex [Ni(CN) 4<br />
] 2– , lg K stab<br />
= 31. What would be the effect<br />
of adding edta 4– ions to a solution of [Ni(CN) 4<br />
] 2– ions in water?<br />
„ Salters Advanced Chemistry 2000 – see Copyright restrictions
LOOKING AT SOME TRANSITION METAL COMPLEXES<br />
SS5.3<br />
Part 2: Precipitation reactions of copper(II),<br />
iron(II) and iron(III) ions<br />
7 Add about 2 cm 3 of copper(II) sulphate solution (CARE Harmful) to a boiling<br />
tube.<br />
i<br />
The characteristic blue colour is that of a complex ion with<br />
coordination number 6. What is the ligand and what is the formula<br />
of the ion?<br />
8 Add about 1 cm 3 of sodium hydroxide solution to the solution in the tube,<br />
shake the tube and note the colour of the precipitate formed.<br />
j<br />
Give the name and formula of the precipitate and write an ionic<br />
equation, with appropriate state symbols, for the reaction you have<br />
observed.<br />
9 Now, using a fume cupboard, carefully add concentrated ammonia solution<br />
to the precipitate in the boiling tube. Continue adding, with shaking, until<br />
you have a solution again.<br />
k<br />
What is the colour of the solution? Four of the water ligands have<br />
been replaced by ammonia ligands. What is the formula of the new<br />
complex ion?<br />
A dilute solution of ammonia is a weak base and so can act as a source of<br />
OH – (aq) ions as well as NH 3<br />
ligands:<br />
l<br />
NH 3<br />
(aq) + H 2<br />
O(l) D NH 4 + (aq) + OH – (aq)<br />
Predict what you would observe if you slowly add a dilute solution of<br />
ammonia to a solution of copper(II) sulphate until the ammonia is in<br />
excess.<br />
10 Test your prediction by slowly adding dilute ammonia solution to about<br />
2cm 3 of copper(II) sulphate solution in a boiling tube.<br />
11 Construct a table similar to Table 2 and use it to summarise your results for<br />
copper(II) ions.<br />
12 Then carry out the necessary tests to enable you to complete your table for<br />
iron(II) ions and iron(III) ions. Use iron(II) sulphate solution as a source of<br />
iron(II) ions and iron(III) chloride (CARE Irritant) as a source of iron(III) ions.<br />
Transition metal ion<br />
copper(II)<br />
Observations:<br />
when dilute sodium when dilute ammonia<br />
hydroxide solution solution is added slowly<br />
is added<br />
iron(II)<br />
iron(III)<br />
Table 2 Results table<br />
m Write ionic equations, with state symbols, which could explain your<br />
observations for the iron(II) and iron(III) tests.<br />
„ Salters Advanced Chemistry 2000 – see Copyright restrictions<br />
231
SS6<br />
Check your notes on<br />
The Steel Story<br />
This activity helps you get your notes in order at the<br />
end of this unit.<br />
Use this list as the basis of a summary of the unit by<br />
collecting together the related points and arranging them in<br />
groups. Check that your notes cover the points and are<br />
organised in appropriate ways. Remember that you will be<br />
coming back to some of the ideas in later units.<br />
Most of the points are covered in the Chemical Ideas,<br />
with supporting information in the Storyline or Activities.<br />
However, if the main source of information is the Storyline<br />
or an Activity, this is indicated.<br />
●<br />
●<br />
●<br />
●<br />
●<br />
●<br />
●<br />
●<br />
●<br />
The range of types, properties and uses of steel<br />
(Storyline SS1 and SS2).<br />
The importance of the composition of a steel in<br />
determining its properties (Activity SS2.5).<br />
Redox processes that occur during steelmaking (including<br />
removal of sulphur and the reactions during the oxygen<br />
blow) (Storyline SS2; Activities SS2.2–2.4).<br />
How some substances appear coloured because they<br />
absorb radiation in specific parts of the visible spectrum.<br />
The use of colorimetric measurements to determine the<br />
concentration of a coloured solution (Activity SS1.1).<br />
The procedure for carrying out a simple redox titration<br />
involving manganate(VII) ions and how to work out the<br />
results (Activity SS1.2).<br />
Transition metals are d-block elements that form one or<br />
more stable ions with incompletely filled d orbitals.<br />
Typical properties of transition metals in the first row of<br />
the d block with particular reference to iron and copper:<br />
existence of more than one oxidation state for each<br />
element in its compounds, formation of coloured ions in<br />
solution, reactions with ligands to form complexes and<br />
reactions involving ligand substitution, catalytic behaviour<br />
of the elements and their compounds.<br />
The reactions of Fe 2+ (aq), Fe 3+ (aq) and Cu 2+ (aq) ions<br />
with sodium hydroxide solution and ammonia solution<br />
(Activity SS5.3).<br />
●<br />
●<br />
●<br />
●<br />
●<br />
The variable oxidation states of transition metals in terms<br />
of electronic energy levels.<br />
The catalytic activity of transition metals and their<br />
compounds in terms of variable oxidation states (Activity<br />
SS5.2).<br />
The meaning of the terms: ligand, complex/complex ion<br />
and ligand exchange.<br />
The formation of complexes in terms of bonding between<br />
ligands and central metal ion.<br />
The meaning of the term polydentate as applied to<br />
ligands, exemplified by edta 4– .<br />
● The shapes of complexes with coordination numbers 4<br />
and 6.<br />
●<br />
●<br />
●<br />
●<br />
●<br />
Ligand exchange reactions and stability constants.<br />
Redox reactions of d-block elements in terms of electron<br />
transfer, and represented by (i) using half-equations for the<br />
oxidation and reduction reactions and (ii) combining halfequations<br />
to give the overall equation for the reaction.<br />
The construction of simple electrochemical cells involving<br />
metal ion/metal half-cells, and half-cells based on different<br />
oxidation states of the same element in aqueous solution.<br />
The meaning and use of the term: standard electrode<br />
potential; how a standard electrode potential is measured.<br />
The action of an electrochemical cell in terms of halfequations<br />
and external electron flow.<br />
● The use of standard electrode potentials to calculate E cell<br />
,<br />
and to predict the feasibility of redox reactions and the<br />
relative stability of oxidation states.<br />
●<br />
●<br />
●<br />
Rusting in terms of electrochemical processes involving<br />
iron and oxygen and subsequent reactions (Storyline<br />
SS3; Activity SS3.4).<br />
Approaches to corrosion prevention (Storyline SS3).<br />
Issues in the recycling of iron (Storyline SS4).<br />
SS<br />
© Harcourt Education Ltd 2004 Salters Advanced Chemistry<br />
These pages have been downloaded from www.heinemann.co.uk/science<br />
3

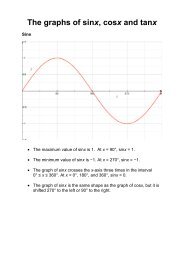
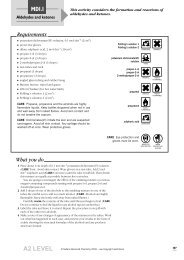
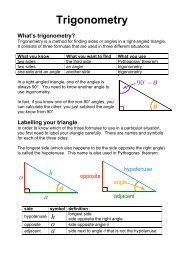
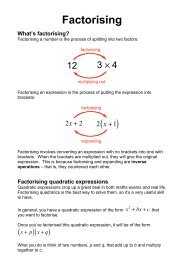
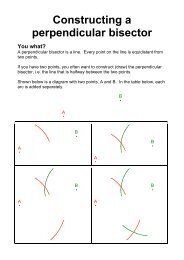


![ISI Web of Knowledge [v.4.10] - All Databases Results - Benjamin-Mills](https://img.yumpu.com/39253071/1/184x260/isi-web-of-knowledge-v410-all-databases-results-benjamin-mills.jpg?quality=85)