

Module 3 - Benjamin-Mills
Module 3 - Benjamin-Mills
Module 3 - Benjamin-Mills

Create successful ePaper yourself
Turn your PDF publications into a flip-book with our unique Google optimized e-Paper software.
SS2.2<br />
WHAT CHANGES OCCUR DURING STEELMAKING?<br />
Changes in temperature<br />
4 Using the information in Table 1, plot a graph to illustrate how the<br />
temperature of the metal changes during the BOS process.<br />
5 Draw a dotted line across your graph to show the target tapping<br />
temperature. (This is the ideal temperature for steel leaving the converter at<br />
the end of the oxygen blow.)<br />
b The freezing point of pure iron is 1539°C yet the metal arriving from<br />
the blast furnace is molten at a temperature of 1333°C. Why has it<br />
not solidified?<br />
c Write a short explanation of the changes in temperature shown by<br />
your graph.<br />
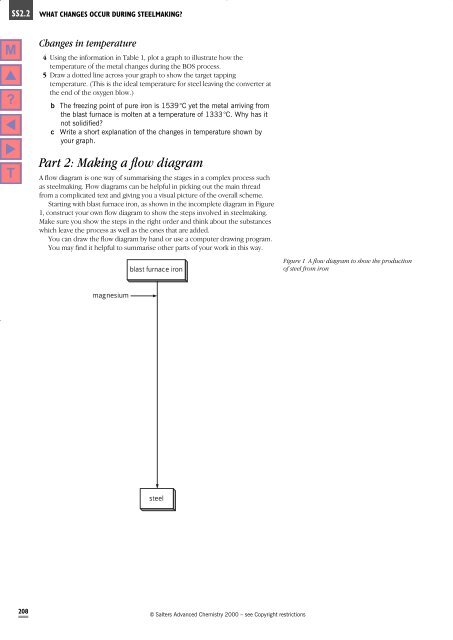
Part 2: Making a flow diagram<br />
A flow diagram is one way of summarising the stages in a complex process such<br />
as steelmaking. Flow diagrams can be helpful in picking out the main thread<br />
from a complicated text and giving you a visual picture of the overall scheme.<br />
Starting with blast furnace iron, as shown in the incomplete diagram in Figure<br />
1, construct your own flow diagram to show the steps involved in steelmaking.<br />
Make sure you show the steps in the right order and think about the substances<br />
which leave the process as well as the ones that are added.<br />
You can draw the flow diagram by hand or use a computer drawing program.<br />
You may find it helpful to summarise other parts of your work in this way.<br />
blast furnace iron<br />
Figure 1 A flow diagram to show the production<br />
of steel from iron<br />
magnesium<br />
steel<br />
208<br />
„ Salters Advanced Chemistry 2000 – see Copyright restrictions


![ISI Web of Knowledge [v.4.10] - All Databases Results - Benjamin-Mills](https://img.yumpu.com/39253071/1/184x260/isi-web-of-knowledge-v410-all-databases-results-benjamin-mills.jpg?quality=85)