


Module 3 - Benjamin-Mills
Module 3 - Benjamin-Mills
Module 3 - Benjamin-Mills

You also want an ePaper? Increase the reach of your titles
YUMPU automatically turns print PDFs into web optimized ePapers that Google loves.
EP6.3<br />
The effect of enzyme<br />
and substrate<br />
concentrations on the<br />
rate of a reaction<br />
In this activity you will follow the progress of a<br />
catalysed reaction by measuring the volume of gas<br />
produced as the reaction proceeds. You will use the<br />
initial rates of a series of experiments to find the<br />
orders of the reaction with respect to enzyme and<br />
substrate.<br />
Requirements<br />
● burette (50 cm 3 )<br />
● trough or bowl<br />
● boiling tube with bung and delivery tube<br />
● graduated pipette (5 cm 3 ) and safety filler<br />
● measuring cylinder (10 cm 3 )<br />
● hydrogen peroxide solution, 5 vol (25 cm 3 )<br />
● yeast suspension (20 cm 3 ), made from 2 g dried yeast in<br />
160 cm 3 water aerated for several hours<br />
● stopwatch<br />
CARE Eye protection<br />
must be worn.<br />
WEAR EYE<br />
PROTECTION<br />
Introduction<br />
In this activity, the substrate is hydrogen peroxide (H 2<br />
O 2<br />
) and the enzyme is<br />
catalase. You will use yeast as a source of catalase.<br />
Hydrogen peroxide is formed as a waste product of metabolism by many<br />
organisms. It is toxic and must be rapidly removed from the cells. The enzyme<br />
catalase catalyses the decomposition of hydrogen peroxide to produce water<br />
and oxygen.<br />
2H 2<br />
O 2<br />
(aq) Æ 2H 2<br />
O(l) + O 2<br />
(g)<br />
The reaction can be monitored by measuring the volume of oxygen produced as<br />
the reaction proceeds, and plotting a graph of the volume of oxygen produced<br />
against time. You can find the rate of the reaction (in terms of the volume of<br />
oxygen produced per second) at any time by measuring the gradient of the<br />
curve.<br />
You may like to practise your IT skills and make use of graph-plotting<br />
computer software to plot your results. It is usually best, however, to draw the<br />
best-fitting line or curve by hand.<br />
It is important when investigating rates of reaction to vary one factor at a<br />
time. All other factors which could affect the rate should be kept constant.<br />
What you do<br />
It will be best to work in groups. One group should tackle Part 1 while another<br />
group does Part 2. Combine your results at the end.<br />
Take the opportunity to use a spreadsheet to collect your data. The graphplotting<br />
function will help you to find the initial rate of each reaction.<br />
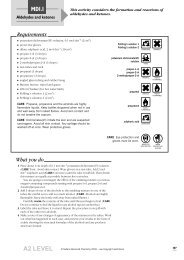
inverted<br />
burette<br />
Part 1: Varying the concentration of hydrogen peroxide<br />
1 Fill a burette with water and invert it in a trough of water. Hold it in place with<br />
a clamp and check that the burette is leak-proof. Make sure you leave enough<br />
room in the trough for water which will be displaced from the burette.<br />
2 Place 2.5 cm 3 of well-stirred yeast suspension in a boiling tube and set up<br />
the apparatus in Figure 1. Carefully open the tap on the burette until<br />
the meniscus falls to the 50 cm 3 mark (i.e. zero for this experiment as the<br />
burette is upside down).<br />
3 Measure out 5 cm 3 of hydrogen peroxide in a 10 cm 3 measuring cylinder.<br />
Organise yourselves for taking and recording readings of volume at<br />
10-second intervals for 4 minutes.<br />
yeast suspension +<br />
hydrogen peroxide<br />
solution<br />
Figure 1 Measuring the volume of oxygen<br />
produced<br />
water<br />
„ Salters Advanced Chemistry 2000 – see Copyright restrictions<br />
189


![ISI Web of Knowledge [v.4.10] - All Databases Results - Benjamin-Mills](https://img.yumpu.com/39253071/1/184x260/isi-web-of-knowledge-v410-all-databases-results-benjamin-mills.jpg?quality=85)