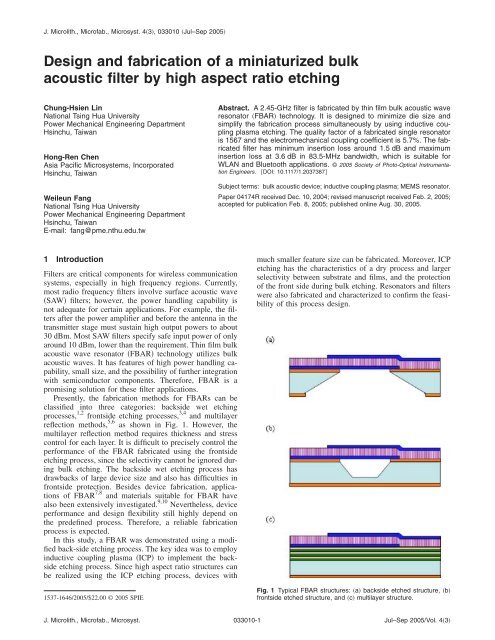
Design and fabrication of a miniaturized bulk acoustic filter by high ...
Design and fabrication of a miniaturized bulk acoustic filter by high ...
Design and fabrication of a miniaturized bulk acoustic filter by high ...

Create successful ePaper yourself
Turn your PDF publications into a flip-book with our unique Google optimized e-Paper software.
J. Microlith., Micr<strong>of</strong>ab., Microsyst. 43, 033010 Jul–Sep 2005<br />
<strong>Design</strong> <strong>and</strong> <strong>fabrication</strong> <strong>of</strong> a <strong>miniaturized</strong> <strong>bulk</strong><br />
<strong>acoustic</strong> <strong>filter</strong> <strong>by</strong> <strong>high</strong> aspect ratio etching<br />
Chung-Hsien Lin<br />
National Tsing Hua University<br />
Power Mechanical Engineering Department<br />
Hsinchu, Taiwan<br />
Hong-Ren Chen<br />
Asia Pacific Microsystems, Incorporated<br />
Hsinchu, Taiwan<br />
Weileun Fang<br />
National Tsing Hua University<br />
Power Mechanical Engineering Department<br />
Hsinchu, Taiwan<br />
E-mail: fang@pme.nthu.edu.tw<br />
Abstract. A 2.45-GHz <strong>filter</strong> is fabricated <strong>by</strong> thin film <strong>bulk</strong> <strong>acoustic</strong> wave<br />
resonator FBAR technology. It is designed to minimize die size <strong>and</strong><br />
simplify the <strong>fabrication</strong> process simultaneously <strong>by</strong> using inductive coupling<br />
plasma etching. The quality factor <strong>of</strong> a fabricated single resonator<br />
is 1567 <strong>and</strong> the electromechanical coupling coefficient is 5.7%. The fabricated<br />
<strong>filter</strong> has minimum insertion loss around 1.5 dB <strong>and</strong> maximum<br />
insertion loss at 3.6 dB in 83.5-MHz b<strong>and</strong>width, which is suitable for<br />
WLAN <strong>and</strong> Bluetooth applications. © 2005 Society <strong>of</strong> Photo-Optical Instrumentation<br />
Engineers. DOI: 10.1117/1.2037387<br />
Subject terms: <strong>bulk</strong> <strong>acoustic</strong> device; inductive coupling plasma; MEMS resonator.<br />
Paper 04174R received Dec. 10, 2004; revised manuscript received Feb. 2, 2005;<br />
accepted for publication Feb. 8, 2005; published online Aug. 30, 2005.<br />
1 Introduction<br />
Filters are critical components for wireless communication<br />
systems, especially in <strong>high</strong> frequency regions. Currently,<br />
most radio frequency <strong>filter</strong>s involve surface <strong>acoustic</strong> wave<br />
SAW <strong>filter</strong>s; however, the power h<strong>and</strong>ling capability is<br />
not adequate for certain applications. For example, the <strong>filter</strong>s<br />
after the power amplifier <strong>and</strong> before the antenna in the<br />
transmitter stage must sustain <strong>high</strong> output powers to about<br />
30 dBm. Most SAW <strong>filter</strong>s specify safe input power <strong>of</strong> only<br />
around 10 dBm, lower than the requirement. Thin film <strong>bulk</strong><br />
<strong>acoustic</strong> wave resonator FBAR technology utilizes <strong>bulk</strong><br />
<strong>acoustic</strong> waves. It has features <strong>of</strong> <strong>high</strong> power h<strong>and</strong>ling capability,<br />
small size, <strong>and</strong> the possibility <strong>of</strong> further integration<br />
with semiconductor components. Therefore, FBAR is a<br />
promising solution for these <strong>filter</strong> applications.<br />
Presently, the <strong>fabrication</strong> methods for FBARs can be<br />
classified into three categories: backside wet etching<br />
processes, 1,2 frontside etching processes, 3,4 <strong>and</strong> multilayer<br />
reflection methods, 5,6 as shown in Fig. 1. However, the<br />
multilayer reflection method requires thickness <strong>and</strong> stress<br />
control for each layer. It is difficult to precisely control the<br />
performance <strong>of</strong> the FBAR fabricated using the frontside<br />
etching process, since the selectivity cannot be ignored during<br />
<strong>bulk</strong> etching. The backside wet etching process has<br />
drawbacks <strong>of</strong> large device size <strong>and</strong> also has difficulties in<br />
frontside protection. Besides device <strong>fabrication</strong>, applications<br />
<strong>of</strong> FBAR 7,8 <strong>and</strong> materials suitable for FBAR have<br />
also been extensively investigated. 9,10 Nevertheless, device<br />
performance <strong>and</strong> design flexibility still <strong>high</strong>ly depend on<br />
the predefined process. Therefore, a reliable <strong>fabrication</strong><br />
process is expected.<br />
In this study, a FBAR was demonstrated using a modified<br />
back-side etching process. The key idea was to employ<br />
inductive coupling plasma ICP to implement the backside<br />
etching process. Since <strong>high</strong> aspect ratio structures can<br />
be realized using the ICP etching process, devices with<br />
1537-1646/2005/$22.00 © 2005 SPIE<br />
much smaller feature size can be fabricated. Moreover, ICP<br />
etching has the characteristics <strong>of</strong> a dry process <strong>and</strong> larger<br />
selectivity between substrate <strong>and</strong> films, <strong>and</strong> the protection<br />
<strong>of</strong> the front side during <strong>bulk</strong> etching. Resonators <strong>and</strong> <strong>filter</strong>s<br />
were also fabricated <strong>and</strong> characterized to confirm the feasibility<br />
<strong>of</strong> this process design.<br />
Fig. 1 Typical FBAR structures: a backside etched structure, b<br />
frontside etched structure, <strong>and</strong> c multilayer structure.<br />
J. Microlith., Micr<strong>of</strong>ab., Microsyst. 033010-1<br />
Jul–Sep 2005/Vol. 43
Lin, Chen, <strong>and</strong> Fang: <strong>Design</strong> <strong>and</strong> <strong>fabrication</strong> <strong>of</strong> a <strong>miniaturized</strong> …<br />
Fig. 2 Simulation schematic <strong>of</strong> a <strong>bulk</strong> <strong>acoustic</strong> resonator.<br />
2 <strong>Design</strong> <strong>and</strong> Analysis<br />
Thin film <strong>bulk</strong> <strong>acoustic</strong> resonators operate like quartz resonators,<br />
except that they are fabricated <strong>by</strong> thin film technology.<br />
Since the device geometry can be made extremely<br />
small, their operation frequency is much <strong>high</strong>er than that <strong>of</strong><br />
quartz resonators. As shown in Fig. 1a, a typical FBAR is<br />
a stacked structure consisting <strong>of</strong> a piezoelectric layer <strong>and</strong><br />
two electrode layers. In addition, this stacked structure is<br />
suspended so that both the top <strong>and</strong> bottom surface are free<br />
to deform in out-<strong>of</strong> surface directions. The piezoelectric<br />
layer is used to generate longitudinal <strong>acoustic</strong> waves along<br />
the thickness direction. Since longitudinal <strong>acoustic</strong> waves<br />
perfectly reflect at free surfaces, e.g., a solid-air interface,<br />
st<strong>and</strong>ing waves can be created in the FBAR structure at<br />
desired frequencies. The piezoelectric film then transfers<br />
energy from <strong>acoustic</strong> st<strong>and</strong>ing waves to electrical resonance.<br />
An accurate model is required to simulate the complex<br />
behavior <strong>of</strong> FBAR. In this work, an <strong>acoustic</strong> transmission<br />
line model was used. 11 This model treats all <strong>acoustic</strong> layer<br />
segments as microwave transmission lines using the forcevoltage<br />
analogy. In addition, a conventional Mason equivalent<br />
circuit model was used for the modeling <strong>of</strong> piezoelectric<br />
materials. This model comprised two <strong>acoustic</strong> ports <strong>and</strong><br />
one electrical port, 11 as shown in Fig. 2. The <strong>acoustic</strong> ports<br />
were connected to <strong>acoustic</strong> transmission lines to model<br />
propagations <strong>of</strong> <strong>acoustic</strong> wave in a multilayered structure.<br />
The electrical port could pass voltage <strong>and</strong> current information<br />
to near<strong>by</strong> electrical circuits. By connecting Mason’s<br />
equivalent circuit model <strong>and</strong> <strong>acoustic</strong> transmission line<br />
models in a series, frequency response <strong>of</strong> the stacked structure<br />
was simulated. The simulated resonance frequency <strong>of</strong><br />
the proposed FBAR is around 2.4 GHz. Moreover, from the<br />
series resonance frequency f s <strong>and</strong> parallel resonance frequency<br />
f p , the electromechanical coupling coefficient K 2 <br />
was expressed as, 12<br />
<br />
K 2 2<br />
=<br />
tan 2<br />
f s<br />
f p<br />
f s<br />
f p .<br />
1<br />
Fig. 3 Simulation result <strong>of</strong> effective electromechanical coupling coefficient<br />
at different piezoelectric layers to top electrode thickness<br />
ratio.<br />
A good resonator for <strong>filter</strong> application should have a wide<br />
separation between f s <strong>and</strong> f p , which represents a <strong>high</strong> electromechanical<br />
coupling coefficient K 2 . Higher K 2 facilitates<br />
wide b<strong>and</strong> <strong>filter</strong> design <strong>and</strong> <strong>fabrication</strong>.<br />
The relationship between resonance frequency, electromechanical<br />
coupling coefficient K 2 , <strong>and</strong> structure thickness<br />
was predicted using the aforementioned simulation<br />
model. The FBAR can be designed to operate at various<br />
resonance frequencies <strong>and</strong> electromechanical coupling coefficients<br />
for different combinations <strong>of</strong> piezoelectric layer,<br />
top electrode, <strong>and</strong> bottom electrode thicknesses. In this<br />
study, the thickness <strong>of</strong> the bottom electrode was fixed, <strong>and</strong><br />
the effective electromechanical coupling coefficient K 2 was<br />
tuned <strong>by</strong> varying the thickness ratio <strong>of</strong> the piezoelectric<br />
layer to the top electrode layer. In general, to increase the<br />
coupling coefficient K 2 at a particular resonance frequency,<br />
the thickness ratio TR <strong>of</strong> a piezoelectric layer to the top<br />
electrode layer needs to be increased. Figure 3 shows typical<br />
simulation results <strong>of</strong> effective electromechanical coupling<br />
coefficients at different TRs <strong>of</strong> piezoelectric layers to<br />
top electrode layers. The simulation employed AlN as the<br />
piezoelectric layer, Ti-Pt as the bottom electrode layer, <strong>and</strong><br />
Al as the top electrode layer. According to the simulation<br />
results in Fig. 3, the FBAR could achieve a better electromechanical<br />
coupling coefficient if the thickness ratio is<br />
greater than 5. However, the electrode thickness could not<br />
be too thin for the conductivity <strong>and</strong> thin-film deposition<br />
considerations i.e., film thickness control. After compromising<br />
device performance <strong>and</strong> manufacturability, a favorable<br />
thickness combination, including the bottom electrode<br />
layer, piezoelectric layer, <strong>and</strong> top electrode layer, was selected<br />
for the following <strong>fabrication</strong> processes. The piezoelectric<br />
layer was around 2 m, <strong>and</strong> the top <strong>and</strong> bottom<br />
electrodes are less than 4000Å.<br />
Conventional ladder-type <strong>filter</strong> design was used in this<br />
work. 13 As shown in Fig. 4, the <strong>filter</strong> in this study consists<br />
<strong>of</strong> seven resonators. These seven resonators were designed<br />
to have only two different resonant frequencies. Thus, the<br />
characteristics <strong>of</strong> the <strong>filter</strong> were determined <strong>by</strong> these two<br />
resonant frequencies <strong>of</strong> the resonators. In general, the design<br />
parameters <strong>of</strong> the <strong>filter</strong> included the planar dimensions,<br />
resonant frequency, <strong>and</strong> electromechanical coupling factor<br />
<strong>of</strong> the resonator. According to Mason’s model, the information<br />
<strong>of</strong> resonance frequency <strong>and</strong> the electromechanical coupling<br />
coefficient can be simulated. Moreover, the quality<br />
factor <strong>of</strong> the resonator has already been determined during<br />
the deposition <strong>of</strong> the piezoelectric film. In this work, the<br />
quality factor Q s was not be tuned <strong>by</strong> process means, it was<br />
J. Microlith., Micr<strong>of</strong>ab., Microsyst. 033010-2<br />
Jul–Sep 2005/Vol. 43
Lin, Chen, <strong>and</strong> Fang: <strong>Design</strong> <strong>and</strong> <strong>fabrication</strong> <strong>of</strong> a <strong>miniaturized</strong> …<br />
Fig. 4 Configuration <strong>of</strong> a typical ladder-type <strong>filter</strong>.<br />
regarded as a fixed parameter during design. Consequently,<br />
the remaining parameters were the planar dimensions <strong>of</strong> the<br />
resonator, which directly affects the mask layout. A<br />
minimum-size <strong>filter</strong> was preferred. In addition, the <strong>filter</strong><br />
designed in this study must meet the requirement <strong>of</strong> low<br />
insertion loss <strong>and</strong> <strong>high</strong> rejection. In summary, the desired<br />
<strong>filter</strong> has the following specifications: center frequency is<br />
2441.75 MHz, b<strong>and</strong>width is 83.5 MHz, rejection is more<br />
than 25 dB, <strong>and</strong> return loss is greater than 10 dB. To this<br />
end, ADS commercial s<strong>of</strong>tware was employed to design the<br />
planar dimensions <strong>of</strong> the device to optimize <strong>filter</strong><br />
performance. 14 Since the thickness <strong>of</strong> the piezoelectric film<br />
was 2 m, the optimal length <strong>of</strong> each resonator was in the<br />
range <strong>of</strong> 100 to 300 m.<br />
3 Fabrication Process <strong>and</strong> Results<br />
The <strong>fabrication</strong> processes employed in this study are summarized<br />
in Fig. 5. As shown in Fig. 5a, a silicon dioxide<br />
layer was thermally grown on a 100 silicon substrate, <strong>and</strong><br />
then a silicon nitride layer was deposited on top <strong>of</strong> it. These<br />
two layers not only insulate devices from silicon substrate,<br />
but also act as etching stop layers for the ICP process. The<br />
bottom electrode was deposited <strong>and</strong> patterned, as shown in<br />
Fig. 5b. After that, the piezoelectric layer was deposited<br />
<strong>and</strong> patterned, as illustrated in Fig. 5c. Aluminum nitride<br />
AlN was selected in this process to be the piezoelectric<br />
layer. Since the AlN002 structure grown on Pt has better<br />
orientation, 15 Ti-Pt film was employed as the material for<br />
the bottom electrode in Fig. 5b. The dc sputtering process<br />
was used in Fig. 5c to deposit the AlN film, <strong>and</strong> the wafer<br />
temperature was 160 °C, which was measured <strong>by</strong> a thermal<br />
couple attached directly at the substrate. The AlN film was<br />
etched to provide connection between the bottom electrode<br />
<strong>and</strong> top electrode. According to the <strong>high</strong>er etching rate, wet<br />
chemical etching was preferred to pattern the AlN. Moreover,<br />
the slope <strong>of</strong> the sidewall could be tuned to about 1/20<br />
<strong>by</strong> wet etching, as indicated in Fig. 5c. Thus, the step<br />
coverage was significantly improved due to this inclined<br />
sidewall. Disconnection <strong>of</strong> the conducting metal wires<br />
caused <strong>by</strong> the step coverage problem was eliminated. After<br />
that, the top electrode was deposited <strong>and</strong> the geometry was<br />
defined <strong>by</strong> a lift-<strong>of</strong>f process, as shown in Fig. 5d. The<br />
material <strong>of</strong> the top electrode was aluminum, which has low<br />
resistively <strong>and</strong> low density as well. Since the FBAR <strong>filter</strong><br />
should be comprised <strong>of</strong> resonators with two different frequencies,<br />
an additional thin metal layer was deposited on<br />
some <strong>of</strong> the resonators to shift down the resonance frequency<br />
as shown in Fig. 5e. Afterward, backside <strong>bulk</strong><br />
Fig. 5 FBAR <strong>fabrication</strong> process using backside ICP.<br />
silicon etching was implemented using ICP, <strong>and</strong> then the<br />
thin membrane was formed, as shown in Fig. 5f. The<br />
membrane was free at both top <strong>and</strong> bottom surfaces, therefore<br />
the resonator achieved a <strong>high</strong> quality factor. Finally,<br />
insulating layers SiO 2 <strong>and</strong> Si 3 N 4 under the membrane<br />
were removed to increase the quality factor <strong>and</strong> fine tune<br />
the resonance frequency, as shown in Fig. 5g.<br />
The fabricated devices were designed to have compact<br />
size 11 mm, therefore the total number <strong>of</strong> devices on the<br />
six-inch wafer was about 10,000. Figure 6a shows the top<br />
view photo <strong>of</strong> the fabricated <strong>filter</strong>. The in-plane dimensions<br />
<strong>of</strong> the <strong>filter</strong> cavity was about 430550 m. As indicated in<br />
Fig. 6a, there are seven resonators with different sizes: the<br />
largest resonator was about 180160 m <strong>and</strong> the smallest<br />
resonator was about 120150 m. This photo also shows<br />
that the electrodes <strong>and</strong> FBAR membrane were not damaged<br />
during the backside etching process. The SEM photo in<br />
Fig. 6b shows the cross section view <strong>of</strong> a typical suspended<br />
FBAR <strong>filter</strong>. It is clearly observed from the SEM<br />
photo that the <strong>filter</strong> has vertical sidewalls perpendicular to<br />
the wafer surface. The experiment results demonstrated that<br />
the size <strong>of</strong> the <strong>filter</strong> was significantly reduced <strong>by</strong> the ICP<br />
etching process, compared with the backside wet etching<br />
process, which normally consumes a four times larger area<br />
due to anisotropic etching characteristics. In addition, the<br />
ICP etching was a dry process <strong>and</strong> had <strong>high</strong> material etching<br />
selectivity, so that this process could prevent material<br />
overetching <strong>and</strong> membrane sticking problems. These prob-<br />
J. Microlith., Micr<strong>of</strong>ab., Microsyst. 033010-3<br />
Jul–Sep 2005/Vol. 43
Lin, Chen, <strong>and</strong> Fang: <strong>Design</strong> <strong>and</strong> <strong>fabrication</strong> <strong>of</strong> a <strong>miniaturized</strong> …<br />
Fig. 8 XRD pattern <strong>of</strong> sputtered AlN film.<br />
to demonstrate the orientation quality <strong>of</strong> AlN, as shown in<br />
Fig. 8. In this figure, an AlN 002 peak can be clearly<br />
observed at 36 deg. The packaged size can be 33 mm<strong>by</strong><br />
wire bond method or 2.52.0 mm <strong>by</strong> flip chip method.<br />
This size is the same as that <strong>of</strong> SAW <strong>filter</strong>s but is much<br />
smaller than that <strong>of</strong> ceramic <strong>filter</strong>s.<br />
Fig. 6 Photos <strong>of</strong> the fabricated device: a top view <strong>and</strong> b cross<br />
section view.<br />
lems frequently occur in existing FBAR <strong>fabrication</strong><br />
methods. 1–4 Figure 7 shows the zoom-in photo <strong>of</strong> the membrane<br />
structure. It demonstrates that the micrometer-thick<br />
AlN film had grown well on the Ti-Pt film, therefore the<br />
collimated structure throughout the layer can be observed.<br />
Moreover, an x-ray diffraction XRD pattern was measured<br />
4 Measurement <strong>and</strong> Results<br />
To demonstrate the performance <strong>of</strong> the device fabricated<br />
using the processes in Fig. 5, two types <strong>of</strong> <strong>acoustic</strong> devices<br />
were measured. In addition to characterizing the performance<br />
<strong>of</strong> the <strong>filter</strong>, the resonator was employed as a test<br />
key to identify the quality factor <strong>of</strong> the device. During the<br />
test, both <strong>of</strong> these two devices were characterized <strong>by</strong> network<br />
analyzer <strong>and</strong> on-wafer probe sets. The overall measurement<br />
setup, included probes <strong>and</strong> lines, were calibrated<br />
using short-load-open-through impedance st<strong>and</strong>ard substrates<br />
at the beginning <strong>of</strong> the measurement.<br />
Resonator test keys were tested <strong>by</strong> the one-port test<br />
method. Moreover, to demonstrate the overall performance<br />
<strong>of</strong> the resonator device, the parasitic resistance on the chip<br />
Fig. 7 Collimated structure <strong>of</strong> AlN can be identified in the suspended<br />
membrane.<br />
Fig. 9 Measured resonator characteristic in Smith chart form.<br />
J. Microlith., Micr<strong>of</strong>ab., Microsyst. 033010-4<br />
Jul–Sep 2005/Vol. 43
Lin, Chen, <strong>and</strong> Fang: <strong>Design</strong> <strong>and</strong> <strong>fabrication</strong> <strong>of</strong> a <strong>miniaturized</strong> …<br />
Fig. 11 Relationship between temperature <strong>and</strong> variation <strong>of</strong> resonance<br />
frequency.<br />
resonator, the phase should change from −90 to +90 deg in<br />
steep slope at the series resonance <strong>and</strong> parallel resonance<br />
points. However, if the resonator had energy dissipation,<br />
the slope <strong>of</strong> phase change becomes gentle. The quality factor<br />
Q s at the series resonance frequency was calculated <strong>by</strong><br />
the rate <strong>of</strong> phase change with frequency at resonance 12 :<br />
Fig. 10 Comparison <strong>of</strong> measured <strong>and</strong> simulated input impedances<br />
for a magnitude <strong>and</strong> b phase.<br />
was not de-embedded after measurement. Test results <strong>of</strong><br />
resonators are shown in Figs. 9 <strong>and</strong> 10. Figure 9 shows the<br />
S11 <strong>of</strong> the resonator in the form <strong>of</strong> a Smith chart. It shows<br />
that a very small effective series resistance was presented,<br />
so that the measured S11 circle was slightly shrunk. However,<br />
this small amount <strong>of</strong> series resistance in the resonator<br />
was acceptable for <strong>filter</strong> application purposes.<br />
Figure 10a shows the measured <strong>and</strong> simulated magnitude<br />
<strong>of</strong> input impedance. The measured series resonance<br />
frequency f s <strong>and</strong> the parallel resonance frequency f p in Fig.<br />
10a were determined <strong>by</strong> the minimum <strong>and</strong> maximum input<br />
impedance, respectively. According to the measured f s<br />
<strong>and</strong> f p , the electromechanical coupling coefficient K 2 <strong>of</strong><br />
this device extracted from Eq. 1 was about 5.7%. Simulation<br />
<strong>of</strong> the input impedance utilized transmission line<br />
model is described in Sec. 2. The simulation results agree<br />
well with the measured ones. However, the measured curve<br />
had a narrower separation <strong>of</strong> f s <strong>and</strong> f p than the simulated<br />
one. This is because the simulation model employed an<br />
ideal piezoelectric constant. Figure 10b shows the measured<br />
<strong>and</strong> simulated phase <strong>of</strong> input impedance. For an ideal<br />
Q s = f s<br />
2 dZ in, 2<br />
df<br />
where Z in is the phase <strong>of</strong> input impedance. For this device,<br />
the phase change was quite steep at the series resonance<br />
point, therefore the resonance had a very <strong>high</strong> quality<br />
factor. The quality factor at the series resonance point was<br />
calculated to be 1567 for this device. These electrical performances<br />
show that the ICP process was promising for the<br />
<strong>fabrication</strong> <strong>of</strong> <strong>bulk</strong> <strong>acoustic</strong> resonators.<br />
The characteristics <strong>of</strong> resonators were sensitive to the<br />
ambient temperature. 4 In this regard, the resonators were<br />
also tested under various temperatures using the thermal<br />
chuck <strong>and</strong> wafer probing method. The temperature was<br />
controlled to rise from 25 to 80 °C <strong>and</strong> then cool down<br />
from 80 to 5 °C. Series resonance frequencies were recorded<br />
<strong>and</strong> plotted in Fig. 11, where each error bar represents<br />
five measurement data. The measured relationship between<br />
temperature <strong>and</strong> resonance frequency was linear. In<br />
addition, the temperature coefficient <strong>of</strong> resonance frequency<br />
was about −27.4 ppm/ °C, which was consistent<br />
with Ref. 4. After the device temperature cooled down from<br />
<strong>high</strong> temperature to room temperature, the resonance frequency<br />
returned to its original value at room temperature.<br />
These results indicated that although <strong>bulk</strong> <strong>acoustic</strong> wave<br />
devices using the ICP method consisted <strong>of</strong> a suspended<br />
structure, such as a membrane, they still held good thermal<br />
conductivity. Thus, there was no heat piled up in the device<br />
during temperature variation.<br />
Next, the <strong>filter</strong> performance was measured. This <strong>filter</strong><br />
was a traditional ladder-type design; it included four serially<br />
connected resonators <strong>and</strong> three shunt resonators. Figure<br />
12 shows the typical measurement result. The minimum<br />
insertion loss was about 1.5 dB <strong>and</strong> maximum insertion<br />
J. Microlith., Micr<strong>of</strong>ab., Microsyst. 033010-5<br />
Jul–Sep 2005/Vol. 43
Lin, Chen, <strong>and</strong> Fang: <strong>Design</strong> <strong>and</strong> <strong>fabrication</strong> <strong>of</strong> a <strong>miniaturized</strong> …<br />
station. The quality factor <strong>and</strong> electromechanical coupling<br />
coefficient <strong>of</strong> a single resonator are 1567 <strong>and</strong> 5.7%, respectively.<br />
The insertion loss <strong>of</strong> the <strong>filter</strong> in Fig. 11 has a maximum<br />
<strong>of</strong> 3.6 dB at 83.5-MHz b<strong>and</strong> from 2.4 to 2.4835<br />
GHz. In addition, the rest <strong>of</strong> the region has more than<br />
25-dB rejection. These <strong>fabrication</strong> <strong>and</strong> test results demonstrate<br />
that <strong>high</strong>-quality thin film <strong>bulk</strong> <strong>acoustic</strong> resonators<br />
<strong>and</strong> <strong>filter</strong>s can be designed <strong>and</strong> fabricated using an ICP<br />
process.<br />
As shown in Fig. 9, the measured resonator performance<br />
has some unwanted modes near the resonance points. These<br />
modes could result in unwanted ripples near the passb<strong>and</strong>.<br />
To overcome this problem, resistive loss could be deliberately<br />
added in the cost <strong>of</strong> <strong>high</strong>er insertion loss. However,<br />
the required amount <strong>of</strong> resistance is hard to predict or simulated,<br />
therefore extensive experiments should be carried<br />
out.<br />
Acknowledgment<br />
The author would like to express his appreciation to Asia<br />
Pacific Microsystems, Incorporated Taiwan for providing<br />
<strong>fabrication</strong> facilities <strong>and</strong> technical assistance.<br />
Fig. 12 Filter performance <strong>of</strong> a wide b<strong>and</strong> <strong>and</strong> b narrow b<strong>and</strong>.<br />
loss in 83.5-MHz b<strong>and</strong>width was 3.6 dB. Moreover, the<br />
in-b<strong>and</strong> return loss was more than 10 dB <strong>and</strong> the minimum<br />
out-<strong>of</strong>-b<strong>and</strong> rejection was 25 dB. According to the test results,<br />
this <strong>high</strong> frequency <strong>filter</strong> had good electric performance<br />
comparable to SAW <strong>filter</strong>s, which typically specify<br />
maximum insertion loss as 3.5 dB <strong>and</strong> rejection at 20 dB.<br />
Other frequency b<strong>and</strong>s ranging from 1.5 to 2.2 GHz could<br />
be easily redesigned <strong>and</strong> fabricated <strong>by</strong> changing the electrode<br />
layout <strong>and</strong> thickness <strong>of</strong> suspended membranes.<br />
5 Conclusion <strong>and</strong> Discussion<br />
Thin film <strong>bulk</strong> <strong>acoustic</strong> resonators <strong>and</strong> <strong>filter</strong>s are realized<br />
using ICP <strong>bulk</strong> silicon etching. Thus, the cavity on the silicon<br />
substrate after <strong>bulk</strong> etching has near vertical sidewalls.<br />
In this regard, the size <strong>of</strong> the devices is significantly reduced<br />
to 25% compared to wet etching processes. In addition,<br />
the performance <strong>of</strong> the devices is also properly controlled.<br />
A transmission line model is used to simulate the<br />
performance <strong>of</strong> the resonator. According to the simulation<br />
results, the preferable structure thickness is determined.<br />
The devices are tested <strong>by</strong> a network analyzer <strong>and</strong> probe<br />
References<br />
1. S. V. Krishnaswamy, J. Rosenbaum, S. Horwitz, C. Vale, <strong>and</strong> R. A.<br />
Moore, “Film <strong>bulk</strong> <strong>acoustic</strong> wave resonator technology,” in Proc.<br />
IEEE Ultrasonics Symp., pp. 529–536, Honolulu, HI Dec. 1990.<br />
2. J. Y. Park, H. C. Lee, K. H. Lee, H. M. Lee, <strong>and</strong> Y. J. Ko, “Micromachined<br />
FBAR RF <strong>filter</strong>s for advanced h<strong>and</strong>set applications,” in<br />
IEEE Intl. Conf. Solid State Sensors, Actuators <strong>and</strong> Microsyst., pp.<br />
911–914, Boston, MA June 2003.<br />
3. R. Ru<strong>by</strong>, P. Bradley, J. D. Larson III, <strong>and</strong> Y. Oshmyansky, “PCS<br />
1900 MHz duplexer using thin film <strong>bulk</strong> <strong>acoustic</strong> resonator<br />
FBARS,” Electron. Lett. 35, 794–795 1999.<br />
4. J. D. Larson III, R. C. Ru<strong>by</strong>, P. D. Bradley, J. Wen, S. L. Kok, <strong>and</strong> A.<br />
Chien, “Power h<strong>and</strong>ling <strong>and</strong> temperature coefficient studies in FBAR<br />
duplexers for the 1900 MHz PCS b<strong>and</strong>,” in 2000 IEEE Ultrasonics<br />
Symp., Vol. 1, pp. 869–874, San Juan, Puerto Rico 2000.<br />
5. K. M. Lakin, K. T. McCarron, <strong>and</strong> R. E. Rose, “Solidly mounted<br />
resonators <strong>and</strong> <strong>filter</strong>s,” in Proc. IEEE Ultrasonics Symp., pp. 905–<br />
908, Seattle, WA Nov. 1995.<br />
6. G. Yoon <strong>and</strong> J. D. Park, “Fabrication <strong>of</strong> ZnO-based film <strong>bulk</strong> <strong>acoustic</strong><br />
resonator devices using W/SiO2 multilayer reflector,” Electron. Lett.<br />
36, 1435–1437 2000.<br />
7. R. Ru<strong>by</strong>, P. Bradley, D. Clark, D. Feld, T. Jamneala, <strong>and</strong> K. Wang,<br />
“Acoustic FBAR for <strong>filter</strong>s, duplexers <strong>and</strong> front end modules,” in<br />
2004 IEEE MITT-S Int. Microwave Symp. Digest, pp. 931–934, Fort<br />
Worth, TX June 2004.<br />
8. A. P. S. Khanna, E. Gane, <strong>and</strong> T. Chong, “A 2GHz voltage tunable<br />
FBAR oscillator,” in 2003 IEEE MTT-S Int. Microwave Symp. Digest,<br />
Vol. 2, pp. 717–720, Philadelphia, PA June 2003.<br />
9. J. P. Jung, J. B. Lee, M. H. Lee, <strong>and</strong> J. S. Park, “Experimental <strong>and</strong><br />
theoretical investigation on the relationship between AlN properties<br />
<strong>and</strong> AlN-based FBAR characteristics,” in Proc. Ann. IEEE Intl. Frequency<br />
Control Symp., pp. 779–784, Tampa, FL May 2003.<br />
10. T. Y. Kang, M. J. Keum, I. H. Son, K. S. Kim, J. B. Lee, <strong>and</strong> K. H.<br />
Kim, “Preparation <strong>of</strong> AZO/ZnO/AZO/SiO 2 /Si thin film for FBAR,”<br />
in 2003 IEEE Ultrasonics Symp. Proc., pp. 2016–2019, Honolulu, HI<br />
Oct. 2003.<br />
11. B.A.Auld,Acoustic Fields <strong>and</strong> Waves in Solids, John Wiley <strong>and</strong><br />
Sons, New York 1973.<br />
12. K. M. Lakin, “Modeling <strong>of</strong> thin film resonators <strong>and</strong> <strong>filter</strong>s,” in Digest<br />
IEEE Microwave Symp., pp. 149–152, Albuquerque, NM June<br />
1992.<br />
13. K. M. Lakin, G. R. Kline, <strong>and</strong> K. T. McCarron, “Thin film <strong>bulk</strong><br />
<strong>acoustic</strong> wave <strong>filter</strong>s for GPS,” in Proc. IEEE Ultrasonics Symp., pp.<br />
471–476, Tucson, AZ Dec. 1992.<br />
14. J. D. Larson III, R. Ru<strong>by</strong>, P. Bradley, <strong>and</strong> Y. Oshmyansky, “A BAW<br />
antenna duplexer for the 1900 MHz PCS b<strong>and</strong>,” in Proc. IEEE Ultrasonics<br />
Symp., pp. 887–890, Caesars Tahoe, NV Oct. 1999.<br />
15. H. P. Lobl, M. Klee, R. Milsom, R. Dekker, C. Metzmacher, W.<br />
Br<strong>and</strong>, <strong>and</strong> P. Lok, “Materials for <strong>bulk</strong> <strong>acoustic</strong> wave BAW resonators<br />
<strong>and</strong> <strong>filter</strong>s,” J. Eur. Ceram. Soc. 21, 2633–2640 2001.<br />
J. Microlith., Micr<strong>of</strong>ab., Microsyst. 033010-6<br />
Jul–Sep 2005/Vol. 43
Lin, Chen, <strong>and</strong> Fang: <strong>Design</strong> <strong>and</strong> <strong>fabrication</strong> <strong>of</strong> a <strong>miniaturized</strong> …<br />
Chung-Hsien Lin received his MS degree from National Tsing Hua<br />
University in 1999. From 2001 to 2004, he worked as a design engineer<br />
in Asia-Pacific Microsystems, Incorporated, Taiwan. His job<br />
duties focused on the design <strong>and</strong> <strong>fabrication</strong> <strong>of</strong> RF-MEMS components.<br />
He is currently a PhD student in the power mechanical engineering<br />
department at National Tsing Hua University. His research<br />
interests include MEMS with emphasis on RF-MEMS, CMOS-<br />
MEMS, <strong>and</strong> microsensors.<br />
Hong-Ren Chen received his BS degree in marine engineering<br />
from National Taiwan Ocean University in 1993. He got the MS <strong>and</strong><br />
PhD degrees from the Institute <strong>of</strong> Aeronautics <strong>and</strong> Astronautic from<br />
National Cheng Kung University, Taiwan, in 1995 <strong>and</strong> 2001, respectively.<br />
He has been working as a section manager in the wireless<br />
system division <strong>of</strong> Asia Pacific Microsystems, Incorporated, Hsinchu,<br />
Taiwan, since 2001. His research interests include design <strong>and</strong><br />
<strong>fabrication</strong> <strong>of</strong> micr<strong>of</strong>luidic systems <strong>and</strong> RF MEMS devices, microscale<br />
flow, <strong>and</strong> heat transfer.<br />
Weileun Fang received his PhD degree from Carnegie Mellon University<br />
in 1995. His doctoral research focused on determining the<br />
mechanical properties <strong>of</strong> thin films using micromachined structures.<br />
In 1995, he worked as a postdoctoral research fellow at Synchrotron<br />
Radiation Research Center, Taiwan. He is currently a pr<strong>of</strong>essor in<br />
the power mechanical engineering department at National Tsing<br />
Hua University, Taiwan. His research interests include MEMS with<br />
emphasis on micro-optical systems, microactuators, <strong>and</strong> the characterization<br />
<strong>of</strong> the mechanical properties <strong>of</strong> thin films.<br />
J. Microlith., Micr<strong>of</strong>ab., Microsyst. 033010-7<br />
Jul–Sep 2005/Vol. 43