Report on the Drug Situation 2010 - Bundesministerium für ...
Report on the Drug Situation 2010 - Bundesministerium für ...
Report on the Drug Situation 2010 - Bundesministerium für ...
You also want an ePaper? Increase the reach of your titles
YUMPU automatically turns print PDFs into web optimized ePapers that Google loves.
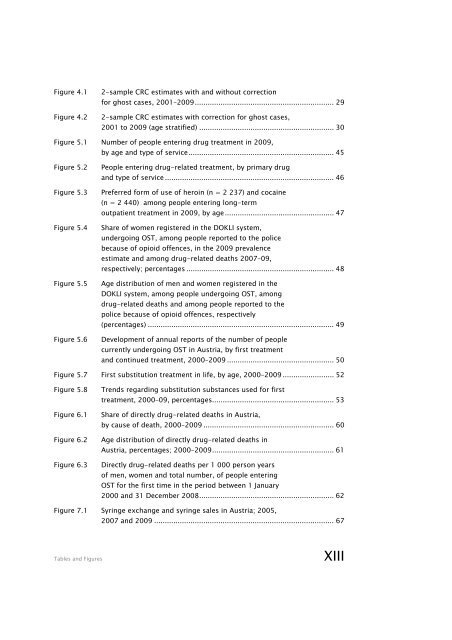
Figure 4.1<br />
Figure 4.2<br />
2-sample CRC estimates with and without correcti<strong>on</strong><br />
for ghost cases, 2001–2009 ................................................................. 29<br />
2-sample CRC estimates with correcti<strong>on</strong> for ghost cases,<br />
2001 to 2009 (age stratified) ............................................................... 30<br />
Figure 5.1 Number of people entering drug treatment in 2009,<br />
by age and type of service .................................................................... 45<br />
Figure 5.2<br />
Figure 5.3<br />
Figure 5.4<br />
Figure 5.5<br />
Figure 5.6<br />
People entering drug-related treatment, by primary drug<br />
and type of service ............................................................................... 46<br />
Preferred form of use of heroin (n = 2 237) and cocaine<br />
(n = 2 440) am<strong>on</strong>g people entering l<strong>on</strong>g-term<br />
outpatient treatment in 2009, by age ................................................... 47<br />
Share of women registered in <strong>the</strong> DOKLI system,<br />
undergoing OST, am<strong>on</strong>g people reported to <strong>the</strong> police<br />
because of opioid offences, in <strong>the</strong> 2009 prevalence<br />
estimate and am<strong>on</strong>g drug-related deaths 2007–09,<br />
respectively; percentages ..................................................................... 48<br />
Age distributi<strong>on</strong> of men and women registered in <strong>the</strong><br />
DOKLI system, am<strong>on</strong>g people undergoing OST, am<strong>on</strong>g<br />
drug-related deaths and am<strong>on</strong>g people reported to <strong>the</strong><br />
police because of opioid offences, respectively<br />
(percentages) ....................................................................................... 49<br />
Development of annual reports of <strong>the</strong> number of people<br />
currently undergoing OST in Austria, by first treatment<br />
and c<strong>on</strong>tinued treatment, 2000–2009 .................................................. 50<br />
Figure 5.7 First substituti<strong>on</strong> treatment in life, by age, 2000–2009 ........................ 52<br />
Figure 5.8<br />
Figure 6.1<br />
Figure 6.2<br />
Figure 6.3<br />
Trends regarding substituti<strong>on</strong> substances used for first<br />
treatment, 2000–09, percentages......................................................... 53<br />
Share of directly drug-related deaths in Austria,<br />
by cause of death, 2000–2009 ............................................................. 60<br />
Age distributi<strong>on</strong> of directly drug-related deaths in<br />
Austria, percentages; 2000–2009 ......................................................... 61<br />
Directly drug-related deaths per 1 000 pers<strong>on</strong> years<br />
of men, women and total number, of people entering<br />
OST for <strong>the</strong> first time in <strong>the</strong> period between 1 January<br />
2000 and 31 December 2008 ............................................................... 62<br />
Figure 7.1 Syringe exchange and syringe sales in Austria; 2005,<br />
2007 and 2009 .................................................................................... 67<br />
Tables and Figures<br />
XIII


