City of Greater Bendigo Budget 2015/2016
The Budget for 2015/2016 will help build a better, healthier and more sustainable Greater Bendigo.
The Budget for 2015/2016 will help build a better, healthier and more sustainable Greater Bendigo.

You also want an ePaper? Increase the reach of your titles
YUMPU automatically turns print PDFs into web optimized ePapers that Google loves.
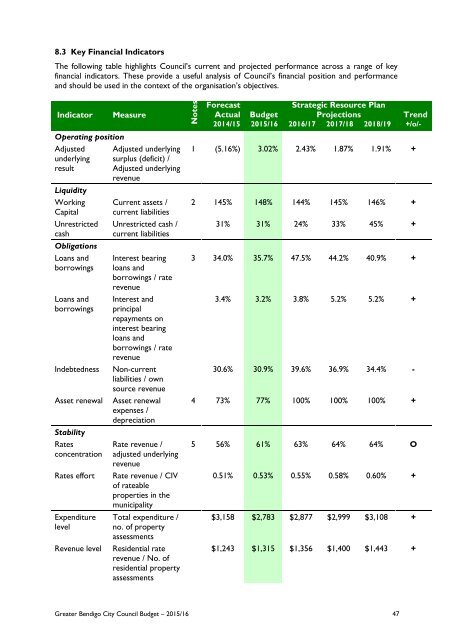
8.3 Key Financial Indicators<br />
The following table highlights Council’s current and projected performance across a range <strong>of</strong> key<br />
financial indicators. These provide a useful analysis <strong>of</strong> Council’s financial position and performance<br />
and should be used in the context <strong>of</strong> the organisation’s objectives.<br />
Indicator<br />
Operating position<br />
Adjusted<br />
underlying<br />
result<br />
Liquidity<br />
Working<br />
Capital<br />
Unrestricted<br />
cash<br />
Obligations<br />
Loans and<br />
borrowings<br />
Loans and<br />
borrowings<br />
Indebtedness<br />
Asset renewal<br />
Stability<br />
Rates<br />
concentration<br />
Rates effort<br />
Expenditure<br />
level<br />
Revenue level<br />
Measure<br />
Adjusted underlying<br />
surplus (deficit) /<br />
Adjusted underlying<br />
revenue<br />
Current assets /<br />
current liabilities<br />
Unrestricted cash /<br />
current liabilities<br />
Interest bearing<br />
loans and<br />
borrowings / rate<br />
revenue<br />
Interest and<br />
principal<br />
repayments on<br />
interest bearing<br />
loans and<br />
borrowings / rate<br />
revenue<br />
Non-current<br />
liabilities / own<br />
source revenue<br />
Asset renewal<br />
expenses /<br />
depreciation<br />
Rate revenue /<br />
adjusted underlying<br />
revenue<br />
Rate revenue / CIV<br />
<strong>of</strong> rateable<br />
properties in the<br />
municipality<br />
Total expenditure /<br />
no. <strong>of</strong> property<br />
assessments<br />
Residential rate<br />
revenue / No. <strong>of</strong><br />
residential property<br />
assessments<br />
Notes<br />
Forecast<br />
Actual <strong>Budget</strong><br />
Strategic Resource Plan<br />
Projections<br />
Trend<br />
2014/15 <strong>2015</strong>/16 <strong>2016</strong>/17 2017/18 2018/19 +/o/-<br />
1 (5.16%) 3.02% 2.43% 1.87% 1.91% +<br />
2 145% 148% 144% 145% 146% +<br />
31% 31% 24% 33% 45% +<br />
3 34.0% 35.7% 47.5% 44.2% 40.9% +<br />
3.4% 3.2% 3.8% 5.2% 5.2% +<br />
30.6% 30.9% 39.6% 36.9% 34.4% -<br />
4 73% 77% 100% 100% 100% +<br />
5 56% 61% 63% 64% 64% O<br />
0.51% 0.53% 0.55% 0.58% 0.60% +<br />
$3,158 $2,783 $2,877 $2,999 $3,108 +<br />
$1,243 $1,315 $1,356 $1,400 $1,443 +<br />
<strong>Greater</strong> <strong>Bendigo</strong> <strong>City</strong> Council <strong>Budget</strong> – <strong>2015</strong>/16 47