City of Greater Bendigo Budget 2015/2016
The Budget for 2015/2016 will help build a better, healthier and more sustainable Greater Bendigo.
The Budget for 2015/2016 will help build a better, healthier and more sustainable Greater Bendigo.

You also want an ePaper? Increase the reach of your titles
YUMPU automatically turns print PDFs into web optimized ePapers that Google loves.
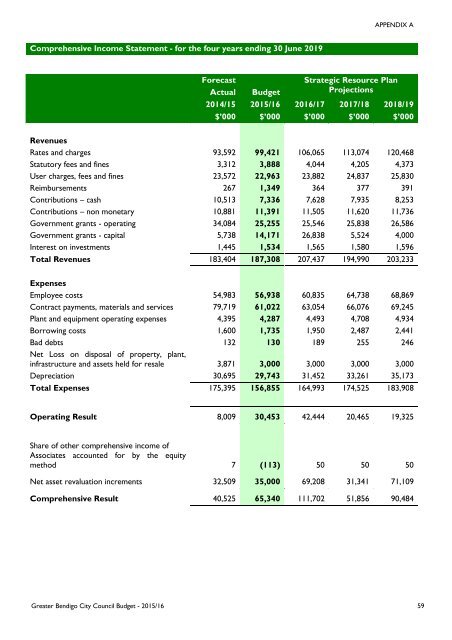
APPENDIX A<br />
Comprehensive Income Statement - for the four years ending 30 June 2019<br />
Forecast<br />
Actual<br />
<strong>Budget</strong><br />
Strategic Resource Plan<br />
Projections<br />
2014/15 <strong>2015</strong>/16 <strong>2016</strong>/17 2017/18 2018/19<br />
$’000 $’000 $’000 $’000 $’000<br />
Revenues<br />
Rates and charges 93,592 99,421 106,065 113,074 120,468<br />
Statutory fees and fines 3,312 3,888 4,044 4,205 4,373<br />
User charges, fees and fines 23,572 22,963 23,882 24,837 25,830<br />
Reimbursements 267 1,349 364 377 391<br />
Contributions – cash 10,513 7,336 7,628 7,935 8,253<br />
Contributions – non monetary 10,881 11,391 11,505 11,620 11,736<br />
Government grants - operating 34,084 25,255 25,546 25,838 26,586<br />
Government grants - capital 5,738 14,171 26,838 5,524 4,000<br />
Interest on investments 1,445 1,534 1,565 1,580 1,596<br />
Total Revenues 183,404 187,308 207,437 194,990 203,233<br />
Expenses<br />
Employee costs 54,983 56,938 60,835 64,738 68,869<br />
Contract payments, materials and services 79,719 61,022 63,054 66,076 69,245<br />
Plant and equipment operating expenses 4,395 4,287 4,493 4,708 4,934<br />
Borrowing costs 1,600 1,735 1,950 2,487 2,441<br />
Bad debts 132 130 189 255 246<br />
Net Loss on disposal <strong>of</strong> property, plant,<br />
infrastructure and assets held for resale 3,871 3,000 3,000 3,000 3,000<br />
Depreciation 30,695 29,743 31,452 33,261 35,173<br />
Total Expenses 175,395 156,855 164,993 174,525 183,908<br />
Operating Result 8,009 30,453 42,444 20,465 19,325<br />
Share <strong>of</strong> other comprehensive income <strong>of</strong><br />
Associates accounted for by the equity<br />
method 7 (113) 50 50 50<br />
Net asset revaluation increments 32,509 35,000 69,208 31,341 71,109<br />
Comprehensive Result 40,525 65,340 111,702 51,856 90,484<br />
<strong>Greater</strong> <strong>Bendigo</strong> <strong>City</strong> Council <strong>Budget</strong> - <strong>2015</strong>/16 59