Volume 2, Issue 1, 2011, Full Text - 5th International Conference on ...
Volume 2, Issue 1, 2011, Full Text - 5th International Conference on ...
Volume 2, Issue 1, 2011, Full Text - 5th International Conference on ...

Create successful ePaper yourself
Turn your PDF publications into a flip-book with our unique Google optimized e-Paper software.
Metal Structures Centre – <str<strong>on</strong>g>2011</str<strong>on</strong>g>
Sustainable C<strong>on</strong>structi<strong>on</strong><br />
& Design<br />
<str<strong>on</strong>g>Volume</str<strong>on</strong>g> 2, <str<strong>on</strong>g>2011</str<strong>on</strong>g><br />
<str<strong>on</strong>g>Issue</str<strong>on</strong>g> 1<br />
Published by<br />
Laboratory Soete – Ghent University<br />
Sint–Pietersnieuwstraat 41<br />
9000 Gent – Belgium<br />
http://www.tribology-fatigue.ugent.be/<br />
Edited by: Jeroen Van Wittenberghe<br />
ISSN: 2032-7471
Editor<br />
Jeroen Van Wittenberghe<br />
Co-editing organizati<strong>on</strong><br />
MSC - Metal Structures Centre<br />
Editorial Board<br />
Serge Claessens<br />
Patrick De Baets<br />
Wim De Waele<br />
Sergei Glavatskikh<br />
Stijn Hertelé<br />
Sven Vandeputte<br />
Walter Vermeirsch<br />
<str<strong>on</strong>g>Internati<strong>on</strong>al</str<strong>on</strong>g> Scientific Advisory Committee<br />
Magd Abdel Wahab<br />
Rudi Denys<br />
Ney Francisco Ferreira<br />
Gabor Kalacska<br />
Eli Saul Puchi Cabrera<br />
Dik Schipper<br />
Mariana Staia<br />
Laszlo Zsidai<br />
Sustainable C<strong>on</strong>structi<strong>on</strong> & Design, volume 2, issue 1, <str<strong>on</strong>g>2011</str<strong>on</strong>g><br />
ISSN 2032-7471<br />
Published by:<br />
Laboratory Soete – Ghent University<br />
Sint–Pietersnieuwstraat 41<br />
9000 Gent – Belgium<br />
http://www.tribology-fatigue.ugent.be/<br />
Cover design by Jeroen Van Wittenberghe<br />
The texts of the papers in this volume were set individually by the authors or under their supervisi<strong>on</strong>.<br />
Only minor correcti<strong>on</strong>s to the text may have been carried out by the publisher.<br />
No resp<strong>on</strong>sibility is assumed by the publisher, editor and authors for any injury or damage to pers<strong>on</strong>s<br />
or property as a matter of products liability, negligence or otherwise, or from any use or operati<strong>on</strong> of<br />
any methods, products, instructi<strong>on</strong>s or ideas c<strong>on</strong>tained in the material herein.<br />
© Laboratory Soete <str<strong>on</strong>g>2011</str<strong>on</strong>g><br />
The rights of this publicati<strong>on</strong> are held by the Laboratory Soete according to the Creative Comm<strong>on</strong>s,<br />
Attributi<strong>on</strong> 2.0. This means users are allowed to share and remix the work, but with attributi<strong>on</strong> to the<br />
authors. All with the understanding that other rights <strong>on</strong> the works are not affected by this license.<br />
The full license text can be found <strong>on</strong> http://creativecomm<strong>on</strong>s.org/licenses/by/2.0/be/
Editorial<br />
This first issue of the <str<strong>on</strong>g>2011</str<strong>on</strong>g> volume is dedicated to c<strong>on</strong>tact mechanics of materials<br />
and comp<strong>on</strong>ents. In the different papers a focus is given <strong>on</strong> new developments in the<br />
fields of tribology, c<strong>on</strong>tact fatigue, wear and damage behaviour of materials.<br />
Experimental test results as well as new analysis techniques are presented.<br />
From this issue the SCAD journal will be co-edited by the Metal Structures Centre<br />
(MSC). The MSC is a recently established partnership between the Laboratory Soete<br />
of Ghent University, OCAS and the Belgian Welding Institute and c<strong>on</strong>solidates the<br />
research <strong>on</strong> metal structures in Flanders. The year <str<strong>on</strong>g>2011</str<strong>on</strong>g> will be important for the<br />
MSC partners, since in the coming m<strong>on</strong>ths they all will move to a central campus.<br />
This way a new research cluster is created. The new research centre will coordinate<br />
and further develop the knowledge and competencies <strong>on</strong> the design, the use and the<br />
evaluati<strong>on</strong> of the behaviour of steel structures.<br />
Finally, I can also look back at a successful editi<strong>on</strong> of last SCAD c<strong>on</strong>ference, that took<br />
place <strong>on</strong> 16 and 17 February in Ghent. With over 180 participants this year’s<br />
c<strong>on</strong>ference further exceeded the success of the 2010 editi<strong>on</strong>. I would like to take the<br />
opportunity to express my gratitude to all who participated or c<strong>on</strong>tributed to this<br />
year’s c<strong>on</strong>ference.<br />
SCAD <str<strong>on</strong>g>2011</str<strong>on</strong>g> c<strong>on</strong>ference, past 16 and 17 February in Ghent, Belgium.<br />
Jeroen Van Wittenberghe<br />
SCAD journal editor
C<strong>on</strong>tents<br />
<str<strong>on</strong>g>2011</str<strong>on</strong>g>, <str<strong>on</strong>g>Volume</str<strong>on</strong>g> 2, <str<strong>on</strong>g>Issue</str<strong>on</strong>g> 1: C<strong>on</strong>tact mechanics of materials and comp<strong>on</strong>ents<br />
Experimental and numerical investigati<strong>on</strong> into effect of elevated temperature <strong>on</strong> fretting<br />
fatigue behavior .................................................................................................................................................................. 2<br />
Hojjati Talemi R., Soori M., Abdel Wahab M., De Baets P.<br />
Dry sliding fricti<strong>on</strong> and wear resp<strong>on</strong>se of WC-Co hardmetal pairs in linearly reciprocating and<br />
rotating c<strong>on</strong>tact ................................................................................................................................................................ 12<br />
Perez Delgado Y., B<strong>on</strong>ny K., De Baets P., Neis P.D., Rodriguez Fereira V., Malek O., Vleugels J.,<br />
Lauwers B.<br />
Characterizati<strong>on</strong> and modeling of fricti<strong>on</strong> and wear: an overview ............................................................ 19<br />
Al-Bender F., De Moerlooze K.<br />
Tribological behavior of composite-steel <strong>on</strong> rolling/sliding c<strong>on</strong>tacts for various loads .................. 29<br />
Ando M., Sukumaran J.<br />
Height-independent topographic parameters of worn surfaces ................................................................. 35<br />
Barányi I., Czifra Á., Kalácska G.<br />
Review and classificati<strong>on</strong> of fretting fatigue test rigs ...................................................................................... 41<br />
De Pauw J., De Baets P., De Waele W.<br />
Degradati<strong>on</strong> of carb<strong>on</strong> reinforced epoxy composites under sliding in ambient air ............................ 53<br />
Dhieb H., Buijnsters J.G., Celis J.P.<br />
Turning specialities of ZrO 2 ceramics ..................................................................................................................... 59<br />
Fledrich G., Pálinkás I., Keresztes R., Zsidai L., Petróczki K.<br />
Improved handling characteristics of off-road vehicles by applying active c<strong>on</strong>trol of steering<br />
wheel torque ..................................................................................................................................................................... 66<br />
Kis J., Jánosi L.<br />
Development envir<strong>on</strong>ment for haptic feedback device <strong>on</strong> mobile agricultural equipment ............ 75<br />
Jánosi L., Kis J.<br />
Abrasive wear of different hot-dip galvanized multilayers ........................................................................... 82<br />
Szabadi L., Kalácska G., Pék L., Pálinkás I.<br />
Investigati<strong>on</strong> of fricti<strong>on</strong> hysteresis using a laboratory-scale tribometer ................................................ 92<br />
Neis P.D., De Baets P., Perez Delgado Y., Ferreira N.F.<br />
Developing small-aircraft service and re-c<strong>on</strong>structi<strong>on</strong> of landing-gear leg support .......................... 99<br />
Lefánti R., Kalácska G., Oldal I., Petróczki K.<br />
vii
Machinability of engineering polymers ...............................................................................................................106<br />
Keresztes R., Kalácska G., Zsidai L., Dobrocsi Z.<br />
Roughness measurement problems in tribological testing .........................................................................115<br />
Rodriguez Fereira V., Sukumaran J., Ando M., De Baets P.<br />
Effect of velocity <strong>on</strong> roll/slip for low and high load c<strong>on</strong>diti<strong>on</strong>s in polymer composite ...................122<br />
Sukumaran J., Ando M., Rodriguez Fereira V., De Baets P.<br />
The symmetrical behaviour of carb<strong>on</strong> nanotubes juncti<strong>on</strong>s ......................................................................128<br />
Pataki T.I., Szakál Z.<br />
Comparing strength properties of natural and synthetic rubber mixtures ..........................................134<br />
Renner T., Pék L.<br />
Novel cylinder positi<strong>on</strong>ing system realised by using solenoid valves ....................................................142<br />
Földi L., Béres Z., Sárközi E.<br />
Symmetry and similarity properties of 2D figures .........................................................................................152<br />
Szakál Z., Zsoldos I.<br />
viii
<str<strong>on</strong>g>2011</str<strong>on</strong>g>, <str<strong>on</strong>g>Volume</str<strong>on</strong>g> 2, <str<strong>on</strong>g>Issue</str<strong>on</strong>g> 1<br />
C<strong>on</strong>tact mechanics of materials and comp<strong>on</strong>ents
Sustainable C<strong>on</strong>structi<strong>on</strong> and Design <str<strong>on</strong>g>2011</str<strong>on</strong>g><br />
EXPERIMENTAL AND NUMERICAL INVESTIGATION INTO EFFECT OF<br />
ELEVATED TEMPERATURE ON FRETTING FATIGUE BEHAVIOR<br />
R. Hojjati Talemi<br />
1 , M. Soori 2 , M. Abdel Wahab 1 and P. De Baets 1<br />
1 Department of mechanical c<strong>on</strong>structi<strong>on</strong> and producti<strong>on</strong>, Faculty of Engineering, Gent University, Belgium<br />
2<br />
Department of mechanical engineering, Islamic Azad University, Takestan Branch, Takestan, Iran<br />
Abstract Fretting fatigue damage occurs in c<strong>on</strong>tacting parts when they are subjected to fluctuating loadings<br />
and sliding movements at the same time. This phenomen<strong>on</strong> may occur in many applicati<strong>on</strong>s such as<br />
bearings/ shafts, bolted and riveted c<strong>on</strong>necti<strong>on</strong>s, steel cables, and steam and gas turbines. In this paper,<br />
the effect of elevated temperature <strong>on</strong> fretting fatigue life of Al7075-T6 is investigated using a new device for<br />
fretting fatigue tests with variable crank shaft mechanism. Also a finite element modeling method was used<br />
to estimate crack propagati<strong>on</strong> lifetime in aluminum alloy, Al7075-T6 specimens at elevated temperature<br />
under fretting c<strong>on</strong>diti<strong>on</strong>. In this method, shear and normal stresses that are caused by c<strong>on</strong>tact load are<br />
updated at each crack growth increment. Finally, a comparis<strong>on</strong> between the experimental and numerical<br />
results is d<strong>on</strong>e in order to evaluate the FE simulati<strong>on</strong>.<br />
The experimental results show that: (i) fretting fatigue life of the material increases with temperature up to<br />
350°C by 180% for low stresses and decreases by 40% for high stresses, (ii) this fashi<strong>on</strong> of variati<strong>on</strong> of<br />
fretting fatigue life versus temperature is believed to be due to degradati<strong>on</strong> of material properties which<br />
occurs by overaging and wear resistance increase due to oxidati<strong>on</strong> of aluminum alloy. While overaging<br />
gives rise to degradati<strong>on</strong> of mechanical strength of material and hence the reducti<strong>on</strong> of its fretting fatigue<br />
life, surface oxidati<strong>on</strong> of the specimens brings some improvement of fatigue behavior of the material.<br />
Metallurgical examinati<strong>on</strong> of the specimens reveals that temperature results in precipitati<strong>on</strong> of impurities of<br />
al-7075-T6. The size of precipitated impurities and their distances gets bigger as temperature increases.<br />
This could be a reas<strong>on</strong> for material degradati<strong>on</strong> of specimens which are exposed to heating for l<strong>on</strong>ger time<br />
durati<strong>on</strong>.<br />
Keywords Al7075-T6, Fretting Fatigue, Crack propagati<strong>on</strong>, Overaging, Finite element<br />
1 INTRODUCTION<br />
Fretting is a wear phenomen<strong>on</strong> that occurs between two c<strong>on</strong>tacting surfaces having small amplitude<br />
oscillatory moti<strong>on</strong> [1]. The formati<strong>on</strong> of debris and their entrapment between the c<strong>on</strong>tacting surfaces are<br />
thought to be <strong>on</strong>e of the origins of crack initiati<strong>on</strong> and premature failure of the engineering comp<strong>on</strong>ents<br />
under fretting fatigue c<strong>on</strong>diti<strong>on</strong>s. Fretting fatigue mechanism is complex and despite the fact that many<br />
attempts have so far been devoted to the study of this process, still there are numerous issues associates<br />
with this phenomen<strong>on</strong> which have remained to be clarified. This phenomen<strong>on</strong> is schematically shown in<br />
Figure 1. Fretting fatigue may occur in mechanical comp<strong>on</strong>ents such as fasteners, turbine blades, bearings/<br />
shafts, steel cables, steam and gas turbines [1]. The aviati<strong>on</strong> industry is another area in which fretting<br />
fatigue failures are comm<strong>on</strong>ly observed.<br />
Figure 1. Schematic illustrati<strong>on</strong> of fretting fatigue.<br />
Copyright © <str<strong>on</strong>g>2011</str<strong>on</strong>g> by Laboratory Soete<br />
2
Sustainable C<strong>on</strong>structi<strong>on</strong> and Design <str<strong>on</strong>g>2011</str<strong>on</strong>g><br />
Fretting fatigue in turbine dovetails is shown in Figure 2 [2]. Fretting fatigue may reduce the endurance limit<br />
of a comp<strong>on</strong>ent by half or more, in comparis<strong>on</strong> to the normal fatigue c<strong>on</strong>diti<strong>on</strong>s. Wear and fretting cracks<br />
are two direct c<strong>on</strong>sequences of fretting fatigue. Figure 3 shows deep pitting in the c<strong>on</strong>tact z<strong>on</strong>e of two<br />
specimens under fretting fatigue c<strong>on</strong>diti<strong>on</strong>s.<br />
Sliding directi<strong>on</strong><br />
Fretting fatigue<br />
scars<br />
2 mm<br />
Figure 2. Fretting fatigue in turbine dovetails [2].<br />
Figure 3. Deep pitting in the c<strong>on</strong>tact z<strong>on</strong>e<br />
of two specimens under fretting fatigue<br />
c<strong>on</strong>diti<strong>on</strong>s [3].<br />
Figure 4 shows a fracture surface of a specimen after failure by fretting fatigue [3]. The figure clearly<br />
indicates that the fracture surface c<strong>on</strong>sists of three deferent regi<strong>on</strong>s; a fretting fatigue z<strong>on</strong>e created by<br />
crack propagati<strong>on</strong>, a crack growth z<strong>on</strong>e and a tensile regi<strong>on</strong> which gives rise to fracture of specimen when<br />
it is sufficiently weakened by the crack z<strong>on</strong>e development. It is generally thought that crack initiati<strong>on</strong> is<br />
governed primarily by the local c<strong>on</strong>tact stresses and slips amplitude, whereas propagati<strong>on</strong> is more related<br />
to the far-field or bulk stresses [1]. A micrograph of fretting crack propagati<strong>on</strong> in a stainless steel alloy is<br />
depicted in Figure 5. The crack trajectory can be explained by stress intensity factors K I and K II . Cracks<br />
initially grow oblique to the directi<strong>on</strong> of normal force [4] (see figure 5). At this stage, which corresp<strong>on</strong>ds to a<br />
gross slip c<strong>on</strong>diti<strong>on</strong>s between c<strong>on</strong>tacting surfaces, the effect of fricti<strong>on</strong> force prevails and K II is the dominant<br />
mode of fracture. After the initial oblique propagati<strong>on</strong>, the angle of crack gradually reduces and finally crack<br />
coincides with normal force directi<strong>on</strong>. This stage corresp<strong>on</strong>ds to a state of partial slip in which a<br />
combinati<strong>on</strong> of the effects of modes K I and K II takes place. In the third stage, crack grows perpendicular to<br />
the normal load directi<strong>on</strong>, due to tensile stress, <strong>on</strong>ly by mode K I .<br />
Tensile<br />
z<strong>on</strong>e<br />
Crack<br />
propagati<strong>on</strong><br />
z<strong>on</strong>e<br />
Fretting z<strong>on</strong>e<br />
Figure 4. Fracture surface of a specimen<br />
after failure by fretting fatigue [3].<br />
Figure 5. A micrograph of a fretting<br />
crack propagati<strong>on</strong> in a stainless steel<br />
alloy [4]<br />
Fretting fatigue life can be affected by many parameters such as c<strong>on</strong>tact pressure, F, axial stress, σ, fricti<strong>on</strong><br />
between the pads and the specimen, pad geometry, sliding amplitude and temperature. The effect of<br />
heating <strong>on</strong> fretting fatigue has sufficiently been studied by different researchers [5, 6]. Fretting fatigue<br />
behavior of materials at elevated temperatures while being influenced by temperature is not the same for all<br />
materials. Hamdy and Waterhouse [7] have shown that mechanical strength of Ti–6Al–4V at temperatures<br />
up to 600°C diminishes as temperature increases. Hamdy and Waterhouse [5] reported that fretting fatigue<br />
life of aged Inc<strong>on</strong>el 718 at elevated temperatures up to 600°C was the same as that for normal fatigue at<br />
room temperature. Fretting fatigue life of materials has been examined by different authors such as Mutoh<br />
and Satoh [6] and Jina et al [8].<br />
In this work, the effect of elevated temperature <strong>on</strong> fretting fatigue life of Al7075-T6 is investigated. Also it is<br />
known that the study of the influence of various parameters <strong>on</strong> fretting fatigue behavior of materials is costly<br />
and time c<strong>on</strong>suming, numerical simulati<strong>on</strong> is a cheap and easy to use tool by means of which fretting<br />
Copyright © <str<strong>on</strong>g>2011</str<strong>on</strong>g> by Laboratory Soete<br />
3
Sustainable C<strong>on</strong>structi<strong>on</strong> and Design <str<strong>on</strong>g>2011</str<strong>on</strong>g><br />
fatigue phenomen<strong>on</strong> can be characterized. Thus, the effect of temperature is studied using numerical<br />
codes such as ABAQUS [9] and FRANC2D/L [10]. Finally, the numerical results are validated by fretting<br />
fatigue tests.<br />
2 EXPERIMENTS<br />
2.1 Material and specimen<br />
The specimen is machined from aluminum 7075-T6 forged plates by wire electrical discharge method. The<br />
l<strong>on</strong>gitudinal tensile properties (al<strong>on</strong>g the loading axis) were determined, i.e., the elastic modulus was 70<br />
GPa and yield strength was 502 MPa. The specimen shown in Figure 6 had a width of 14.5 mm, a<br />
thickness of 4.5 mm and a gauge length of 70 mm. The pads are made of stainless steel 410 with yield and<br />
ultimate strength of 420 and 700 MPa, respectively. Each pad has two bases (c<strong>on</strong>tacting surfaces) through<br />
which the load is exerted <strong>on</strong> the specimen. The bases have a thickness of 3.1 mm and a length of 12 mm<br />
(figure 7).<br />
Figure 6. Flat specimens used for fretting fatigue tests.<br />
Figure 7. Pad used in the<br />
experiments.<br />
2.2 Test setup and procedure<br />
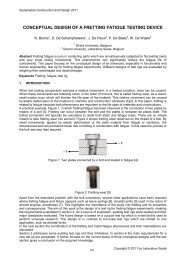
The fretting fatigue testing device used in this work has been developed by Majzoobi and Hojjati et al. [11].<br />
A general view of the device and its diagrammatic representati<strong>on</strong> are illustrated in Figure 8. The axial<br />
fluctuating load is applied to the specimen by a variable crank mechanism. The mechanism c<strong>on</strong>sists mainly<br />
of a stepped eccentric shaft and two suspensi<strong>on</strong> plates [11]. The c<strong>on</strong>tact loading system, shown in Figure<br />
9, is completely embedded in the lower cross head which is supported by the two main columns of the<br />
device and can be moved vertically. The c<strong>on</strong>tact loading system c<strong>on</strong>sists of two pads, two adjusting screws<br />
and two load cells.<br />
The c<strong>on</strong>tact load is induced by two adjusting screws and is measured using two load cells. The load cell<br />
readings can ensure that the c<strong>on</strong>tact loads produced by tightening screws in two opposite directi<strong>on</strong>s are<br />
equal. The c<strong>on</strong>tact is of the type of flat <strong>on</strong> flat. The pads are c<strong>on</strong>strained to move vertically as this may<br />
affect the sliding oscillati<strong>on</strong>s between specimen and pads.<br />
Upper cross head<br />
Lower<br />
cross<br />
head<br />
Axial Load<br />
cell<br />
C<strong>on</strong>tact<br />
assembly<br />
Specimen<br />
holder<br />
Adjusting<br />
screw<br />
C<strong>on</strong>tact load<br />
cell<br />
Chassis<br />
Variable crank<br />
system<br />
Specimen<br />
Pads<br />
Figure 8. A general view of the testing<br />
device [11].<br />
Figure 9. C<strong>on</strong>tact loading system of the<br />
testing device [11].<br />
Copyright © <str<strong>on</strong>g>2011</str<strong>on</strong>g> by Laboratory Soete<br />
4
Sustainable C<strong>on</strong>structi<strong>on</strong> and Design <str<strong>on</strong>g>2011</str<strong>on</strong>g><br />
Two load cells are mounted between the adjusting screws and the pads (see figure 9) m<strong>on</strong>itor the c<strong>on</strong>tact<br />
load <strong>on</strong> separate digital displays. The frequency of the device can vary using an inverter up to a maximum<br />
of 25 Hz. Two heating blowers <strong>on</strong> each side of the specimen were used to achieve the test temperature<br />
(Figure 10). The test temperature was measured and c<strong>on</strong>trolled using K-type thermocouples attached <strong>on</strong><br />
the pad surface and m<strong>on</strong>itored with digital display (Figure 11). Since the temperatures at the c<strong>on</strong>tact area<br />
and pads might be different, each test was c<strong>on</strong>ducted after measuring temperatures <strong>on</strong> the specimen and<br />
pads using a temperature calibrati<strong>on</strong> specimen. Before each test, the specimen was kept at 260°C for<br />
about an hour to have a uniform temperature distributi<strong>on</strong> over the gauge area of encompassing the c<strong>on</strong>tact<br />
area. Further details about test setup can be found in reference [11]. The experiments are c<strong>on</strong>ducted for<br />
stress ratio, R=0.1, frequency of 25 HZ at a c<strong>on</strong>stant force of F=1200 N, and working stresses of 110, 150,<br />
200, and 280 MPa. Furthermore, in order to validate the fretting fatigue tests results a number of tensile<br />
tests were c<strong>on</strong>ducted <strong>on</strong> specimens at different temperatures and the ultimate strength of material was<br />
measured. For each temperature, the specimens were heated up in a furnace for different time durati<strong>on</strong>s.<br />
This is because the durati<strong>on</strong> of fatigue tests depends <strong>on</strong> stress level and for low stresses; the specimens<br />
are exposed to heating for l<strong>on</strong>ger time. Also fractography of fractured surfaces and metallography are<br />
performed using optical microscopy.<br />
Figure 10. Heating blower<br />
Figure 11. Temperature display<br />
2.3 Test results<br />
The results of fretting fatigue tests <strong>on</strong> heated specimens and variati<strong>on</strong> of fretting fatigue life versus<br />
maximum stress in each temperature is illustrated in Figures 12 and 13. It can be clearly observed that<br />
fretting fatigue life increases with temperature for low stresses and decreases for high stresses. This<br />
fluctuati<strong>on</strong> in fretting fatigue life versus temperature is thought to be basically due to degradati<strong>on</strong> of material<br />
properties which occurs by overaging and wear resistance increase due to oxidati<strong>on</strong> of aluminum alloy.<br />
This can be explained more by the fact that aluminum comes in heat-treatable and n<strong>on</strong>-heat treatable<br />
alloys. Heat treatable aluminum alloys get their strength from a process called ageing. While the workability<br />
index in the 7075 alloy is improved approximately 50% by over-aging, significant decrease in tensile<br />
strength can occur when aluminum is subjected to over-aging.<br />
Figure 12. Maximum stress versus fretting fatigue life for different temperatures<br />
Copyright © <str<strong>on</strong>g>2011</str<strong>on</strong>g> by Laboratory Soete<br />
5
Sustainable C<strong>on</strong>structi<strong>on</strong> and Design <str<strong>on</strong>g>2011</str<strong>on</strong>g><br />
Figure 12. Maximum stress versus fretting fatigue life for different temperatures<br />
After process of heating the material is ductile, since no precipitati<strong>on</strong> has occurred. After a time the solute<br />
material precipitates and hardening develops. As the compositi<strong>on</strong> reaches its saturated normal state, the<br />
material reaches its maximum hardness. The precipitate, however, c<strong>on</strong>tinues to grow. The fine precipitates<br />
disappear. They have grown larger, and as a result the tensile strength of the material decreases. This is<br />
called overaging. The tensile strength variati<strong>on</strong> during aging and overaging are shown in Figure 14. While<br />
overaging gives rise to degradati<strong>on</strong> of mechanical strength of material and hence the reducti<strong>on</strong> of its fretting<br />
fatigue life, surface oxidati<strong>on</strong> of the specimens brings about improvement of fatigue behavior of the<br />
material. From the tensile tests the variati<strong>on</strong> of the ultimate strength shows that strength of material<br />
decreases as temperature rises (Figure 15).<br />
Figure 14. The effect of ageing <strong>on</strong> strength of<br />
aluminum<br />
Figure 15. Stress versus strain curve for deferent<br />
temperatures<br />
Optical examinati<strong>on</strong> of the specimens in Figure 16 reveals that temperature results in precipitati<strong>on</strong> of<br />
impurities of al-7075-T6. The size of precipitated impurities and their distances gets bigger as temperature<br />
increases. This could be a reas<strong>on</strong> for material degradati<strong>on</strong> of specimens which are exposed to heating for<br />
l<strong>on</strong>ger time durati<strong>on</strong>. However, to the best of authors’ belief, the ageing phenomen<strong>on</strong> can be recognized as<br />
the most effective parameter and resp<strong>on</strong>sible for the reducti<strong>on</strong> of fretting fatigue life of specimens at high<br />
stresses and at low stresses oxidati<strong>on</strong> of aluminum alloy at c<strong>on</strong>tact surface of specimen and pad plays as a<br />
lubricant role that causes a significant rise in fretting fatigue life.<br />
Copyright © <str<strong>on</strong>g>2011</str<strong>on</strong>g> by Laboratory Soete<br />
6
Sustainable C<strong>on</strong>structi<strong>on</strong> and Design <str<strong>on</strong>g>2011</str<strong>on</strong>g><br />
Figure 16. The microstructure of the material (a) at 20°c, (b) at 150°,<br />
(c) at 250°c and (d) at 350°c for 12 hours (magnificati<strong>on</strong> x 1000)<br />
Fractured surfaces of tested specimens were examined using optical microscopy. Some typical results are<br />
illustrated in Figures.17 and 18 for different temperatures at different stresses. As the figures suggest, the<br />
fracture surfaces typically c<strong>on</strong>sist of two different regi<strong>on</strong>s; a fatigue z<strong>on</strong>e created by crack propagati<strong>on</strong> and<br />
a tensile regi<strong>on</strong> which gives rise to fracture of specimen when it is sufficiently weakened by the crack z<strong>on</strong>e<br />
development.<br />
3 mm 3 mm<br />
Figure 17. Fracture surface of specimen at<br />
stress of 110 MPa and 350°c<br />
Figure 18. . Fracture surface of specimen at<br />
stress of 280 MPa and 250°c<br />
3 NUMERICAL SIMULATIONS<br />
3.1 Finite element analysis<br />
A commercial finite element code, ABAQUS [9], was used to analyse the specimen without crack under a<br />
given loading c<strong>on</strong>diti<strong>on</strong> as a first step. This analyse was d<strong>on</strong>e in order to predicate locati<strong>on</strong> of initial crack<br />
for crack propagati<strong>on</strong> analyse, since previous studies suggests that the locati<strong>on</strong> of fretting fatigue crack<br />
initiati<strong>on</strong> corresp<strong>on</strong>ds with a maximum value of σ xx [1, 12]. The finite element model for flat pad is shown in<br />
Figure 19. Note that <strong>on</strong>ly <strong>on</strong>e-quarter of the test c<strong>on</strong>figurati<strong>on</strong> is c<strong>on</strong>sidered due to double symmetry with<br />
respect to the X and Y axes. Al<strong>on</strong>g with the ‘‘master-slave’’ interfacial algorithm developed for c<strong>on</strong>tact<br />
modelling in the finite element code, ABAQUS, the four-node plane strain elements were utilized. The<br />
Lagrange multiplier of fricti<strong>on</strong> was used. First, specimens were analyzed using the c<strong>on</strong>tact force, F/2 and<br />
the axial stress, σ axil . These were applied to the finite element model in the three steps. In the first step, the<br />
c<strong>on</strong>tact force, F/2 was applied to establish c<strong>on</strong>tact between pad and specimen. In the sec<strong>on</strong>d and third<br />
steps, either the maximum bulk stress, σ Max or the minimum bulk stress, σ Min , were applied, respectively. In<br />
order to have more accurate results, the finite element mesh was refined in the c<strong>on</strong>tact regi<strong>on</strong>. An<br />
acceptable element size was determined to be at least 9 µm x 9 µm in the refined c<strong>on</strong>tact z<strong>on</strong>e from the<br />
Copyright © <str<strong>on</strong>g>2011</str<strong>on</strong>g> by Laboratory Soete<br />
7
Sustainable C<strong>on</strong>structi<strong>on</strong> and Design <str<strong>on</strong>g>2011</str<strong>on</strong>g><br />
c<strong>on</strong>vergence study [13]. The fretting fatigue crack propagati<strong>on</strong> was thereafter c<strong>on</strong>ducted using the finite<br />
element code, FRANC2D/L [10]. For this purpose, the same geometry and boundary c<strong>on</strong>diti<strong>on</strong>s as used in<br />
ABAQUS code including the c<strong>on</strong>tact interface was modeled. The c<strong>on</strong>tact was defined with a gap element<br />
using a new material at interface of pad and specimen, with coefficient of fricti<strong>on</strong> equal to 0.5. This means<br />
that in each step for crack propagati<strong>on</strong> the effect of c<strong>on</strong>tact pad was c<strong>on</strong>sidered and the stress intensity<br />
factors were updated after each crack increment. This proposed technique would solve most problems in<br />
previous studies where sub-modeling was used for crack propagati<strong>on</strong> [13]. Then, the temperature<br />
distributi<strong>on</strong> also was generated <strong>on</strong> material-by-material basis which has capability to assign different<br />
coefficient of thermal expansi<strong>on</strong> and <strong>on</strong>e temperature for the entire model [10]. Finally, an edge crack was<br />
inserted in the model c<strong>on</strong>sidering the c<strong>on</strong>tact to perform the crack growth analysis by FRANC2D/L code,<br />
which has capability for incremental crack growth using fracture mechanics principles as elaborated later.<br />
Figure 19. The schematic illustrati<strong>on</strong> of finite element model of fretting Fatigue assembly.<br />
3.2 Crack propagati<strong>on</strong> analysis<br />
The crack propagati<strong>on</strong> needs the locati<strong>on</strong>, length and orientati<strong>on</strong> of the initial crack. As menti<strong>on</strong>ed above<br />
the locati<strong>on</strong> of initial crack extract from the FE model using ABAQUS code where the maximum value of σ xx<br />
takes place, the length and the orientati<strong>on</strong> of the crack propagati<strong>on</strong> path was represented by a curvilinear<br />
path c<strong>on</strong>sisting of, S, straight segments, as shown in Figure 20. In the first step, an initial crack of length, (l 0<br />
=0.01 mm), with an orientati<strong>on</strong>, ( 1 =45 ) from the y-axis was introduced <strong>on</strong> the c<strong>on</strong>tact surface which is<br />
observed from previous experimental studies results [14]. The analysis was then performed with a crack<br />
length increment of ∆l. The incremented crack kinked at the tip of the initial crack at (x 2 ,y 2 ) to produce a<br />
new crack at a slope of 2 in the sec<strong>on</strong>d step of the analysis, and this process was c<strong>on</strong>tinued.<br />
In FRANC2D/L, the mesh is modified in each incremental step using the Suhara-Fukuda algorithm [15]; the<br />
algorithm generates a mesh of triangular elements as shown in Figure 21, and the new crack geometry is<br />
represented at each incremental step to reflect the current crack c<strong>on</strong>figurati<strong>on</strong>. Al<strong>on</strong>g with other theories,<br />
the code uses the maximum tangential stress theory, proposed by Erdogan and Sih [16], to determine the<br />
crack growth directi<strong>on</strong>. The crack angle, i at the ith step was computed by<br />
⎡ 2 ⎤<br />
−1<br />
K<br />
⎢ IMax<br />
− K<br />
IMax<br />
+ 8K<br />
IIMax<br />
θ = +<br />
⎥<br />
i θ<br />
i−1<br />
2 tan<br />
(1)<br />
⎢ 4K<br />
⎥<br />
⎣<br />
IIMax ⎦<br />
Where K IMaxi and K IIMaxi are the maximum stress intensity factors at the ith step corresp<strong>on</strong>ding to the two<br />
crack propagati<strong>on</strong> modes, Mode I and Mode II, at the maximum load. In this way crack trajectory was<br />
developed incrementally for a given loading c<strong>on</strong>diti<strong>on</strong> using maximum tensile stress criteri<strong>on</strong>. Further, the<br />
crack growth rate was assumed to be governed by the Mode I stress intensity factors, K IMax and K Imin [17].<br />
The modified crack closure integral technique of Rybicki and Kanninen [18] was used to calculate these<br />
stress intensity factors. These values were then used with the sigmoidal crack growth model to determine<br />
the crack propagati<strong>on</strong> life. ∆l was c<strong>on</strong>sidered 0.1 mm for crack propagati<strong>on</strong>. Final failure occurs when the<br />
value of stress intensity factor, K I tends to its critical value, K IC .<br />
Copyright © <str<strong>on</strong>g>2011</str<strong>on</strong>g> by Laboratory Soete<br />
8
Sustainable C<strong>on</strong>structi<strong>on</strong> and Design <str<strong>on</strong>g>2011</str<strong>on</strong>g><br />
Figure 20. Trajectory of crack growth<br />
Figure 21. An initial crack in FRANC2D/L<br />
and triangular elements around the crack.<br />
FRANC2D/L CRACK GROWTH (N40_F2DL_CG) code was used in order to predict the crack growth life<br />
time curve. This program, realized by Domenico [19], calculates crack growth life in generic 2D layered<br />
structures. The core of the program is Franc2D/L (based <strong>on</strong> Franc2D, Copyright (C) Paul 'Wash'<br />
Wawrzynek and T<strong>on</strong>y Ingraffea) [10], which is used to extract stress intensity factors (SIF) history files for<br />
generic geometries and sets of loads. N40_F2DL_CG imports SIF history files and integrates the material<br />
da/dN equati<strong>on</strong> (NASGRO model) for calculating crack growth for variable amplitude spectrum of loads.<br />
FRANC2D/L CRACK GROWTH code is able to show the amount of KI, KII and ∆K in every increment of<br />
crack propagati<strong>on</strong> and it is designed to deal with Forman NASGRO material models (equati<strong>on</strong> 2). The<br />
elements of the NASGRO crack growth rate equati<strong>on</strong> were developed by Forman and Newman at NASA,<br />
and it has been implemented in FRANC2D/L CRACK GROWTH as follows [20]:<br />
⎡<br />
⎢<br />
⎣<br />
da<br />
= C<br />
dN<br />
n<br />
⎛<br />
⎜<br />
∆K<br />
1−<br />
th<br />
( 1−<br />
f ) ⎤ ⎝ ∆K<br />
⎠<br />
∆K<br />
( R) ⎥<br />
1−<br />
p<br />
⎦<br />
⎛<br />
⎜<br />
⎝<br />
K<br />
1−<br />
max<br />
K<br />
crit<br />
Where C, n, p and q are empirical c<strong>on</strong>stants, which are obtained by curve fitting the test data and f is<br />
the ratio of crack opening SIF to maximum SIF. The value of f is related to stress (load) ratio, flow stress<br />
and the plane stress/strain c<strong>on</strong>straint factor. These values are provided by the FRANC2D/L CRACK<br />
GROWTH material database for each material. It is worth menti<strong>on</strong>ing that ΔK th is not a simple threshold<br />
stress intensity range for l<strong>on</strong>g crack, but it includes the effect of short crack by involving ‘intrinsic crack<br />
length’, and the parameter f. Also C=6x10 -10 and n=2.51 was used as fatigue ductility exp<strong>on</strong>ent [21], hence<br />
number of the cycles (dN) for a crack grow (da) in each increment, can be computed. Finally, the specimen<br />
fracture life was obtained.<br />
3.3 Finite element results and the effect of temperature <strong>on</strong> crack propagati<strong>on</strong><br />
Figure 22 reveals the stress c<strong>on</strong>tours for V<strong>on</strong>-Mises stress. It is interesting to note that the maximum v<strong>on</strong>-<br />
Mises stress occurs near the sharp edge c<strong>on</strong>tact between the pad and the specimen. The simulati<strong>on</strong>s were<br />
validated by making a comparis<strong>on</strong> between the number of cycles as predicted by numerical simulati<strong>on</strong>s in<br />
this work and the experimental measurements using replica. The results are shown in Figure 23 for<br />
different stress at temperature 150°C. As the results suggest a maximum of 22% difference is observed<br />
that is quite normal in fatigue c<strong>on</strong>text.<br />
⎞<br />
⎟<br />
⎞<br />
⎟<br />
⎠<br />
p<br />
(2)<br />
Copyright © <str<strong>on</strong>g>2011</str<strong>on</strong>g> by Laboratory Soete<br />
9
Sustainable C<strong>on</strong>structi<strong>on</strong> and Design <str<strong>on</strong>g>2011</str<strong>on</strong>g><br />
Figure 22. v<strong>on</strong>-Mises equivalent stress distributi<strong>on</strong> of fretting pairs<br />
(σ axial =280 Mpa and F= 1200)<br />
Figure 23. A comparis<strong>on</strong> between experimental and numerical crack growth<br />
4. CONCLUSIONS<br />
The experimental results reveal that fretting fatigue life of the material increases with temperature by 180%<br />
for low stresses and decreases by 40% for high stresses This fashi<strong>on</strong> of variati<strong>on</strong> of fretting fatigue life<br />
versus temperature is believed to be due to degradati<strong>on</strong> of material properties which occurs by overaging<br />
and wear resistance increase due to oxidati<strong>on</strong> of aluminum alloy. While overaging gives rise to degradati<strong>on</strong><br />
of mechanical strength of material and hence the reducti<strong>on</strong> of its fretting fatigue life, surface oxidati<strong>on</strong> of the<br />
specimens brings about improvement of fatigue behavior of the material. The variati<strong>on</strong> of the ultimate<br />
strength versus temperature that is obtained from the tensile tests reveals the same trend as observed for<br />
fretting fatigue life versus temperature at different stress levels. Metallurgical examinati<strong>on</strong> of the specimens<br />
reveals the size of precipitated impurities and their distances gets bigger as temperature increases. This<br />
could be a reas<strong>on</strong> for material degradati<strong>on</strong> of specimens which are exposed to heating for l<strong>on</strong>ger time<br />
durati<strong>on</strong>.<br />
Numerical simulati<strong>on</strong> of fretting fatigue was performed using Abaqus and FRANC2D/L codes. The former<br />
predicts the normal and tangential c<strong>on</strong>tact stress distributi<strong>on</strong>s and the latter calculates the number of cycles<br />
required for a known crack propagati<strong>on</strong> rate at elevated temperature. The calculati<strong>on</strong> of cycles is based <strong>on</strong><br />
Forman NASGRO equati<strong>on</strong> when ∆K is computed by FRANC2D/L then it is possible to predict the cycles<br />
for a specific value of crack growth. The results indicate that the numerical simulati<strong>on</strong>s are capable of<br />
predicti<strong>on</strong> the crack growth cycles and orientati<strong>on</strong> at different stresses and temperatures. The computed<br />
crack propagati<strong>on</strong> lives were compared to the results of experimental study where total fatigue life was<br />
measured.<br />
Copyright © <str<strong>on</strong>g>2011</str<strong>on</strong>g> by Laboratory Soete<br />
10
Sustainable C<strong>on</strong>structi<strong>on</strong> and Design <str<strong>on</strong>g>2011</str<strong>on</strong>g><br />
5. ACKNOWLEDGEMENTS<br />
The authors wish to thank the Ghent University for the financial support received by the Special Funding of<br />
Ghent University (Bijz<strong>on</strong>der Onderzoeksf<strong>on</strong>ds), in the framework of BOF project (BOF 01N02410).<br />
6. REFERENCES<br />
[1] Hills DA, Nowell D. Mechanics of fretting fatigue. Kluwer Academic Publisher, 1994.<br />
[2] Shin. Ki S. Predicti<strong>on</strong> of fretting fatigue behavior under elastic-plastic c<strong>on</strong>diti<strong>on</strong>s. Mechanical<br />
Science and Technology 2009;23:2714-2721.<br />
[3] Majzoobi GH, Ahmadkhani AR. The effects of multiple re-shot peening <strong>on</strong> fretting fatigue behavior<br />
of Al7075-T6. Surface & Coatings Technology 2010;205(1):102-109.<br />
[4] Stachowiak GW, Batchelor AW. Engineering Tribology. Butterworth Heinemann publisher, 2001.<br />
[5] Hamdy MM, Waterhouse RB. The fretting wear of ti-6al-4v and aged inc<strong>on</strong>el 718 at elevatedtemperatures.<br />
Wear 1981;71(2):237-248.<br />
[6] Mutoh Y, Satoh T. High temperature fretting fatigue. Mechanical Engineering Publicati<strong>on</strong>, 1994.<br />
[7] Hamdy MM, Waterhouse RB. The fretting fatigue behaviour of Ti-6A1-4V at temperatures up to 600<br />
°C. Wear 1979;56:1-8.<br />
[8] Jina, O., Mallb S, Sahanb O. Fretting fatigue behavior of Ti-6Al-4V at elevated temperature. Int J<br />
Fatigue 2005;27:395-401.<br />
[9] ABAQUS v 6.10, Standard User Manual, 2010.<br />
[10] FRANC2D/L. A crack propagati<strong>on</strong> simulator for plane layered structures. Engineering SoCaE,<br />
editor. Ithaca, New York Cornell University, 1998.<br />
[11] Majzoobi GH, Hojjati R, Nematian M, Zalnejad E, Ahmadkhani AR. A new device for fretting fatigue<br />
testing. Transacti<strong>on</strong>s of The Indian Institute of Metals 2010;63(2-3):5.<br />
[12] Ruiz C, Boddingt<strong>on</strong> PHB, Chen KC. AN INVESTIGATION OF FATIGUE AND FRETTING IN A<br />
DOVETAIL JOINT. Experimental Mechanics 1984;24(3):208-217.<br />
[13] Fadag HA, Mall S, Jain VK. A finite element analysis of fretting fatigue crack growth behavior in Ti-<br />
6Al-4V. Eng Fract Mech 2008;75(6):1384-1399.<br />
[14] Lykins CD, Mall S, Jain V. A shear stress-based parameter for fretting fatigue crack initiati<strong>on</strong>.<br />
Fatigue Fract Eng Mater Struct 2001;24(7):461-473.<br />
[15] Shaw RD, Pitchen RG. MODIFICATIONS TO SUHARA-FUKUDA METHOD OF NETWORK<br />
GENERATION. <str<strong>on</strong>g>Internati<strong>on</strong>al</str<strong>on</strong>g> Journal for Numerical Methods in Engineering 1978;12(1):93-99.<br />
[16] Erdogan F, Sih G. On the crack extensi<strong>on</strong> in plates under plane loading and transverse shear.<br />
Journal of Basic Engineering Trans ASME 1963;85(4):519-527.<br />
[17] Shkarayev S, Mall S. Computati<strong>on</strong>al modelling of shot-peening effects <strong>on</strong> crack propagati<strong>on</strong> under<br />
fretting fatigue. The Journal of Strain Analysis for Engineering Design 2003;38(6):495-506.<br />
[18] Rybicki EF, Kanninen MF. A finite element calculati<strong>on</strong> of stress intensity factors by a modified crack<br />
closure integral. Eng Fract Mech 1977;9(4):931-938.<br />
[19] Quaranta D. FRANC2D/L CRACK GROWTH: A crack propagati<strong>on</strong> simulator for plane layered<br />
structures (based <strong>on</strong> Franc2D, Copyright (C) Paul 'Wash' Wawrzynek and T<strong>on</strong>y Ingraffea). Ltd PA,<br />
editor. Switzerland.<br />
[20] Forman RG, Mettu SR. Behavior of Surface and Corner Cracks Subjected to Tensile and Bending<br />
Loads in Ti-6Al-4V Alloy. Fracture Mechanics 22nd Symposium, Vol. 1 Philadelphia: ASTM STP<br />
1131, H.A. Ernst, A. Saxena and D.L. McDowell, eds., American Society for Testing and Materials,<br />
1992.<br />
[21] Wang QY, Pidaparti RM. Static characteristics and fatigue behavior of composite-repaired<br />
aluminum plates. Composite Structures 2002;56(2):151-155.<br />
Copyright © <str<strong>on</strong>g>2011</str<strong>on</strong>g> by Laboratory Soete<br />
11
Sustainable C<strong>on</strong>structi<strong>on</strong> and Design <str<strong>on</strong>g>2011</str<strong>on</strong>g><br />
DRY SLIDING FRICTION AND WEAR RESPONSE OF WC-CO<br />
HARDMETAL PAIRS IN LINEARLY RECIPROCATING AND ROTATING<br />
CONTACT<br />
Y. Perez Delgado 1 , K. B<strong>on</strong>ny 1 , P. De Baets 1 , P.D. Neis 1 , V. Rodriguez Fereira 1 , O. Malek 2,3 , J.<br />
Vleugels 2 , B. Lauwers 3<br />
1 Ghent University, Laboratory Soete, Belgium<br />
2 Catholic University of Leuven, Metallurgy and Materials Engineering Department, Belgium<br />
3 Catholic University of Leuven, Mechanical Engineering Department, Belgium<br />
Abstract This paper presents an experimental evaluati<strong>on</strong> of fricti<strong>on</strong> and wear properties of WC-Co<br />
cemented carbides. A comparis<strong>on</strong> is made between unlubricated rotating and linearly reciprocating pin-<strong>on</strong>plate<br />
sliding pairs. The plate specimens were WC-10wt%Co grades surface finished by polishing or<br />
sequential wire-EDM steps, whereas WC-6wt%Co pins were used as counter body. The tests were carried<br />
out at room temperature using a sliding speed of 0.30m/s and mean Hertzain c<strong>on</strong>tact pressures of 1.76 and<br />
2.08 GPa, i.e., normal c<strong>on</strong>tact loads of 15N and 25N, respectively. The worn surfaces <strong>on</strong> plate samples<br />
were quantified in terms of 2–D wear profiles obtained by means of surface topography scanning<br />
equipment. Wear mechanisms such as polishing and abrasi<strong>on</strong> were identified using optical microscopy.<br />
Inferior tribological characteristics for wire-EDM surface finish compared to polishing were found. Higher<br />
fricti<strong>on</strong> coefficient and wear levels were measured in unidirecti<strong>on</strong>al rotating sliding experiments compared<br />
to linearly reciprocating test c<strong>on</strong>diti<strong>on</strong>s.<br />
Keywords fricti<strong>on</strong> and wear, wire-EDM, wear particles, reciprocating and rotating sliding c<strong>on</strong>tact.<br />
1 INTRODUCTION<br />
Inspired by ec<strong>on</strong>omical and especially ecological motives, engineers have developed new or improved<br />
materials able to operate in harsh envir<strong>on</strong>ments, e.g., high temperature, unlubricated c<strong>on</strong>tact, abrasive or<br />
erosive circumstances, corrosive surroundings, etc. to which machine elements (gears, brakes, bearings,<br />
etc.) and tools ( punches, dies, cutting tools, etc.) are often exposed. Currently, hardmetals are widely<br />
used for those applicati<strong>on</strong>s due to their excellent mechanical properties having unique combinati<strong>on</strong> of high<br />
hardness, strength, resistance to compressive deformati<strong>on</strong>, wear and corrosi<strong>on</strong> resistance at high<br />
temperatures [1]. Cobalt (Co) is the most preferred binder in WC-based hardmetals due to its outstanding<br />
wetting and adhesi<strong>on</strong> characteristics in combinati<strong>on</strong> with tungsten carbide (WC), leading to unique<br />
properties [2]. Nevertheless, some disadvantages such as high hardness make it intrinsically difficult to<br />
shape by means of traditi<strong>on</strong>al machining techniques such as grinding with bor<strong>on</strong> nitride and/or diam<strong>on</strong>d.<br />
Electrical Discharge Machining (EDM) allows the producti<strong>on</strong> of complex shapes. However, this machining<br />
process could degrade the surface quality in c<strong>on</strong>sequence of mechanical and thermal impact. Some<br />
research has already been performed <strong>on</strong> the effects of wire-EDM <strong>on</strong> fricti<strong>on</strong> and wear behaviour of WC-Co<br />
cemented carbides in reciprocating sliding c<strong>on</strong>tact [3-5]. A problem, however, is the lack of knowledge of<br />
tribological behaviour of WC-10wt%Co cemented carbide <strong>on</strong> c<strong>on</strong>tinuous unidirecti<strong>on</strong>al rotating sliding<br />
c<strong>on</strong>tact.<br />
This paper aims to evaluate and compare the fricti<strong>on</strong> and wear resp<strong>on</strong>se of cemented carbides in<br />
reciprocating and rotating sliding c<strong>on</strong>tact, and examines how the tribological characteristics are affected by<br />
the geometry of the sliding moti<strong>on</strong> (linearly reciprocating or unidirecti<strong>on</strong>ally rotating), interacti<strong>on</strong> of wear<br />
particles, c<strong>on</strong>tact loading and surface finish.<br />
12<br />
Copyright © <str<strong>on</strong>g>2011</str<strong>on</strong>g> by Laboratory Soete
Sustainable C<strong>on</strong>structi<strong>on</strong> and Design <str<strong>on</strong>g>2011</str<strong>on</strong>g><br />
2 EXPERIMENTAL PROCEDURE<br />
The WC-10wt%Co cemented carbide was produced by liquid phase sintering. The physical and mechanical<br />
properties of WC-10wt%Co are listed in Table 1 as a functi<strong>on</strong> of chemical and microstructural features. The<br />
Vickers hardness was measured with indentati<strong>on</strong> weights of 10 kg (Model FV-700, Future-Tech Corp.,<br />
Tokyo, Japan). The grain size distributi<strong>on</strong> was acquired using computer analysis software by the linear<br />
intercept method. The fracture toughness, KIC,10kg, was obtained by Vickers indentati<strong>on</strong> using the formula<br />
of Shetty [6]. The Young’s modulus, E, was obtained by the res<strong>on</strong>ance frequency method (ASTM C 1259-<br />
94) <strong>on</strong> a Grindo-s<strong>on</strong>ic (J.W. Lemmens, Elektr<strong>on</strong>ika N.V., Leuven, Belgium). The electrical resistivity was<br />
obtained by the 4-point c<strong>on</strong>tact method using a Resistomat Mikroohmmeter (Type 2302, Gernsbach,<br />
Germany).<br />
Table 1. Chemical, microstructural, mechanical and physical properties of WC-10wt%Co cemented carbide.<br />
Chemical properties Microstructure Mechanical properties Physical properties<br />
d av d 50 d 90 HV10 K IC(10kg) E -modulus<br />
Electrical<br />
Density<br />
Binder amount<br />
[Mpa<br />
resistivity<br />
[m] [m] [m] [kg/mm 2 ] mm 0.5 [g/mm 3 ]<br />
] [GPa]<br />
[10 -6 Ω m]<br />
10 wt% Co 2.2 1.8 4.2 1149 ± 10 >14.9 ± 0.1 578 ± 6 14.33 1.3<br />
The WC-10wt%Co samples were machined and surface finished by wire-EDM or polishing. The polished<br />
surface variant was obtained by initially performing a grinding process using JF415DS grinding equipment<br />
(Jung, Göppingen, Germany) by means of a diam<strong>on</strong>d abrasive wheel (type MD4075B55, Wendt Boart,<br />
Brussels, Belgium). The subsequent polishing operati<strong>on</strong> was carried out with micrometer sized diam<strong>on</strong>d<br />
paste up to optical finish. On the other hand, the wire-EDM surface finishing procedure was performed <strong>on</strong> a<br />
ROBOFIL 2000 (Charmilles Technologies, Switzerland) in de-i<strong>on</strong>ized water (dielectric c<strong>on</strong>ductivity 11<br />
µS/cm), using brass (CuZn37) wire electrode with diameter 0.25 mm and tensile strength 500 MPa. In this<br />
paper, the rough and finest EDM surface finishes E2 and E24, respectively, were selected for sliding wear<br />
experiments. The corresp<strong>on</strong>ding wire-EDM settings are listed in Table 2. Additi<strong>on</strong>al informati<strong>on</strong> <strong>on</strong> the wire-<br />
EDM operati<strong>on</strong> of the composites is given in [7,8].<br />
Table 2. Device setting and parameters for rough and finer cutting regimes<br />
Wire-EDM regime E2 E24<br />
Cut Rough Fine<br />
Open voltage [V] -80 120<br />
Pulse durati<strong>on</strong>, t e [ms] 2.1 0.4<br />
Pulse interval, t o [ms] 10 0.6<br />
Reference servo voltage Aj [v] 46 0<br />
Pulse igniti<strong>on</strong> hieght IAL [A] 10 6<br />
Flushing pressure [bar] 15 0<br />
Wire tensi<strong>on</strong> [N] 1 1<br />
Wire winding speed [m/min] 9.6 8<br />
The surface roughness of the WC-Co cemented carbide with wire-EDM and polished surface finish was<br />
measured according to the ISO 4288 standard. The resulting Ra roughness values are summarized in<br />
Table. 3. Am<strong>on</strong>gst the wire-EDM’ed composites, the highest roughness level is encountered with E2,<br />
whereas polished specimens are discerned to display the smoothest surface.<br />
13<br />
Copyright © <str<strong>on</strong>g>2011</str<strong>on</strong>g> by Laboratory Soete
Sustainable C<strong>on</strong>structi<strong>on</strong> and Design <str<strong>on</strong>g>2011</str<strong>on</strong>g><br />
Table 3. Surface roughness of polished, rough and fine wire-EDM’ed cemented carbide<br />
Surface finish Polishing E2 E24<br />
R a (µm) ≤ 0.02 2.08 0.15<br />
Sliding wear testing was c<strong>on</strong>ducted using two different c<strong>on</strong>figurati<strong>on</strong>s: (i) a Plint TE77 machine with linear<br />
reciprocating pin-<strong>on</strong>-plate c<strong>on</strong>tact according to the ASTM G133 standard, and (ii) a CSM tribometer with<br />
rotating pin-<strong>on</strong>-disk c<strong>on</strong>tact in accordance with the ASTM G99-95a standard, respectively. Each wear<br />
experiment was performed in unlubricated c<strong>on</strong>diti<strong>on</strong>s and in ambient air, i.e., 23 ± 1 and 60 ± 1 % relative<br />
humidity. Schematic illustrati<strong>on</strong>s of the applied linearly reciprocating pin-<strong>on</strong>-flat and rotating pin-<strong>on</strong>-disk<br />
sliding wear system are outlined in Figure 1.<br />
(A)<br />
Figure 1. Geometric c<strong>on</strong>figurati<strong>on</strong> of A) reciprocating and B) rotating sliding test.<br />
(B)<br />
The pin material was a WC-6wt%Co cemented carbide (CERATIZIT grade MG12). The radius of the<br />
hemisphere was 4.04 mm, with an R a and R t surface roughness of 0.35 µm and 2.68 µm, respectively. The<br />
pin material displays an E-modulus of 609 GPa, a Vickers hardness HV10 of 1913 kg/mm 2 , a compressive<br />
strength of 7.2 GPa and fracture toughness K IC,10kg of 8.4 MPa m 1/2 . The counter plate samples were made<br />
of WC-10wt%Co cemented carbide and displayed dimensi<strong>on</strong>s of 58 mm x 38 mm x 4 mm. The test durati<strong>on</strong><br />
was associated with a sliding distance of 10km. Normal c<strong>on</strong>tact pressures of 1.76 and 2.08 GPa were<br />
imposed, i.e., c<strong>on</strong>tact loads of 15N and 25N, respectively, at a c<strong>on</strong>stant sliding velocity of 0.3 m/s.<br />
3 RESULTS AND DISCUSSION<br />
3.1 Effect of wear particles <strong>on</strong> fricti<strong>on</strong> and wear resp<strong>on</strong>se<br />
The influence of surface finishing operati<strong>on</strong>s and the imposed normal c<strong>on</strong>tact pressure <strong>on</strong> the tribological<br />
behavior of WC-10wt%Co is examined in Fig. 2, which compares polished and wire-EDM'ed test samples in<br />
reciprocating and rotating sliding c<strong>on</strong>tact with respect to their dynamic coefficient of fricti<strong>on</strong> resulting from a<br />
10 km sliding wear path, using WC-6wt%Co pins at a speed of 0.3 m/s together with normal pressures of<br />
1.76 and 2.08 GPa. Each value is an average of at least three sliding experiments with identical test<br />
parameters. The standard deviati<strong>on</strong> in fricti<strong>on</strong> coefficient between different samples of the same material<br />
was determined to be less than 5 %. The dynamic fricti<strong>on</strong> coefficient was discerned to vary within 0.45 –<br />
0.58. The differences in fricti<strong>on</strong> level between the distinctive surface finishing operati<strong>on</strong>s are quite<br />
pr<strong>on</strong>ounced. The dynamic fricti<strong>on</strong> coefficient is higher for wire-EDM surfaces compared to equivalent<br />
polished surface finish variant. Moreover, the highest fricti<strong>on</strong> levels are encountered with the roughest wire-<br />
EDM surface finish variant, i.e., E2. For instance, reciprocating pin-<strong>on</strong>-plate sliding with a c<strong>on</strong>tact load of 15<br />
N yielded a dynamic fricti<strong>on</strong> coefficient of 0.52 for surface finish variant E2, whereas dynamic fricti<strong>on</strong><br />
coefficients of 0.47 and 0.45 were obtained for the finer wire-EDM step E24 and polishing, respectively.<br />
Am<strong>on</strong>gst the various surface finishes and imposed normal c<strong>on</strong>tact pressures the WC-10wt%Co specimens<br />
are found to yield higher fricti<strong>on</strong> coefficient <strong>on</strong> rotating sliding compared to the reciprocating sliding moti<strong>on</strong>.<br />
Within the range of imposed c<strong>on</strong>tact pressures, the dynamic coefficient of fricti<strong>on</strong> is noticed to vary<br />
significantly. Indeed, raising the c<strong>on</strong>tact load is discerned to decrease the fricti<strong>on</strong> level.<br />
14<br />
Copyright © <str<strong>on</strong>g>2011</str<strong>on</strong>g> by Laboratory Soete
Sustainable C<strong>on</strong>structi<strong>on</strong> and Design <str<strong>on</strong>g>2011</str<strong>on</strong>g><br />
0.6<br />
0.55<br />
0.5<br />
)<br />
0<br />
k<br />
m<br />
(1 0.45<br />
Ν d<br />
0.4<br />
0.35<br />
0.3<br />
Polishing<br />
E24<br />
Surface finish<br />
E2<br />
1.76 GPa<br />
2.08 GPa<br />
C<strong>on</strong>tact pressure<br />
Figure 2. Dynamic fricti<strong>on</strong> coefficient as a functi<strong>on</strong> of surface finishing operati<strong>on</strong> for WC-10wt%Co slid at<br />
0.3 m/s with 15 and 25N c<strong>on</strong>tact load against WC-6wt%Co pins for 10 km<br />
The observed fricti<strong>on</strong> curves during the sliding wear tests increase rapidly throughout the first meters of<br />
sliding, subsequently decline and increase towards an equilibrium situati<strong>on</strong> (after running-in), in which<br />
fluctuati<strong>on</strong> in fricti<strong>on</strong> are c<strong>on</strong>siderably smaller in reciprocating sliding moti<strong>on</strong>. However, higher fluctuati<strong>on</strong>s<br />
in fricti<strong>on</strong> coefficient are observed in c<strong>on</strong>tinuous rotating sliding tests. These instabilities can be explained in<br />
terms of c<strong>on</strong>tinuous breaking and regenerating of micro-juncti<strong>on</strong>s at the c<strong>on</strong>tact surface. Additi<strong>on</strong>ally, it is<br />
apparent that the increase in fricti<strong>on</strong> coefficient can be attributed to the presence of wear particles at the<br />
sliding c<strong>on</strong>tact. In fact, there is a built-up of debris particles at the edge of the wear track that subsequently<br />
are pushed and clustering into the c<strong>on</strong>tact area, which are certainly related to small centrifugal force acti<strong>on</strong><br />
<strong>on</strong> the particles as c<strong>on</strong>sequence of the rotating moti<strong>on</strong>. This finding is in full agreement with the literature in<br />
the influence of wear particles, and the effect of reciprocating and rotating moti<strong>on</strong> [9-13]. A visual inspecti<strong>on</strong><br />
of worn surfaces after wear testing revealed the presence of wear debris accumulated at the edge of the<br />
wear tracks, but occasi<strong>on</strong>ally also within, al<strong>on</strong>g and adjacent to the wear tracks; see Figure 3.<br />
a)<br />
15<br />
Copyright © <str<strong>on</strong>g>2011</str<strong>on</strong>g> by Laboratory Soete
Sustainable C<strong>on</strong>structi<strong>on</strong> and Design <str<strong>on</strong>g>2011</str<strong>on</strong>g><br />
b) c)<br />
Figure 3. Surface view digital photograph (a) and micrographs with magnificati<strong>on</strong>s 50x (b) or 100x (c) <strong>on</strong><br />
wear tracks of WC-10wt%Co with surface finish E2 rotated against WC-6wt.%Co for 10 km at a 0.3 m/s<br />
sliding speed with mean Hertzian c<strong>on</strong>tact pressure 2.08GPa<br />
Both reciprocating and rotating sliding wear experiments were c<strong>on</strong>tinued up to a total sliding distance of 10<br />
km ensuring that the wear processes had reached a ‘steady state’ c<strong>on</strong>diti<strong>on</strong>. Wear volumes could be<br />
extracted from the generated wear tracks by means of profilometric surface scanning measurement. The<br />
wear volumes of WC-10wt%Co cemented carbide as a functi<strong>on</strong> of surface finishing variant are compared in<br />
Figure 4. The wire-EDM'ed grades are characterized by higher wear volumes compared to their polished<br />
equivalents. The test samples evaluated in rotating sliding c<strong>on</strong>tact show higher wear damage compared to<br />
identical samples tested in reciprocating moti<strong>on</strong>. A possible explanati<strong>on</strong> for this finding could be that wear<br />
debris particles tend to break up more easily when the directi<strong>on</strong> or the moti<strong>on</strong> of the applied stress is<br />
reversed [11].<br />
1000<br />
Vw (10km) [10 -3 mm 3 ]<br />
100<br />
10<br />
1<br />
Polishing E24 E2<br />
Surface finish<br />
Reciprocating<br />
Rotating<br />
Figure 4. Wear volume as a functi<strong>on</strong> of surface finishing operati<strong>on</strong> for WC-10wt%Co slid at 0.3 m/s with a<br />
mean Hertzian c<strong>on</strong>tact pressure of 1.76GPa against WC-6wt%Co pins for 10 km.<br />
Whatever the underlying cause of the wear particle generati<strong>on</strong> may be, the fricti<strong>on</strong>al characteristics of a<br />
sliding system are directly affected by the presence of such wear particles. However, the precise nature of<br />
the wear particle behaviour at the interface of a sliding c<strong>on</strong>tact needs to be further investigated by means of<br />
scanning electr<strong>on</strong> microscopy (SEM) and energy dispersive X-ray (EDX) spectroscopy, for instance.<br />
16<br />
Copyright © <str<strong>on</strong>g>2011</str<strong>on</strong>g> by Laboratory Soete
Sustainable C<strong>on</strong>structi<strong>on</strong> and Design <str<strong>on</strong>g>2011</str<strong>on</strong>g><br />
4 CONCLUSIONS<br />
Reciprocating and rotating wear testing of WC-10wt%Co cemented carbide surface finished by sequential<br />
wire-EDM or polishing in dry sliding c<strong>on</strong>tact with WC-6wt%Co counter body revealed significant increase of<br />
fricti<strong>on</strong> coefficient and wear level by wire-EDM. However, substantial improvements were obtained with<br />
finer-executed EDM finishing steps. Differences in tribological behaviour can be attributed to the wire-EDM<br />
induced recast layer, exhibiting lower wear resistance compared to the polished surface. Higher fricti<strong>on</strong><br />
coefficient and wear volume was encountered in rotating sliding c<strong>on</strong>tact compared to linearly reciprocating<br />
c<strong>on</strong>diti<strong>on</strong>s, which are believed to involve str<strong>on</strong>ger interacti<strong>on</strong> between wear debris at the sliding c<strong>on</strong>tact<br />
interface. The nature of the compound layer in the wear track and wear particles must be further elucidated<br />
by thorough investigati<strong>on</strong> of cross-secti<strong>on</strong>ed wear tracks.<br />
5 NOMENCLATURE<br />
µ d Dynamic coefficient of fricti<strong>on</strong> -<br />
V w Wear volume mm 3<br />
R a average roughness profile variati<strong>on</strong> µm<br />
E2 rough wire-EDM step -<br />
E24 fine wire-EDM step -<br />
6 ACKNOWLEDGEMENTS<br />
The authors would like to acknowledge the support of the Fund for Scientific Research Flanders (FWO,<br />
Grant No. G.0539.08) and the Flemish Institute for the promoti<strong>on</strong> of Innovati<strong>on</strong> by Science and Technology<br />
in industry (IWT, Grant No. GBOU-IWT-010071-SPARK). The authors gratefully recognize all the support,<br />
scientific c<strong>on</strong>tributi<strong>on</strong>s and stimulating collaborati<strong>on</strong> from partners from Laboratory Soete, Ghent University<br />
(UGent) and Catholic University of Leuven (K.U.Leuven). Authors are also thankful to CERATIZIT for<br />
supplying the pins and hardmetals.<br />
7 REFERENCES<br />
[1] Q. Yang, T. Senda, N. Kotani, and A. Hirose, Sliding wear behavior and tribofilm formati<strong>on</strong> of ceramics<br />
at high temperatures. Surface and Coatings Technology, 2004. 184(2-3): p. 270-277.<br />
[2] Zhengui, Y., Stiglich, J.J., Sudarshan, T.S.: WC-Co enjoys proud history and bright future. Metal<br />
Powder Report 53(2), 32–36 (1998)<br />
[3] K. B<strong>on</strong>ny, P. De Baets, Y. Perez et al, Fricti<strong>on</strong> and wear characteristics of WC–Co cemented carbides<br />
in dry reciprocating sliding c<strong>on</strong>tact, Wear 268 (2010) 1504–1517.<br />
[4] Y. Perez, K. B<strong>on</strong>ny, O. Malek P. De Baets et al, Tribological behavior of wire-EDM'ed ZrO2-composites<br />
and cemented carbides, Sustainable C<strong>on</strong>structi<strong>on</strong> and Design (2010).<br />
[5] B<strong>on</strong>ny, K., et al., Influence of electrical discharge machining <strong>on</strong> the reciprocating sliding wear resp<strong>on</strong>se<br />
of WC-Co cemented carbides. Wear, 2009. 266(1-2): p. 84-95.<br />
[6] Shetty, D. K., Wright, I. G., Mincer, P. N. and Clauer, A. H. (1985), Indentati<strong>on</strong> Fracture of WC-Co<br />
Cermets, Journal of Materials Science 20, 5, pp 1873-1882.<br />
[7] B<strong>on</strong>ny K, De Baets P, Vleugels J, Van der Biest O, Lauwers B, et al. EDM machinability and dry sliding<br />
fricti<strong>on</strong> of WC-Co cemented carbides. <str<strong>on</strong>g>Internati<strong>on</strong>al</str<strong>on</strong>g> Journal of Manufacturing Research 2009;4(4):375-<br />
394.<br />
[8] K. B<strong>on</strong>ny, P. De Baets, J. Vleugels, A. Salehi, O. Van der Biest, B. Lauwers, and W. Liu, EDM<br />
machinability and fricti<strong>on</strong>al behavior of ZrO2-WC composites. <str<strong>on</strong>g>Internati<strong>on</strong>al</str<strong>on</strong>g> Journal of Advanced<br />
Manufacturing Technology, 2009. 41(11-12): p. 1085-1093.<br />
[9] Peter J. Blau, Matthew Walukas. Sliding fricti<strong>on</strong> and wear of magnesium alloy AZ91D produced by two<br />
different methods. Tribology <str<strong>on</strong>g>Internati<strong>on</strong>al</str<strong>on</strong>g> 33 (2000) 573–579.<br />
17<br />
Copyright © <str<strong>on</strong>g>2011</str<strong>on</strong>g> by Laboratory Soete
Sustainable C<strong>on</strong>structi<strong>on</strong> and Design <str<strong>on</strong>g>2011</str<strong>on</strong>g><br />
[10] Etsuo Marui, Hiroki Endo. Effect of reciprocating and unidirecti<strong>on</strong>al sliding moti<strong>on</strong> <strong>on</strong> the fricti<strong>on</strong> and<br />
wear of copper <strong>on</strong> steel. Wear 249 (2001) 582–591.<br />
[11] D.H. Hwang, D.E. Kim, S.J. Lee. Influence of wear particle interacti<strong>on</strong> in the sliding interface <strong>on</strong> fricti<strong>on</strong><br />
of metals. Wear 225-229 (1999) 427-439.<br />
[12] D. Odabas, S. Su. A comparis<strong>on</strong> of the reciprocating and c<strong>on</strong>tinuous two-body abrasive wear behavior<br />
of soluti<strong>on</strong>-treated and age-hardened 2014 Al alloy. Wear 208 (1997) 25–35.<br />
[13] Marcia M. Maru and Deniol K. Tanaka. Influence of Loading, C<strong>on</strong>taminati<strong>on</strong> and Additive <strong>on</strong> the Wear<br />
of a Metallic Pair under Rotating and Reciprocating Lubricated Sliding. J. of the Braz. Soc. of Mech.<br />
Sci. & Eng. July-September 2006, Vol. XXVIII, No. 3. 278 - 285.<br />
18<br />
Copyright © <str<strong>on</strong>g>2011</str<strong>on</strong>g> by Laboratory Soete
Sustainable C<strong>on</strong>structi<strong>on</strong> and Design <str<strong>on</strong>g>2011</str<strong>on</strong>g><br />
CHARACTERIZATION AND MODELING OF FRICTION AND WEAR: AN<br />
OVERVIEW<br />
F. Al-Bender 1 , K. De Moerlooze 1,2<br />
1<br />
Katholieke Universiteit Leuven, Dept. Mech. Eng., Div. PMA, Celestijnenlaan 300B, B-3001 Leuven<br />
2<br />
with Leuven Air Bearings N.V. since Sept. 2010<br />
Abstract In this age of virtual design, high-performance machines, and precise moti<strong>on</strong> c<strong>on</strong>trol, the ability<br />
to characterize fricti<strong>on</strong> and wear processes and then to model and simulate them, becomes a pertinent<br />
issue. This communicati<strong>on</strong> gives a c<strong>on</strong>densed overview of the generic characteristics of fricti<strong>on</strong>, thereafter,<br />
generic models, developed at KULeuven, PMA, are presented and discussed.<br />
In regard to fricti<strong>on</strong>, both sliding and rolling are c<strong>on</strong>sidered. The characterizati<strong>on</strong> c<strong>on</strong>cerns (i) the<br />
relati<strong>on</strong>ship between the fricti<strong>on</strong> (tracti<strong>on</strong>) force and the state of sliding of the system (displacement,<br />
velocity,…), at a given normal load; (ii) the relati<strong>on</strong>ship between the coefficient of fricti<strong>on</strong> and the normal<br />
load.<br />
As regards fricti<strong>on</strong>al behaviour in functi<strong>on</strong> of sliding (rolling) state, the main features are: (i) pre-sliding (prerolling)<br />
hysteresis and (ii) gross-sliding (rolling) dynamics. Models are presented that capture those features<br />
and relate them to the c<strong>on</strong>tact characteristics. Comparis<strong>on</strong> with experimental results is also presented for<br />
the main features. Sec<strong>on</strong>dly, the dependence of the coefficient of fricti<strong>on</strong> <strong>on</strong> the normal load is identified<br />
and modelled.<br />
Finally, regarding wear simulati<strong>on</strong>, the generic fricti<strong>on</strong> model is extended to cater for an asperity populati<strong>on</strong><br />
that changes during the lifetime of sliding. Based <strong>on</strong> fatigue c<strong>on</strong>siderati<strong>on</strong>s, asperities get broken after a<br />
certain number of c<strong>on</strong>tact cycles, and are replaced by smaller <strong>on</strong>es. With the aid of this model, we try to<br />
correlate energy dissipati<strong>on</strong> with wear evoluti<strong>on</strong>, and support that by experimental observati<strong>on</strong>.<br />
Keywords : Fricti<strong>on</strong>, tracti<strong>on</strong>, wear, normal load, fricti<strong>on</strong> coefficient, theoretical models, experimental<br />
results, Stribeck curve, fricti<strong>on</strong> lag, hysteresis, rolling.<br />
1 INTRODUCTION<br />
Fricti<strong>on</strong> modelling has been steadily gaining in interest over the last few decades. However, owing to the<br />
complexity of the fricti<strong>on</strong> and wear phenomen<strong>on</strong>, no comprehensive, practicable fricti<strong>on</strong> model that shows<br />
all of the experimentally observed aspects of fricti<strong>on</strong> force dynamics in <strong>on</strong>e formulati<strong>on</strong> is available. Most<br />
available fricti<strong>on</strong> and wear models are, in essence, empirical, that is, based <strong>on</strong> limited observati<strong>on</strong>s and<br />
interpretati<strong>on</strong>s. In this sense, the resulting models are valid <strong>on</strong>ly for the specific scope of test c<strong>on</strong>diti<strong>on</strong>s,<br />
such as the level and type of excitati<strong>on</strong>, used to obtain the data. On the other hand, development of<br />
simulati<strong>on</strong> models and, where possible, predictive theories, at scales from atomic, through c<strong>on</strong>tinuum, to<br />
useful engineering models, can fill empty gaps in the toolboxes available to designers and analysts.<br />
Besides the field of tribology, where the origin of fricti<strong>on</strong> is <strong>on</strong>e of the main topics, modelling and<br />
compensati<strong>on</strong> of fricti<strong>on</strong> dynamics are treated in several other domains. In the machining and assembly<br />
industry, demand for high-accuracy positi<strong>on</strong>ing systems and tracking systems is increasing. Research <strong>on</strong><br />
c<strong>on</strong>trolled mechanical systems with fricti<strong>on</strong> is motivated by the increasing demand for these systems.<br />
Fricti<strong>on</strong> can severely deteriorate c<strong>on</strong>trol system performance in the form of higher tracking errors, larger<br />
settling times, hunting, and stick-slip phenomena. In short, fricti<strong>on</strong> is <strong>on</strong>e of the main players in a wide<br />
variety of mechanical systems.<br />
This communicati<strong>on</strong> presents an overview of fricti<strong>on</strong> model-building, which starts from the generic<br />
mechanisms behind fricti<strong>on</strong> to c<strong>on</strong>struct models that simulate observed macroscopic fricti<strong>on</strong> behaviour.<br />
First, basic fricti<strong>on</strong> properties are presented. Then, the generic fricti<strong>on</strong> model is outlined. Hereafter, the<br />
relati<strong>on</strong>ship between fricti<strong>on</strong> coefficient and normal load is c<strong>on</strong>sidered from theoretical and experimental<br />
point view. A theory for tarctive rolling is then presented with experimental validati<strong>on</strong>. Finally, the gereric<br />
fricti<strong>on</strong> model is extended to deal with wear in sliding c<strong>on</strong>tacts.<br />
19<br />
Copyright © <str<strong>on</strong>g>2011</str<strong>on</strong>g> by Laboratory Soete
Sustainable C<strong>on</strong>structi<strong>on</strong> and Design <str<strong>on</strong>g>2011</str<strong>on</strong>g><br />
Fricti<strong>on</strong> force ( AU)<br />
Gross sliding<br />
Transiti<strong>on</strong><br />
Rate of applied<br />
force<br />
Pre-sliding<br />
Displacement (AU)<br />
Figure 1. Basic fricti<strong>on</strong> c<strong>on</strong>figurati<strong>on</strong>.<br />
Figure 2. The two fricti<strong>on</strong> regimes and the<br />
transiti<strong>on</strong> between them.<br />
2 BASIC FRICTION BEHAVIOR<br />
C<strong>on</strong>sidering fricti<strong>on</strong> as a mechanical system, (see Fig.1), a close examinati<strong>on</strong> of the sliding process reveals<br />
two fricti<strong>on</strong> regimes, namely, the pre-sliding regime and the gross sliding regime, (see Fig.2). In the presliding<br />
regime the adhesive forces, owing to asperity c<strong>on</strong>tacts, are dominant, and thus the fricti<strong>on</strong> force is<br />
primarily a functi<strong>on</strong> of displacement rather than velocity. The reas<strong>on</strong> for this behaviour is that the asperity<br />
juncti<strong>on</strong>s deform elasto-plastically, thus behaving as n<strong>on</strong>linear hysteretic springs.<br />
As the displacement increases, more and more juncti<strong>on</strong>s break and have less time to reform, resulting<br />
eventually in gross sliding.<br />
The sliding regime is, thus, characterized by a c<strong>on</strong>tinuous process of asperity juncti<strong>on</strong> formati<strong>on</strong> and<br />
breaking such that the fricti<strong>on</strong> force becomes predominantly a functi<strong>on</strong> of the velocity [1]. The transiti<strong>on</strong><br />
from pre-sliding to gross sliding is a criticality that depends <strong>on</strong> many factors such as the relative velocity (to<br />
be envisaged as the displacement rate) and accelerati<strong>on</strong> of the sliding objects, see [2].<br />
Figure 3. Example of desired moti<strong>on</strong> in the<br />
pre-sliding regime.<br />
Figure 4. Hysteresis behavior as a result of the trajectory of<br />
Fig. 3.<br />
2.1 Pre-sliding behavior<br />
At very small displacements, that is, in the pre-sliding regime, experiments reveal a hysteretic<br />
displacement-dependent fricti<strong>on</strong> force [3,4]. When a pre-sliding displacement command, such as that<br />
shown in Fig. 3, is applied to the block, the force-displacement behavior of Fig.4 results. The positi<strong>on</strong> signal<br />
is chosen such that there is an inner loop within the outer hysteresis loop. The resulting fricti<strong>on</strong>-positi<strong>on</strong><br />
curve is rate independent (compare the right and left panels of Fig.4). In other words, the fricti<strong>on</strong>-positi<strong>on</strong><br />
curve is independent of the speed of the applied positi<strong>on</strong> signal. When an inner loop is closed, (c-d-c), the<br />
curve of the outer loop (a-c-b) is followed again, proving the n<strong>on</strong>local memory characteristic of the<br />
hysteresis. The shape of the hysteresis functi<strong>on</strong> is determined by the distributi<strong>on</strong> of the asperity heights, the<br />
tangential stiffness, and the normal stiffness of the c<strong>on</strong>tact.<br />
This hysteresis behaviour arises primarily from micro-slip, that is, the breaking of adhesive c<strong>on</strong>tacts, just as<br />
in the Maxwell-Slip model discussed further below. The c<strong>on</strong>tributi<strong>on</strong> of deformati<strong>on</strong> losses, which are<br />
hysteresis losses in the bulk materials, depends <strong>on</strong> the relative value of this part as compared to the<br />
20<br />
Copyright © <str<strong>on</strong>g>2011</str<strong>on</strong>g> by Laboratory Soete
Sustainable C<strong>on</strong>structi<strong>on</strong> and Design <str<strong>on</strong>g>2011</str<strong>on</strong>g><br />
adhesive part, as well as <strong>on</strong> the tangential stiffness of the asperities, which governs the extent of<br />
deformati<strong>on</strong> before slip.<br />
µ 1<br />
k 1<br />
“Virg in c urve“<br />
Ffric<br />
Fm<br />
3<br />
5<br />
1<br />
Fvirgin<br />
= f( x)<br />
⎧ yx ( ) ; x≥<br />
0<br />
with f ( x)<br />
= ⎨<br />
⎩ − y( − x) ; x ≤ 0<br />
….<br />
µ 2 µ i<br />
µ n<br />
k 2<br />
k i k n<br />
x ,<br />
F<br />
-xm<br />
-y(-x)<br />
y(x)<br />
0<br />
2<br />
xm<br />
x<br />
Up<strong>on</strong> reversal at any point x m , a<br />
doubly dialated versi<strong>on</strong> of the<br />
virgin curve is followed:<br />
F i<br />
x<br />
4<br />
(B) Possible trajectory of the hysteretic fricti<strong>on</strong> force<br />
⎛ x−<br />
xm<br />
⎞<br />
Ffric<br />
= Fm<br />
+ 2 f ⎜ ⎟<br />
⎝ 2 ⎠<br />
Figure 5. Characteristics of<br />
hysteresis with n<strong>on</strong>local memory.<br />
Masing’s rules for describing<br />
hysetersis<br />
Figure 6. Modeling of hysteresis<br />
using Maxwell-Slip elements.<br />
Figure 5 explains the c<strong>on</strong>stituti<strong>on</strong> of hysteresis according to Masing’s rules, shown to the right thereof. This<br />
behaviour can also be modeled discretely by a parallel c<strong>on</strong>necti<strong>on</strong> of Maxwell-Slip elements [5], as shown<br />
in Fig. 6.<br />
2.2 Gross sliding<br />
When the asperity juncti<strong>on</strong>s are c<strong>on</strong>tinually being created and broken, the fricti<strong>on</strong>al interface is in the gross<br />
sliding regime. Two main characteristics are of interest here. The first is the steady-state fricti<strong>on</strong> force<br />
behavior with increasing steady-state sliding velocities, generally known as the Stribeck curve, Fig. 7. The<br />
sec<strong>on</strong>d is the change of the fricti<strong>on</strong> force with the velocity variati<strong>on</strong>, known as the fricti<strong>on</strong> lag or fricti<strong>on</strong><br />
memory phenomen<strong>on</strong>, Fig. 8.<br />
Fricti<strong>on</strong> force (N)<br />
Fricti<strong>on</strong> force<br />
S(v)<br />
velocity (mm/s)<br />
Figure 7. The Stribeck curve c<strong>on</strong>sists of velocity<br />
weakening, s(v), and velocity strengthening.<br />
Model:<br />
dF<br />
f( 1 F/ sv ( )), f(0) 0.<br />
dt = − =<br />
Figure 8. Fricti<strong>on</strong> lag and its c<strong>on</strong>stitutive equati<strong>on</strong>.<br />
s(v) is the velocity weakening curve also called the<br />
“Stribeck effect”.<br />
2.3 The Stribeck curve<br />
When the fricti<strong>on</strong> force is measured at c<strong>on</strong>stant velocity values (Fig. 7), the resulting functi<strong>on</strong>al relati<strong>on</strong>ship<br />
has a characteristic form. For increasing velocities, the fricti<strong>on</strong> force initially decreases to a minimum<br />
(velocity weakening) and then increases again (velocity strengthening). In lubricated sliding, this<br />
21<br />
Copyright © <str<strong>on</strong>g>2011</str<strong>on</strong>g> by Laboratory Soete
Sustainable C<strong>on</strong>structi<strong>on</strong> and Design <str<strong>on</strong>g>2011</str<strong>on</strong>g><br />
characteristic is known as the Stribeck curve, where the velocity weakening arises from the initial buildup of<br />
hydrodynamic pressure, while the velocity strengthening is attributed to the viscous shear of the lubricating<br />
film.<br />
The same behaviour seems to hold true for dry fricti<strong>on</strong>, which justifies using the same name, that is, the<br />
Stribeck curve, to describe it. The actual form of the fricti<strong>on</strong>-velocity curve is determined by various process<br />
parameters, namely, the normal creep or, equivalently, the time evoluti<strong>on</strong> of adhesi<strong>on</strong>, the surface<br />
topography, and the asperity parameters, primarily the tangential stiffness and inertia [2,6,8].<br />
2.4 Fricti<strong>on</strong> lag<br />
Fricti<strong>on</strong> lag, also called hysteresis in the velocity, or fricti<strong>on</strong>al memory, is manifested by a lag in the fricti<strong>on</strong><br />
force relative to the sliding velocity. The origin of fricti<strong>on</strong> lag in lubricated fricti<strong>on</strong> relates to the time required<br />
to modify the lubricant film thickness, which is known as the squeeze effect. Fricti<strong>on</strong> lag is also observed in<br />
dry fricti<strong>on</strong> experiments (Fig. 8), where lubricati<strong>on</strong> is not used. The mechanism causing fricti<strong>on</strong> lag in dry<br />
sliding is similar to that for lubricated fricti<strong>on</strong>, namely, that the local adhesi<strong>on</strong> coefficient increases with the<br />
time of c<strong>on</strong>tact of two opposing asperities, owing to normal creep. In other words, time is required before<br />
the fricti<strong>on</strong> force changes with changing sliding velocity. Since the normal creep is caused by the sinking of<br />
the surfaces into each other, this mechanism is akin to the squeeze effect in lubricated fricti<strong>on</strong>. Thus, the<br />
fricti<strong>on</strong> force is higher for accelerati<strong>on</strong> than for decelerati<strong>on</strong>, so that the dynamic fricti<strong>on</strong> force curve circles<br />
around the steady-state curve. The Stribeck curve s(v) acts as the attractor.<br />
3 A GENERIC FRICTION MODEL<br />
In order rec<strong>on</strong>struct the fricti<strong>on</strong> behavior outlined above, in the framework of a mechanical theory, a generic<br />
model was developed [6,8].<br />
F<br />
yt<br />
m<br />
M<br />
xt<br />
kp<br />
y1<br />
m1<br />
x1<br />
y2<br />
x2 yi<br />
m2<br />
mi<br />
xi<br />
…<br />
…<br />
kN<br />
k T/2<br />
k T/2<br />
yj mj<br />
xj<br />
mn yn xn<br />
m<br />
Counter profile<br />
Figure 9(a). A generic representati<strong>on</strong> of the sliding<br />
c<strong>on</strong>tact of rough bodies [8].<br />
Figure 9(b). A simplified c<strong>on</strong>siderati<strong>on</strong> of the c<strong>on</strong>tact<br />
cycle of a single asperity [6].<br />
Figure 9(c). Modelling of elasto-plastic behaviour of asperity deformati<strong>on</strong>.<br />
The model comprises an upper body c<strong>on</strong>taining point-mass asperities supported <strong>on</strong> hysteresis springs (Fig.<br />
9), which slides against a rigid, profiled lower surface, subject to adhesi<strong>on</strong> and deformati<strong>on</strong>. The latter is<br />
modelled by elasto-plastic springs (Fig. 9(c)). The life cycle of an average asperity c<strong>on</strong>tact is depicted in<br />
Fig. 9(b). (A) An asperity is initially moving freely (i) until it touches the lower rigid surface (ii). After sticking<br />
and slipping, it breaks completely loose from the lower profile (iii). (B) depicts the hysteretic forcedeformati<strong>on</strong><br />
diagram during a c<strong>on</strong>tact cycle of the asperity, where up<strong>on</strong> breaking loose, the asperity is<br />
assumed to dissipate its elastic energy through internal hysteresis losses, until it comes again in c<strong>on</strong>tact<br />
with a counter asperity. Adhesi<strong>on</strong> may be treated either as a normal force between the asperities or as a<br />
tangential (local fricti<strong>on</strong>) force, yielding essentially similar results in terms of behaviour [8].<br />
22<br />
Copyright © <str<strong>on</strong>g>2011</str<strong>on</strong>g> by Laboratory Soete
Sustainable C<strong>on</strong>structi<strong>on</strong> and Design <str<strong>on</strong>g>2011</str<strong>on</strong>g><br />
1x<br />
5x<br />
20x<br />
Figure 10. Simulati<strong>on</strong> results of pre-sliding hysteresis using the generic model. Cf. Fig. 3.<br />
3.1 Typical results of the generic model<br />
The generic model yields results that are reviewed in the self-explanatory Figs. 10 through 13. The<br />
parameters used for the simulati<strong>on</strong> have been chosen ad hoc <strong>on</strong>ly to illustrate typical behaviour, although<br />
they can also be identified from experimental results.<br />
Figure 11. The Stribeck curve<br />
obtainedfrom the generic model of<br />
[8], using arbitrary model<br />
parameters.<br />
Figure 12. Fricti<strong>on</strong> lag using the<br />
generic model. The higher the<br />
accelerati<strong>on</strong>, the more the loops<br />
depart from the Stribeck curve.<br />
Figure 13. Periodic fricti<strong>on</strong>-velocity<br />
curves using the generic model.<br />
4 THE DEPENDENCY OF THE COEFFICIENT OF FRICTION ON THE NORMAL LOAD<br />
For a given sliding pair, the coefficient of fricti<strong>on</strong> is not c<strong>on</strong>stant, but appears to depend appreciably <strong>on</strong> the<br />
normal load, as shown in [10]. In that study, three material pairs (metals and plastic) were examined from<br />
pre-sliding up to gross sliding, with more than <strong>on</strong>e order-of-magnitude variati<strong>on</strong> of the normal load. Typical<br />
results are shown in Fig. 14.<br />
Figure 14.(a) For each normal load, the presliding<br />
hysteresis curve is measured and the<br />
virgin-curve is identified.<br />
Figure 14.(b) The evoluti<strong>on</strong> of the normalised virgincurves,<br />
or the coefficient of fricti<strong>on</strong> for increasing<br />
normal load.<br />
23<br />
Copyright © <str<strong>on</strong>g>2011</str<strong>on</strong>g> by Laboratory Soete
Sustainable C<strong>on</strong>structi<strong>on</strong> and Design <str<strong>on</strong>g>2011</str<strong>on</strong>g><br />
Figure 15.(a) Evoluti<strong>on</strong> of h 0 , for PET <strong>on</strong> PET.<br />
Figure 15.(b) Evoluti<strong>on</strong> of a, for PET <strong>on</strong> PET.<br />
To analyze these results, each virgin curve was fitted by means of a three-parameter functi<strong>on</strong>:<br />
− 0<br />
( ( − )<br />
)<br />
F( x) = h 1 e a x x<br />
o<br />
− (1)<br />
where, h 0 scales the fricti<strong>on</strong> force and a the pre-sliding distance, (x 0 is the positi<strong>on</strong> of the origin point).<br />
Typical behaviour of these two parameters is shown in Fig. 15, where <strong>on</strong>e can clearly notice that (i) h0<br />
increases less than linearly with the load, which means that the coefficient of fricti<strong>on</strong> decreases with<br />
increasing normal load, and (ii) a decreases with the normal load, meaning that the pre-sliding distance<br />
increases with load. The rage of variati<strong>on</strong> of these two parameters depends <strong>on</strong> the material combinati<strong>on</strong>.<br />
This behaviour has been modelled theoretically, making use of (i) the Maxwell-slip structure for modelling<br />
the c<strong>on</strong>tact in pre-sliding (Fig. 16) and (ii) the Greenwood and Williams<strong>on</strong> theory for modelling the local<br />
fricti<strong>on</strong> force at each asperity. The results of this latter model show that a decreasing coefficient of fricti<strong>on</strong> in<br />
the normal load always results. The trend is most pr<strong>on</strong>ounced for low values of the Plasticity Index and of<br />
the normal load, as shown in Fig. 17.<br />
Thus the c<strong>on</strong>tact parameters influencing hysteresis behaviour and variati<strong>on</strong> of the fricti<strong>on</strong> coefficient with<br />
normal load are: elasticity, hardness, surface topography and adhesi<strong>on</strong>.<br />
When this analysis is applied to the whole of the pre-sliding regi<strong>on</strong>, the behaviour shown in Fig. 18 is<br />
obtained [9]. Let us note that this behaviour can is also be predicted by the generic model described in ref.<br />
[8].<br />
Figure 16.The Maxwell-slip model for pre-sliding.<br />
Figure 17.The static fricti<strong>on</strong> coefficient as functi<strong>on</strong> of<br />
the normal load for different values of the Plasticity<br />
Index.<br />
24<br />
Copyright © <str<strong>on</strong>g>2011</str<strong>on</strong>g> by Laboratory Soete
Sustainable C<strong>on</strong>structi<strong>on</strong> and Design <str<strong>on</strong>g>2011</str<strong>on</strong>g><br />
µ [−]<br />
x<br />
Figure 18.The variati<strong>on</strong> of the coefficient of fricti<strong>on</strong> with the displacement and the normal load during presliding.<br />
5 MODELLING OF TRACTIVE ROLLING FRICTION<br />
Tractive rolling is caused by the so-called creepage (or ‘rigid slip’) between the rolling surfaces. This<br />
creepage causes the points, which enter the c<strong>on</strong>tact patch mated with each other, to progressively stretch<br />
and finally slip when reaching the trailing edge and exiting the c<strong>on</strong>tact patch. This situati<strong>on</strong> is adequately<br />
illustrated by Figures 19-20, ref. [11].<br />
Figure 19. C<strong>on</strong>figurati<strong>on</strong> of tractive rolling. The<br />
pressure distributi<strong>on</strong> in the c<strong>on</strong>tact patch is<br />
Hertzian. Creepages (l<strong>on</strong>gitudinal, transverse and<br />
spin) are caused by differences in rigid moti<strong>on</strong>s<br />
between the ball and the flat.<br />
Figure 20. Build up of tracti<strong>on</strong> through the c<strong>on</strong>tact<br />
patch, ending by the tracti<strong>on</strong> (slip) limit. The<br />
c<strong>on</strong>stitutive slip equati<strong>on</strong> states that the slip S is<br />
equal to the creepage C less the total derivative of<br />
the surface displacement.<br />
C<strong>on</strong>sidering, for example, the presence of <strong>on</strong>ly spin creepage, as is the case of a ball between V-grooves,<br />
the tracti<strong>on</strong> field and the associated hysteresis behaviour are depicted in Fig. 21. The hysteresis properties,<br />
namely, rate independence and n<strong>on</strong>local memory, resemble those identified in sliding c<strong>on</strong>tacts. Thus, we<br />
see that sliding and rolling have similar fricti<strong>on</strong> (dynamics) properties during pre-rolling. During gross rolling,<br />
the Stribeck effect and the fricti<strong>on</strong>-lag are much less pr<strong>on</strong>ounced. This is so because during rolling, the<br />
25<br />
Copyright © <str<strong>on</strong>g>2011</str<strong>on</strong>g> by Laboratory Soete
Sustainable C<strong>on</strong>structi<strong>on</strong> and Design <str<strong>on</strong>g>2011</str<strong>on</strong>g><br />
Figure 21. Left: steady-state rolling tracti<strong>on</strong> field. Right: the hysteresis curve of the tracti<strong>on</strong> moment in<br />
functi<strong>on</strong> of the rolling displacement.<br />
FIGURE 22. Experimentally<br />
measured pre-rolling hysteresis<br />
curve, with theoretical fit, of a<br />
ball rolling between two V-<br />
grooves.<br />
relative speeds between slipping points <strong>on</strong> the surfaces remains very low (unless the c<strong>on</strong>tact as a whole is<br />
slipping, in which case rolling ceases to exist). This point is best illustrated by Figures 22 and 23. However,<br />
since creepage is generally dependent <strong>on</strong> the dynamics of the rolling system, i.e. that it changes during<br />
dynamic rolling, this situati<strong>on</strong> can lead to very complex dynamics as presented in ref [13].<br />
Evoluti<strong>on</strong> of "h<br />
3.5 0<br />
" as functi<strong>on</strong> of the normal load<br />
3<br />
2.5<br />
2<br />
1.5<br />
1<br />
0.5<br />
0<br />
h 0<br />
[N]<br />
0 50 100<br />
Normal load W [N]<br />
Evoluti<strong>on</strong> of "a" as functi<strong>on</strong> of the normal load<br />
0.035<br />
a [µm - 1]<br />
0.034<br />
0.033<br />
0.032<br />
0.031<br />
0.03<br />
40 60 80 100 120 140<br />
Normal load W [N]<br />
Figure 23. Evoluti<strong>on</strong> of h 0 (left) and a (right), of Eq. (1), in the normal load, for rolling c<strong>on</strong>tact. We note that<br />
h 0 is almost linear in the load and a varies relatively <strong>on</strong>ly slightly.<br />
Finally, the theoretical model has been validated by comparis<strong>on</strong><br />
with experiment. The results are shown in Fig. 24 where very<br />
good agreement is observed (maximum error of 16 %).<br />
Figure 24. Comparis<strong>on</strong> between<br />
experimental measurement and<br />
theoretical predicti<strong>on</strong>s of the<br />
virgin curve during pre-rolling.<br />
26<br />
Copyright © <str<strong>on</strong>g>2011</str<strong>on</strong>g> by Laboratory Soete
Sustainable C<strong>on</strong>structi<strong>on</strong> and Design <str<strong>on</strong>g>2011</str<strong>on</strong>g><br />
6 THEORETICAL MODELLING AND EXPERIMENTAL CHARACTERISATION OF WEAR<br />
Theoretical modelling of wear is a valuable aid for designing and optimizing tribological systems, in<br />
particular those involving unlubricated c<strong>on</strong>tacts. However, most of the existing models are empirical in<br />
nature, which limits their applicability and predictive power. This motivates us to extend the generic fricti<strong>on</strong><br />
model, outlined in secti<strong>on</strong> 3, by elaborating it with energy-based, asperity-degradati<strong>on</strong>/modificati<strong>on</strong><br />
mechanisms, in the form of a local fatigue law: when the energy accumulati<strong>on</strong> in an asperity, owing to<br />
repeated elastic-plastic deformati<strong>on</strong> exceeds a certain threshold, the asperity breaks off. Simulati<strong>on</strong> results,<br />
using a set of arbitrary model parameters, in unidirecti<strong>on</strong>al as well bidirecti<strong>on</strong>al sliding, show qualitative<br />
agreement with experimental observati<strong>on</strong>s (see further). Apart from the running-in phase, which the<br />
simulati<strong>on</strong>s show clearly, a linear trend between the wear volume and the energy dissipati<strong>on</strong> is observed,<br />
as shown in Fig. 25, (ref. [14]).<br />
Asperity height distributi<strong>on</strong><br />
before test (running in).<br />
Wear mass in functi<strong>on</strong> of the<br />
energy dissipated in the c<strong>on</strong>tact.<br />
Figure 25. Typical results of the generic wear model simulati<strong>on</strong>s.<br />
Asperity height distributi<strong>on</strong> after<br />
running in (end of test).<br />
With the objective of experimentally correlating several wear-process parameters, accurately and<br />
c<strong>on</strong>tinuously over the durati<strong>on</strong> of a sliding test, we developed a novel rotati<strong>on</strong>al test rig with axes supported<br />
<strong>on</strong> aerostatic bearings [15]. It enables <strong>on</strong>line, simultaneous measurement of normal load, fricti<strong>on</strong> force,<br />
angular positi<strong>on</strong> and normal displacement with high accuracy, see Fig. 26.<br />
Figure 26. Test rig for accurate wear measurement.<br />
Figure 27. Wear volume in functi<strong>on</strong> of the energy dissipated in the c<strong>on</strong>tact for nyl<strong>on</strong> <strong>on</strong> steel<br />
(left) and steel, respectively Alumina <strong>on</strong> steel (right) .<br />
27<br />
Copyright © <str<strong>on</strong>g>2011</str<strong>on</strong>g> by Laboratory Soete
Sustainable C<strong>on</strong>structi<strong>on</strong> and Design <str<strong>on</strong>g>2011</str<strong>on</strong>g><br />
A set of ball-<strong>on</strong>-disc experiments was then performed, with ball materials being nyl<strong>on</strong>, steel and ceramic, <strong>on</strong><br />
hard steel disc material. The performed experiments correlate three process variables and parameters:<br />
normal load, wear volume and dissipated energy. The basic trends observed show that the relati<strong>on</strong>ship<br />
between those three variables are quasi linear, but generally with n<strong>on</strong>zero intercepts (see Fig. 27),<br />
corresp<strong>on</strong>ding to energy thresholds; except that of wear of alumina <strong>on</strong> steel (right Figure) [15].<br />
7 CONCLUSIONS<br />
Fricti<strong>on</strong> is a complex, n<strong>on</strong>linear phenomen<strong>on</strong> that depends not <strong>on</strong>ly <strong>on</strong> the c<strong>on</strong>tacting surfaces and their<br />
physical and topographical properties but also <strong>on</strong> the dynamics of the system comprising fricti<strong>on</strong>. Evoluti<strong>on</strong><br />
of wear in the c<strong>on</strong>tact adds further to the complexity of fricti<strong>on</strong> systems. Modelling of fricti<strong>on</strong> is important in<br />
many fields of science and engineering. We have presented an overview of our research into the modelling<br />
and experimental validati<strong>on</strong> of fricti<strong>on</strong>, tracti<strong>on</strong> and wear. It became hopefully clear from the presentati<strong>on</strong><br />
that modelling of the fricti<strong>on</strong> phenomen<strong>on</strong>, based <strong>on</strong> the generic c<strong>on</strong>tact mechanisms, can lead to results<br />
that are qualitatively in agreement with experimentally observed behaviour. In the case of rolling, even very<br />
good quantitative agreement is achieved. In order to develop those models further towards predictive<br />
models, which will be a very powerful engineering tool, questi<strong>on</strong>s regarding the determinati<strong>on</strong> and<br />
assignment of model parameters have to be dealt with. This is the subject of future work.<br />
8 ACKNOWLEDGEMENTS<br />
This research was partially supported by the Fund for Scientific Research - Flanders (F.W.O.) under Grant<br />
FWO4283. The scientific resp<strong>on</strong>sibility is assumed by its authors.<br />
9 REFERENCES<br />
[1] Armstr<strong>on</strong>gHélouvry B. C<strong>on</strong>trol of Machines with Fricti<strong>on</strong>. Norwell, MA: Kluwer, 1991.<br />
[2] Al-Bender F, Lampaert V, Swevers J. Modelling of dry sliding fricti<strong>on</strong> dynamics: from heuristic models<br />
to physically motivated models and back. CHAOS, An Interdisciplinary Journal of N<strong>on</strong>linear Science.<br />
2004, 14(2): 446-460.<br />
[3] Swevers J., Al-Bender F, Ganseman C, Prajogo T. An integrated fricti<strong>on</strong> model structure with improved<br />
presliding behaviour for accurate fricti<strong>on</strong> compensati<strong>on</strong>. IEEE Transacti<strong>on</strong>s <strong>on</strong> Automatic C<strong>on</strong>trol.<br />
2000, 45(4): 675-686.<br />
[4] Lampaert V, Al-Bender F, Swevers J. Experimental characterisati<strong>on</strong> of dry fricti<strong>on</strong> at low velocities <strong>on</strong> a<br />
developed tribometer setup for macroscopic. Tribology Letters, 2004, 16(1): 95-105.<br />
[5] Al-Bender F, Symens W, Swevers J, Van Brussel H. Theoretical analysis of the dynamic behavior of<br />
hysteresis elements in mechanical systems. <str<strong>on</strong>g>Internati<strong>on</strong>al</str<strong>on</strong>g> Journal of N<strong>on</strong>-linear Mechanics. 2004, 39:<br />
1721-1735.<br />
[6] Al-Bender F, Lampaert V, Swevers J. A novel generic model at asperity level for dry fricti<strong>on</strong> force<br />
dynamics. Tribology Letters. 2004, 16(1): 81-93.<br />
[7] Al-Bender F, Lampaert V, Swevers J. The Generalized Maxwell-slip model: a novel model for fricti<strong>on</strong><br />
simulati<strong>on</strong> and compensati<strong>on</strong>. IEEE Transacti<strong>on</strong>s <strong>on</strong> Automatic C<strong>on</strong>trol. 2005, 50(11): 1883-1887.<br />
[8] De Moerlooze K, Al-Bender F, Van Brussel H, A Generalised Asperity-Based Fricti<strong>on</strong> Model Source:<br />
TRIBOLOGY LETTERS 40(1), 113-130, 2010.<br />
[9] Al-Bender F, De Moerlooze K, On the relati<strong>on</strong>ship between normal load and fricti<strong>on</strong> force in pre-sliding<br />
fricti<strong>on</strong>al c<strong>on</strong>tacts, Part 1: Theoretical analysis, WEAR, 269(3-4), 174-182, 2010.<br />
[10] De Moerlooze K, Al-Bender F, On the relati<strong>on</strong>ship between normal load and fricti<strong>on</strong> force in pre-sliding<br />
fricti<strong>on</strong>al c<strong>on</strong>tacts, Part 2: Experimental investigati<strong>on</strong>, WEAR 269(3-4), 183-189, 2010.<br />
[11] Al-Bender, F.; De Moerlooze, A Model of the Transient Behavior of Tractive Rolling C<strong>on</strong>tacts,<br />
Advances in Tribology, 214894 (17 pp.), 2008.<br />
[12] De Moerlooze, K.; Al-Bender, F., Experimental Investigati<strong>on</strong> into the Tractive Prerolling Behavior of<br />
Balls in V-Grooved Tracks, Advances in Tribology, 561280 (10 pp.), 2008.<br />
[13] De Moerlooze, F. Al-Bender, H. Van Brussel, Modeling of the dynamic behavior of systems with rolling<br />
elements, <str<strong>on</strong>g>Internati<strong>on</strong>al</str<strong>on</strong>g> Journal of N<strong>on</strong>-Linear Mechanics, <str<strong>on</strong>g>Volume</str<strong>on</strong>g> 46, <str<strong>on</strong>g>Issue</str<strong>on</strong>g> 1, January <str<strong>on</strong>g>2011</str<strong>on</strong>g>, 222-233.<br />
[14] Kris De Moerlooze, Farid Al-Bender, Hendrik Van Brussel, A novel energy-based generic wear model<br />
at the asperity level, paper submitted to Wear, 2010.<br />
[15] Kris De Moerlooze, Farid Al-Bender, Hendrik Van Brussel, An experimental study of ball-<strong>on</strong>-flat wear<br />
<strong>on</strong> a newly developed rotati<strong>on</strong>al tribometer, paper submitted to Wear, 2010.<br />
28<br />
Copyright © <str<strong>on</strong>g>2011</str<strong>on</strong>g> by Laboratory Soete
Sustainable C<strong>on</strong>structi<strong>on</strong> and Design <str<strong>on</strong>g>2011</str<strong>on</strong>g><br />
TRIBOLOGICAL BEHAVIOR OF COMPOSITE-STEEL ON<br />
ROLLING/SLIDING CONTACTS FOR VARIOUS LOADS<br />
M. Ando 1 , J. Sukumaran 2<br />
1 Szent István University, GÉTI, Páter Károly utca 1. 2100 Göldöllő, Hungary<br />
2 University of Gent, Department of Mechanical C<strong>on</strong>structi<strong>on</strong> and Producti<strong>on</strong>, Sint-Pietersnieuwstraat, 41,<br />
9000 Gent, Belgium<br />
Abstract Composites have replaced metals in the bearing industry for the exclusive performances from its<br />
properties were it can accommodate resins, fabrics and additives. Roll-slip is comm<strong>on</strong> behaviors in<br />
applicati<strong>on</strong> were n<strong>on</strong>-c<strong>on</strong>formal c<strong>on</strong>tact exhibits like bearings, rollers and cams. Two elements c<strong>on</strong>trol the<br />
tribological behavior of the material which is the rolling and the sliding element. Composite-steel c<strong>on</strong>tacts<br />
were tested using a twin-disc setup with open tribo-system to study the influence of load <strong>on</strong> the fricti<strong>on</strong>al<br />
behavior of the polymer composites. The c<strong>on</strong>tacts were tested with four different loads under 20% slip ratio<br />
for a regular interval of time. The curves from the fricti<strong>on</strong> force with respect to different loads follows a<br />
tendency of linear increase in fricti<strong>on</strong> force were the rolling resistance is the dominating mechanism. For the<br />
given c<strong>on</strong>diti<strong>on</strong> the macro level investigati<strong>on</strong>s shows the absence of transfer layer <strong>on</strong> the steel<br />
counterparts. The tendency of the fricti<strong>on</strong> curve and the micrograph explicitly deliberates the involvement of<br />
abrasi<strong>on</strong> and adhesi<strong>on</strong> in the harder polymer from metal counterpart. The temperature variable is isolated<br />
in case of the above research. The examinati<strong>on</strong> of the c<strong>on</strong>tact surface reveals the formati<strong>on</strong> of craters <strong>on</strong><br />
the juncti<strong>on</strong> of polymer and textile.<br />
Keywords Effect of the load, rolling/sliding, composites-steel n<strong>on</strong> c<strong>on</strong>formal c<strong>on</strong>tact<br />
1 INTRODUCTION<br />
Composite-steel pairs are normally used in dry running c<strong>on</strong>diti<strong>on</strong> where high strength and internal<br />
lubricati<strong>on</strong> are necessary. Generally, composites used in tribological applicati<strong>on</strong>s were examined from the<br />
perspective of fillers and fibers [1, 2]. C<strong>on</strong>sidering the tribological properties, Fibers aid to the fricti<strong>on</strong><br />
behaviour of the composites. Studies with respect to the fiber orientati<strong>on</strong> resulted in instabilities <strong>on</strong> the coeffcient<br />
of fricti<strong>on</strong> [3].<br />
As the requirements are achieved by the combinati<strong>on</strong> of fibers, resins and filler materials at various<br />
proporti<strong>on</strong>s [3]. Most of the researches studying the tribological behaviour of composites are focused <strong>on</strong><br />
sliding. Various standards like pin-<strong>on</strong> disc, pin <strong>on</strong> ring and block <strong>on</strong> drum are used to evaluate the sliding<br />
phenomen<strong>on</strong>. Previous results from pin-<strong>on</strong>-disc <strong>on</strong> polyester composites has produced a rapid increase<br />
during the initial period of sliding due to factors like plastic deformati<strong>on</strong>, c<strong>on</strong>tact area, and the intrinsic<br />
property of the composite material [4]. In these kind of testing the tendency of the curve changes with<br />
respect to the mechanism involved where either plastic deformati<strong>on</strong> or adhesi<strong>on</strong> determines the fricti<strong>on</strong><br />
behaviour [3]. However, the use of composites in rollers, gears and bearings has rolling comp<strong>on</strong>ent<br />
together with sliding to have the roll-slip phenomen<strong>on</strong> which is never studied. In such a case simultaneous<br />
occurrence of both the mechanism (adhesi<strong>on</strong>, plastic deformati<strong>on</strong>) creates difficulties to segregate the<br />
influence of individual comp<strong>on</strong>ents (rolling/sliding) over fricti<strong>on</strong> behaviour. Moreover, the presence two<br />
mechanisms simultaneously produces different topographies of c<strong>on</strong>tact surface. Thus the c<strong>on</strong>tact c<strong>on</strong>diti<strong>on</strong><br />
changes with respect to the used model producing incomparable results. A close standard to test the rollslip<br />
of composite-steel pair is the twin-disc model where <strong>on</strong>ly limited researches has been d<strong>on</strong>e for polymer<br />
– metal [5-8].<br />
In most of the tribological investigati<strong>on</strong>s the parameters is varied to place the material in the suitable<br />
applicati<strong>on</strong> range where velocity and load are the most comm<strong>on</strong> parameters [4, 9, 10]. From the<br />
fundamentals it is well known that load has a significant effect <strong>on</strong> the fricti<strong>on</strong> behaviour of the material. Liu<br />
et al <strong>on</strong> using different materials to investigate the influence of load <strong>on</strong> the tribological characteristics has<br />
proved that the fricti<strong>on</strong> force increases linearly with increasing load <strong>on</strong> using similar materials [11]. The<br />
difference between the material exists in the rate of increase of fricti<strong>on</strong> force to the normal force proves that<br />
most of the material has similar tendency as the effect of load.<br />
29<br />
Copyright © <str<strong>on</strong>g>2011</str<strong>on</strong>g> by Laboratory Soete
Sustainable C<strong>on</strong>structi<strong>on</strong> and Design <str<strong>on</strong>g>2011</str<strong>on</strong>g><br />
In the current research an open tribo system is used to study the fricti<strong>on</strong> behaviour of composite-steel pairs<br />
under rolling/sliding c<strong>on</strong>diti<strong>on</strong>s. Influencing factors like surface roughness or the composite pair, fricti<strong>on</strong>al<br />
heating and transfer film are suppressed by a specially developed program. Images from the c<strong>on</strong>tact<br />
surface are used to identify the dominating mechanisms involved in the fricti<strong>on</strong> process.<br />
2 MATERIALS AND METHODS<br />
On testing the composite-steel pair for roll-slip commercially available polyester composites (Orkot) is<br />
tested against 40CrMn tool steel. Orkot is used as a bearing material in marine applicati<strong>on</strong>s, the composite<br />
itself is impregnated with polyester resin and PTFE. Tests performed <strong>on</strong> Orkot against steel at 15 MPa has<br />
proven results having co-efficient of fricti<strong>on</strong> 0.13 (from datasheet). Material properties for both the materials<br />
are given in Table 1.<br />
Table 1. Materials properties<br />
Properties 40CrMn Orkot<br />
Yield strength [MPa] 415 55<br />
Young’s modulus [GPa] 205 3.3<br />
Impact Strength (Charpy) [kJ/m 2 ] 590<br />
122<br />
Hardness 220 HB 100 Rockwell M<br />
Maximum allowable service temp. [˚C] - 130<br />
To modelling the roll/slip phenomen<strong>on</strong> the twin-disc setup is the appropriate test device. On testing roll-slip<br />
a slip ratio will be involved which is the rolling to sliding ratio achieved by having different speeds fpor two<br />
disc. But, in the current setup both the shaft rotates at same speed and hence the required slip ratio is<br />
achieved by changing the diameter of the test material and the counterface material. In the used parameter<br />
the diameter of the polymer wheel was 120% compared to the steel wheel (100% = 74.93 mm), which<br />
means the slip ratio is 20%. Image of the twin disc set-up is shown in Figure 1. Under the measurement<br />
was used <strong>on</strong>line data acquisiti<strong>on</strong> system (Lab View). The fricti<strong>on</strong> torque was measure <strong>on</strong>line using a torque<br />
meter (4 – Lorenz Messtechnik DR-20-type) attached to the shaft of the counterface material. The<br />
temperature with infra red sensor (3) 180° away from the instant of c<strong>on</strong>tact point <strong>on</strong> the polymer wheel.<br />
Dead weights are used (5) to achieve c<strong>on</strong>stant normal force al<strong>on</strong>g the measurement. The speed of the two<br />
shaft c<strong>on</strong>trolled <strong>on</strong>line.<br />
4<br />
1<br />
2<br />
3<br />
5<br />
Figure 1. Twin-disc set-up to modelling rolling/sliding<br />
30<br />
Copyright © <str<strong>on</strong>g>2011</str<strong>on</strong>g> by Laboratory Soete
Sustainable C<strong>on</strong>structi<strong>on</strong> and Design <str<strong>on</strong>g>2011</str<strong>on</strong>g><br />
Four different dead weights are used to study the effect of the load <strong>on</strong> the fricti<strong>on</strong> behaviour of the<br />
composite-steel pair. The applied normal load and the corresp<strong>on</strong>ding c<strong>on</strong>tact mean and maximum c<strong>on</strong>tact<br />
pressure for a c<strong>on</strong>tact z<strong>on</strong>e is given in Table 2.<br />
Table 2. Show the normal force, Hertzian pressure and c<strong>on</strong>tact z<strong>on</strong>e for composite-steel pair<br />
Applied normal<br />
force [N]<br />
Maximum<br />
pressure [MPa]<br />
Mean pressure<br />
[MPa]<br />
C<strong>on</strong>tact area<br />
[mm×mm]<br />
61 77.23 60.66 0.126×8<br />
111 104.18 81.83 0.170×8<br />
161 125.47 98.55 0.204×8<br />
210 143.30 112.55 0.233×8<br />
A running in of 5 minutes is used prior to data collecti<strong>on</strong>, a test durati<strong>on</strong> of 2 minutes is used at low and<br />
high speed c<strong>on</strong>diti<strong>on</strong>. Every parameter was measured five times to check for the repeatability. Two different<br />
speeds 10 rpm (low) and 700 rpm (high) are used al<strong>on</strong>g with the different loads. All the tests are c<strong>on</strong>ducted<br />
at dry running c<strong>on</strong>diti<strong>on</strong> (because of the internal lubricati<strong>on</strong>s e.g. PTFE). Image of the c<strong>on</strong>tact surface is<br />
acquired before and after the measurement using Olympus SFX microscope and QiCAM video camera.<br />
3 RESULT AND DISCUSSION<br />
The current research was focused <strong>on</strong> studying the tribological behaviour of composite metal pair <strong>on</strong> dry<br />
running c<strong>on</strong>diti<strong>on</strong>. The aim of the experiments is to identify the boundary for fricti<strong>on</strong> behaviour under ideal<br />
c<strong>on</strong>diti<strong>on</strong> without the influence of fricti<strong>on</strong>al heating and the transfer layer. The Figure 2. shows the results<br />
using the same parameters for five time (10 rpm). It is clear from the plotted curve that the repeatability of<br />
the test are good where the curves follow the same pattern and line close to each other.<br />
25<br />
20<br />
Fricti<strong>on</strong> force [N]<br />
15<br />
10<br />
5<br />
0<br />
0 20 40 60 80 100 120 140 160<br />
Maximum pressure [MPa]<br />
Figure 2. Fricti<strong>on</strong> force at low velocity<br />
Curves were also plotted for two different speeds with fricti<strong>on</strong> force as a functi<strong>on</strong> of maximum pressure.<br />
Figure 3. illustrates the fricti<strong>on</strong> force with the fitted linear curve also having an error of ±2σ. From the plot a<br />
linear cure is the best fit to describe the tendency of the curve. But <strong>on</strong>e should keep in mind that this<br />
functi<strong>on</strong> is valid from 75 MPa. The lower limit of c<strong>on</strong>tact pressure for the operating c<strong>on</strong>diti<strong>on</strong> is important,<br />
because if the material is tested with low loads for e.g. 20 MPa maximum pressure it causes less than zero<br />
fricti<strong>on</strong> force (from this trend lines). Negative fricti<strong>on</strong> force cannot be achieved since there is always a<br />
fricti<strong>on</strong> force involved due to sliding and also a rolling resistance as well.The normal force has huge<br />
influence to the rolling resistance which is due to the intrinsic property of the material. In case of Orkot<br />
composite a relatively large young modulus (because the fibers) reduces the rolling resistance <strong>on</strong><br />
comparing with a comm<strong>on</strong> engineer polymer. The Table 3. c<strong>on</strong>tains the equati<strong>on</strong> from the curve fitting of<br />
the measured points.<br />
31<br />
Copyright © <str<strong>on</strong>g>2011</str<strong>on</strong>g> by Laboratory Soete
Sustainable C<strong>on</strong>structi<strong>on</strong> and Design <str<strong>on</strong>g>2011</str<strong>on</strong>g><br />
25<br />
20<br />
10 rpm measure<br />
700 rpm measure<br />
Fricti<strong>on</strong> force [N]<br />
15<br />
10<br />
5<br />
0<br />
0 20 40 60 80 100 120 140 160<br />
Maximum pressure [MPa]<br />
Figure 3. Effect of the pressure to the fricti<strong>on</strong> force<br />
Table 3. Equati<strong>on</strong>s of the fitted curves and their R 2 values<br />
Speed<br />
Equati<strong>on</strong> R 2 value<br />
10 rpm<br />
F = 0.106<br />
⋅ p − 4.690<br />
0.9323<br />
700 rpm F = 0.184<br />
⋅ p − 6. 134<br />
0.9831<br />
In case of high speed the inclinati<strong>on</strong> of the curve is almost two times bigger than the low speed. Where it is<br />
better to reduce the c<strong>on</strong>tact pressure (used bigger dimensi<strong>on</strong>s) <strong>on</strong> high speeds which leads to energy<br />
saving by having reduced fricti<strong>on</strong> force. But in case of low speed the larger geometry doesn’t cause<br />
c<strong>on</strong>siderable saving.<br />
Figure 4. shows the fricti<strong>on</strong> force as a functi<strong>on</strong> normal force for low and high speed c<strong>on</strong>diti<strong>on</strong>. The tendency<br />
of the fricti<strong>on</strong> curve for the corresp<strong>on</strong>ding normal forces follows a linear pattern which is same as that of the<br />
plot used in the fricti<strong>on</strong> force against the Hertzian pressure. Here, there are difference of the slope too.<br />
Important change that if choose smaller normal force (e.g 10 N), the fricti<strong>on</strong> force will positive values (based<br />
<strong>on</strong> the fitted curves). Because of this, the fitted curves are possible to describe the phenomen<strong>on</strong> in lower<br />
(e.g. 30 N) and higher (e.g. 230N) interval also.<br />
25<br />
20<br />
10 rpm 700 rpm<br />
Fricti<strong>on</strong> force [N]<br />
15<br />
10<br />
5<br />
0<br />
0 50 100 150 200 250<br />
Norm al force [N]<br />
Figure 4. Effect of the normal load to the fricti<strong>on</strong> force<br />
Because the linear effect there it is possible that the fricti<strong>on</strong> and the rolling coefficient are c<strong>on</strong>stant. Usually<br />
in case of high loads the adhesi<strong>on</strong> properties are c<strong>on</strong>sidered to be very important. But from the obtained<br />
32<br />
Copyright © <str<strong>on</strong>g>2011</str<strong>on</strong>g> by Laboratory Soete
Sustainable C<strong>on</strong>structi<strong>on</strong> and Design <str<strong>on</strong>g>2011</str<strong>on</strong>g><br />
result didn’t show c<strong>on</strong>siderable change (no blending in the results), which mean there is no vital effect of<br />
the adhesi<strong>on</strong>. May be the presence of PTFE could have possibly reduced the adhesi<strong>on</strong> effect. To clearly<br />
study the rolling and the sliding coefficient values further experiments needed.<br />
Tribological tests <strong>on</strong> evaluating the fricti<strong>on</strong> characteristics uses temperature to explain the tendency as a<br />
outcome of fricti<strong>on</strong>al heating. In the current research the influence of fricti<strong>on</strong>al heating is made negligible by<br />
allowing enough cooling time between two measurements and by using the cleaning agents which removes<br />
the induced heat in the test cycle. On measuring the temperature of the c<strong>on</strong>tact surface from the composite<br />
disc temperature of 24±2°C was observed which is close to the room temperature. Even with <strong>on</strong>line<br />
m<strong>on</strong>itoring system the measured surface temperature fluctuates a little. The temperature of the c<strong>on</strong>tact<br />
surface has reached a maximum value of 26˚C which is very low c<strong>on</strong>sidering the earlier researches <strong>on</strong><br />
rolling/sliding c<strong>on</strong>tacts of polymers, where the increase in temperature was up till 80°. Investigati<strong>on</strong> <strong>on</strong> the<br />
image of the c<strong>on</strong>tact surface also briefs that there is no deposit of polymer <strong>on</strong> the counterface material.<br />
4 MICROGRAPH<br />
Pictures of the c<strong>on</strong>tact surface were made using Olympus SRZ microscope. Images were captured before<br />
and after every test cycle for all loads. Figure 5(a) show the initial surface before testing where the fibers<br />
are not really visible to make potential change in the fricti<strong>on</strong> characteristics. But <strong>on</strong> the c<strong>on</strong>secutive testing<br />
the matrix tends to be removed and scale like surface morphology is seen showing the fibers leaving the<br />
matrix. The machine mark from the tool steel is also visible <strong>on</strong> Figure 5.<br />
(a)<br />
(b)<br />
(c)<br />
(d)<br />
(e)<br />
Figure 5. C<strong>on</strong>tact surface before test (a), after test in case of 61 N (b), 111 N (c), 161 N (d) and 210 N (e)<br />
33<br />
Copyright © <str<strong>on</strong>g>2011</str<strong>on</strong>g> by Laboratory Soete
Sustainable C<strong>on</strong>structi<strong>on</strong> and Design <str<strong>on</strong>g>2011</str<strong>on</strong>g><br />
The limited experiment time cause limited wear also. From 61 N to 210 N (Figure 5. b-e) the surface<br />
topography is almost the same. The rolling leads to periodical deformati<strong>on</strong>, which is actually little<br />
displacement close to the surface. This displacement breaks the joints between the polyester matrix and<br />
the textile. For this effect the matrix can easy remove that fields where the textile is close to the surface.<br />
This is the reas<strong>on</strong>, that after the experiments the textile structure becomes visible over the polymer surface.<br />
Effect of the load just the dept of the craters <strong>on</strong> the border between the textile and the matrix. Because the<br />
high normal load (and the high maximum c<strong>on</strong>tact pressure) larger displacement exhibits, which destroy the<br />
structure beneath the layers also.<br />
5 CONCLUSION<br />
Polymer composite which is widely used in the bearing industry is tested for the influence of load <strong>on</strong> the<br />
fricti<strong>on</strong> behaviour under low and high speed c<strong>on</strong>diti<strong>on</strong>. On both high and low speeds the fricti<strong>on</strong> force<br />
showed same tendency having a linear increase in fricti<strong>on</strong> force for increasing load. The rate of increase in<br />
fricti<strong>on</strong> force is much sensitive <strong>on</strong> high speed. The linear curves are well fitted, because in this system there<br />
is no effect of the temperature and the other c<strong>on</strong>diti<strong>on</strong>s were also steady. Based <strong>on</strong> the results the PTFE<br />
c<strong>on</strong>tent helps the composite to avoid the adhesi<strong>on</strong> effect also. If the applicati<strong>on</strong>s has high c<strong>on</strong>tact speed, it<br />
is worth to use larger dimensi<strong>on</strong>s to reduce the c<strong>on</strong>tact pressure. The new geometry leads to energy saving<br />
applicati<strong>on</strong>s, but in case of low loads this saving relatively less. From low load (61 N) the periodical stress<br />
lead cracks, craters and visible textile of the surface. High load <strong>on</strong>ly increases the depth of the cracks and<br />
craters.<br />
6 REFERENCES<br />
[1] Srivastava V.K., Pathak J.P., Fricti<strong>on</strong> and wear properties of bushing bearing of graphite filled short<br />
glass fibre composites in dry sliding, Wear 197(1-2), 145–150, 1996.<br />
[2] Kishore, Sampathkumaran P., Seetharamu S., Thomas P., Janardhana M., A study <strong>on</strong> the effect of the<br />
type and c<strong>on</strong>tent of filler in epoxy–glass composite system <strong>on</strong> the fricti<strong>on</strong> and slide wear characteristics,<br />
Wear, 259(1-6), 634–641, 2005.<br />
[3] Quintelier J., Online wear m<strong>on</strong>itoring of polymer matrix composites with advanced measurement<br />
techniques, Ph.D Thesis, Gent University, 2007.<br />
[4] Myshkin N.K., Petrokovets M.I., Kovalev A.V., Tribology of polymers: Adhesi<strong>on</strong>, fricti<strong>on</strong>, wear, and<br />
mass-transfer, Tribology <str<strong>on</strong>g>Internati<strong>on</strong>al</str<strong>on</strong>g>, 38(11-12), 910–921, 2005.<br />
[5] Hooke C.J., Kukureka S.N., Liao P., Rao M., Chen Y.K., The fricti<strong>on</strong> and wear of polymers in n<strong>on</strong>c<strong>on</strong>formal<br />
c<strong>on</strong>tacts, Wear, 200(1-2), 83–94, 1996.<br />
[6] Kukureka S.N., Chen Y.K., Hooke C.J., Liao P., The wear mechanisms of acetal in unlubricated rolling<br />
– sliding c<strong>on</strong>tact, Wear, 185(1-2), 1–8, 1995.<br />
[7] Gord<strong>on</strong>a D.H., Kukureka S.N., The wear and fricti<strong>on</strong> of polyamide 46 and polyamide 46/aramid-fibre,<br />
composites in sliding–rolling c<strong>on</strong>tact, Wear, 267(1-4), 669–678, 2009.<br />
[8] Chena Y.K., Modib O.P., Mhaya A.S., Chrysanthou A., O’Sullivan J.M., The effect of different metallic<br />
counterface materials and different surface treatments <strong>on</strong> the wear and fricti<strong>on</strong> of polyamide 66 and its<br />
composite in rolling–sliding c<strong>on</strong>tact, Wear, 255(1-6), 714–721, 2003.<br />
[9] Su F., Zhang Z.Z., Guo F., Men X.H., Liu W.M., Fricti<strong>on</strong> and wear properties of fabric/phenolic<br />
composites with plasma treated-hybrid glass/PTFE fabric, Composites Science and Technology, 67(6),<br />
981–988, 2007.<br />
[10] Gopal P., Dharani L. R., Blum F. D., Load, speed and temperature sensitivities of a carb<strong>on</strong>-fiber<br />
reinforced phenolic fricti<strong>on</strong> material, Wear, 181-183(Part 2 March), 913–921, 1995.<br />
[11] Liu Y., Schaefer J.A., The sliding fricti<strong>on</strong> of thermoplastic polymer composites tested at low speeds,<br />
Wear, 261(5-6), 568–577, 2006.<br />
34<br />
Copyright © <str<strong>on</strong>g>2011</str<strong>on</strong>g> by Laboratory Soete
Sustainable C<strong>on</strong>structi<strong>on</strong> and Design <str<strong>on</strong>g>2011</str<strong>on</strong>g><br />
HEIGHT-INDEPENDENT TOPOGRAPHIC PARAMETERS OF WORN<br />
SURFACES<br />
2<br />
I. Barányi 1,2 , Á. Czifra 1 , G. Kalácska 2<br />
1 Óbuda University, D<strong>on</strong>át Bánki Faculty of Mechanical Engineering and Security Technology<br />
Institute for Mechanical Engineering Technology, Faculty of Mechanical Engineering, Szent István<br />
University, Gödöllő,<br />
Abstract: Surface microtopography plays a dual role in the course of fricti<strong>on</strong> and wear processes. It affects<br />
the c<strong>on</strong>tact and temperature c<strong>on</strong>diti<strong>on</strong>s, and it undergoes significant changes in accordance with the wear<br />
mechanism. Fractal dimensi<strong>on</strong> (Df), root mean square gradient (Sdq), surface area ratio (Sdr) and surface<br />
kurtosis (Sku) parameters of microtopographies provides opportunities for understanding more deeply the<br />
wear processes independently from the amplitude of the roughness. Wear experiments and surface<br />
roughness measurements before and after wear were performed. Investigati<strong>on</strong>s extended to wear in the<br />
course of the n<strong>on</strong>-lubricated ferrodo-steel material pairs, and lubricated camshaft-bushing pairs.<br />
Keywords: wear, microtopography, power spectral density, fractal dimensi<strong>on</strong>, 3D parameters<br />
1 INTRODUCTION<br />
Efficient research in the course of the past decades has provided experts involved in surface<br />
microtopography research with a number of tools and methods to design an operati<strong>on</strong>ally optimized<br />
surface. At the same time, this knowledge is utilized <strong>on</strong>ly to a small degree in the analysis and c<strong>on</strong>trol of<br />
tribological processes. Characteristically, designers c<strong>on</strong>tinue to c<strong>on</strong>tent themselves by requiring few – first<br />
of all height-dependent – roughness parameters [1].<br />
In the first half of the 90s, computers of adequate speed of operati<strong>on</strong> and processing softwares became<br />
increasingly available, make it possible to realize 3D surface characterisati<strong>on</strong>. In the literature different<br />
directives can be found n<strong>on</strong>e of them has become widely used. Beside the extensi<strong>on</strong> of 2D parameter<br />
based technique to 3D many other new parameters and methods have been developed. One is the power<br />
spectral density (PSD) technique when “global” surface characterisati<strong>on</strong> is carried out using complex<br />
mathematical tools. PSD provides full length scale analysis which takes into c<strong>on</strong>siderati<strong>on</strong> not <strong>on</strong>ly the<br />
dominant topographic elements but also the submicro features, in c<strong>on</strong>trast with traditi<strong>on</strong>ally surface<br />
characterisati<strong>on</strong> methods. The fractal dimensi<strong>on</strong> derived from PSD topography seems to be an efficient tool<br />
for characterizati<strong>on</strong>. Some topographic parameters such as Sdr c<strong>on</strong>nected exclusively to 3D topographic<br />
analysis, but some others have 2D pairs (for instance Sdq or Sku).<br />
In the course of fricti<strong>on</strong> and wear processes, surface topography plays a dual role. On the <strong>on</strong>e hand, it<br />
affects the c<strong>on</strong>tact and temperature c<strong>on</strong>diti<strong>on</strong>s occurring between the c<strong>on</strong>tacting surfaces which determine<br />
the tribological process together with a third body; <strong>on</strong> the other hand, it undergoes significant changes in<br />
accordance with the wear mechanism operating between the surfaces.<br />
In the present study topographical measurements and special 3D parameter-based characterizati<strong>on</strong>s were<br />
performed to study the changes of microtopographies in wear. Laboratory wear tests of ferrodo-steel sliding<br />
pair were carried out and also industrial worn machine elements were investigated. Fractal dimensi<strong>on</strong> (Df),<br />
root mean square (RMS) gradient (Sdq), surface area ratio (Sdr) and surface kurtosis (Sku) of topographies<br />
before and after wear were analysed and compared.<br />
2 INVESTIGATED TOPOGRAPHIES<br />
The first part of investigati<strong>on</strong> was the wear test of ferrodo-steel sliding pair. Steel (55Si7) sliding tracks were<br />
used for the tests, <strong>on</strong> which ⎠ 18 mm ferodo specimens were slid. The steel had ground surfaces. Two<br />
different grinding wheels were used for producing ‘fine’ (sign: F) and ‘rough’ (sign: R) surfaces. Two<br />
machining directi<strong>on</strong>s were used: <strong>on</strong>e of them was perpendicular to (sign: N) while the other was parallel<br />
(sign: P) with the sliding directi<strong>on</strong>. The stroke of the sliding was 180 mm and the load was 1000 N. The<br />
sliding speed was 50 mm/s. No lubricati<strong>on</strong> was applied. First test series were slide for 2 hours while the<br />
sec<strong>on</strong>d test series were slide for 6 hours. Steel track microtopography was recorded at two different places<br />
using a Mahr Perthen C<strong>on</strong>cept 3D type stylus instrument. The size of the surface measured was 1x1 mm<br />
and the sampling distance was 2 μm in both directi<strong>on</strong>s. Measurements were performed <strong>on</strong> identical surface<br />
35<br />
Copyright © <str<strong>on</strong>g>2011</str<strong>on</strong>g> by Laboratory Soete
Sustainable C<strong>on</strong>structi<strong>on</strong> and Design <str<strong>on</strong>g>2011</str<strong>on</strong>g><br />
secti<strong>on</strong>s before and after the wear process, therefore the changes of a given surface secti<strong>on</strong> can be traced<br />
accurately, not <strong>on</strong>ly statistically, in the course of the wear process.<br />
The sec<strong>on</strong>d part of investigati<strong>on</strong>s was the topographic measurements of camshaft-bushing pair. Original<br />
and worn <strong>on</strong>e was measured from both of them. The worn camshaft and thrust bushing was operated<br />
115000 km in a car. Measurement topography size and also the sampling distance were similar than in<br />
case of steel sliding track. Table 1 summarise the wear tests parameters and set-up of topographic<br />
measurements.<br />
Sliding<br />
pair<br />
Cam-shaft -<br />
Ferrodo-steel<br />
Bushing<br />
Steel<br />
Cam<br />
Specimen<br />
Bushing<br />
Wear<br />
time<br />
2 h<br />
6h<br />
115000 km<br />
Machining vs.<br />
Sliding directi<strong>on</strong><br />
Paralell (P)<br />
Perpendicular (N)<br />
Perpendicular (N)<br />
Paralell (P)<br />
Paralell (P)<br />
Average<br />
roughness of<br />
original<br />
topography<br />
Fine (F)<br />
Sa≅0.2 µm<br />
Rough (R)<br />
Sa≅1.6 µm<br />
(F)<br />
Sa≅0.2 µm<br />
(R)<br />
Sa≅1.6 µm<br />
(F)<br />
Sa≅0.1 µm<br />
(F)<br />
Sa≅0.3 µm<br />
Very fine (VF)<br />
Sa≅0.04 µm<br />
Table 1. Wear test and measuring c<strong>on</strong>diti<strong>on</strong>s<br />
Repetiti<strong>on</strong>s of<br />
topography<br />
measurements<br />
2<br />
2<br />
Sign<br />
2hPF_A<br />
2hPF_B<br />
2hPR_C<br />
2hPR_D<br />
2 2hNF_E..F<br />
2 2hNR_G..H<br />
6 6hNF_I..N<br />
1 Ch115PF_O<br />
1 Bu115PWF_P<br />
Figure 1.-3. show some topographies. The original microtopography of 2hNF_E surface disappeared and<br />
new surface texture was formed in accordance with the directi<strong>on</strong> of relative movement. The scratches<br />
formed seem “fine” and uniform. In case of Figure 2. the original surface texture has not disappeared, but<br />
the peak z<strong>on</strong>e of microtopography changed: scratches were formed in the sliding directi<strong>on</strong>. Figures 3. show<br />
chamshaft and bushing surfaces formed by abrasive wear similar than steel surface in Figure 1. and 2.<br />
Scratches are laying l<strong>on</strong>g <strong>on</strong> the surfaces, and they are not too deep, so abrasive mild wear can be<br />
supposed in all cases.<br />
Figure 1. 2hNF_E surface before wear and after 2 hour sliding<br />
36<br />
Copyright © <str<strong>on</strong>g>2011</str<strong>on</strong>g> by Laboratory Soete
Sustainable C<strong>on</strong>structi<strong>on</strong> and Design <str<strong>on</strong>g>2011</str<strong>on</strong>g><br />
Figure 2. 2hNR_H surface before wear and after 2 hour sliding<br />
Figure 3. Worn surface of chamshaft (Ch115PF_O) and thrust bushing (Bu115PWF_P)<br />
3 CHARACTERISATION TECHNIQUE<br />
To characterize the measured topographies an algorithm was developed in cooperati<strong>on</strong> with Department of<br />
Machine and Industrial Product Design, Budapest University of Technology and Ec<strong>on</strong>omics and interpreted<br />
as a parametric-based 3D surface and PSD analysis software. Theoretical base of 3D parameters and PSD<br />
analysis are summarised as follows. Details can be found in [2, 3 and 4].<br />
The root mean square gradient, Sdq, is the RMS-value of the surface slope within the sampling area, and is<br />
defined as (1).<br />
( )( ) ∑∑<br />
M −1<br />
N −1<br />
2<br />
( x , y ) − z( x , y ) ⎞ ⎛ z( x , y ) − z( x y )<br />
2<br />
N M<br />
1 ⎛ z<br />
i j i−1 j−1<br />
i j i−1,<br />
j−1<br />
⎞<br />
(1)<br />
Sdq =<br />
⎜<br />
⎟ +<br />
⎜<br />
⎟<br />
j= 2 i=<br />
2 ⎝ ∆x<br />
⎠ ⎝ ∆y<br />
⎠<br />
where z(x i , y j ) is the height coordinate located in x i , y j , M is the number of points in profile, N is number of<br />
profiles, Δx, Δy sampling distances.<br />
The surfaces area ratio, Sdr, expresses the increment of the interfacial surface area relative to the area of<br />
the projected plane (2).<br />
Sdr =<br />
N − 1 M −1<br />
=<br />
∑ ∑ Ai , j<br />
− ( M − 1)( N − 1)<br />
j 1 i 1<br />
( M − 1)( N − 1) ∆x∆y<br />
∆x∆y<br />
= (2)<br />
The surface kurtosis, Sku, describes the "peakedness" of the surface topography, and is defined as (3), where Sq is the<br />
RMS value of topography. For Gaussian height distributi<strong>on</strong>s Sku approaches 3.0 when increasing the number of<br />
pixels. Smaller values indicate broader height distributi<strong>on</strong>s.<br />
( x , )<br />
1<br />
Sku =<br />
(3)<br />
MNSq<br />
N M<br />
4<br />
∑∑ z<br />
i<br />
y<br />
4 j<br />
j= 1 i=<br />
1<br />
PSD analysis transforms the profile from the spatial domain to frequency <strong>on</strong>e using Fourier transformati<strong>on</strong>.<br />
Transformati<strong>on</strong> gives complex result The power spectral density assigns an “amplitude” – magnitude of the<br />
complex number – to the frequency pair p k , q l . There are two possibilities of showing results. One is to<br />
represent the amplitude of PSD in the functi<strong>on</strong> of wavelength. The other prevalent method is logarithmic<br />
scale frequency-PSD amplitude visualizati<strong>on</strong>. In the sec<strong>on</strong>d method the height frequency range of the curve<br />
can be approximated by a line. The slope of the line is in correlati<strong>on</strong> with the fractal dimensi<strong>on</strong> of surface.<br />
Wavelengths smaller than the highest dominant wavelength plays a c<strong>on</strong>siderable role. PSD amplitude<br />
becomes c<strong>on</strong>stant – the self-affinity character of the surface disappears – in a lower wavelength range. The<br />
slope of fitted line (s) to PSD curve has correlati<strong>on</strong> with fractal dimensi<strong>on</strong> of surface according to (4).<br />
37<br />
Copyright © <str<strong>on</strong>g>2011</str<strong>on</strong>g> by Laboratory Soete
Sustainable C<strong>on</strong>structi<strong>on</strong> and Design <str<strong>on</strong>g>2011</str<strong>on</strong>g><br />
s<br />
Df = 4 +<br />
(4)<br />
2<br />
4 RESULTS<br />
Changes of Sdq and Sdr parameter in wear are summarised in Table 2 and Figure 4 and 5. Both<br />
parameters change dramatically. Some cases the change is higher than 100%. Sdr parameter is very<br />
sensitive for wear: its change is higher than 50% in all cases. In cases of A, B, G, H both parameters<br />
increases, although the wear process of A-H specimens are the same. The Sdq value after wear – using<br />
similar test set up – becomes similar. In case of A-H this value is in range 3.62-7.08°, although the original<br />
topographies have wide range (2.73-12.76°) of this parameter. Analysing the results of six-hour wear<br />
process the c<strong>on</strong>clusi<strong>on</strong> is the same.<br />
Sign<br />
before<br />
wear<br />
Sdq [ °]<br />
after<br />
wear<br />
Change<br />
in %<br />
before<br />
wear<br />
Sdr [-]<br />
after<br />
wear<br />
Change<br />
in %<br />
2hPF_A 2.79 5.37 -92.47 0.06 0.36 -500.0<br />
2hPF_B 3.12 3.62 -16.03 0.09 0.14 -55.6<br />
2hPR_C 11.07 6.31 43.00 1.82 0.54 70.3<br />
2hPR_D 13.35 7.08 46.97 2.69 0.69 74.3<br />
2hNF_E 11.85 5.02 57.64 2.05 0.32 84.4<br />
2hNF_F 12.56 5.20 58.60 2.33 0.35 85.0<br />
2hNR_G 2.73 6.77 -147.99 0.06 0.62 -933.3<br />
2hNR_H 2.90 5.41 -86.55 0.08 0.38 -375.0<br />
6hNF_I 8.55 1.26 85.26 1.05 0.003 99.7<br />
6hNF_J 9.23 1.30 85.92 1.24 0.004 99.7<br />
6hNF_K 8.49 1.63 80.80 1.04 0.011 98.9<br />
6hNF_L 8.55 1.14 86.67 1.05 0.002 99.8<br />
6hNF_M 8.52 1.54 81.92 1.04 0.016 98.5<br />
6hNF_N 8.24 1.47 82.16 0.97 0.011 98.9<br />
Ch115PF_O 5.25 1.30 75.24 0.35 0.012 96.57<br />
Bu115PWF_P 0.33 0.70 -112.12 0.0001 0.0002 -100.00<br />
Table 2. RMS slope and surface area ratio before and after wear<br />
RMS gradient, Sdq [ °]<br />
15<br />
10<br />
5<br />
0<br />
before wear<br />
after wear<br />
A B C D E F G H I J K L M N O P<br />
Figure 4. RMS slope before and after wear<br />
38<br />
Copyright © <str<strong>on</strong>g>2011</str<strong>on</strong>g> by Laboratory Soete
Sustainable C<strong>on</strong>structi<strong>on</strong> and Design <str<strong>on</strong>g>2011</str<strong>on</strong>g><br />
Surfaces area ratio, Sdr [-]<br />
3<br />
2<br />
1<br />
0<br />
before wear<br />
after wear<br />
A B C D E F G H I J K L M N O P<br />
Figure 5. Surface area ratio before and after wear<br />
It is also interesting that behaviour of Sdq and Sdr parameters is uniform. Examining the definiti<strong>on</strong>s of these<br />
parameters the experinece is understadable. If the topogrpahy has higher RMS gradient it means, that<br />
enveloping surface is higher so Sdr parameter also has higher value. Because of the very sensitive<br />
character of Sdr in general case Sdq seems more effective.<br />
Fractal dimensi<strong>on</strong>s of topographies before and after wear, as the results of analysis were presented in [5].<br />
Now its correlati<strong>on</strong> with other parameters is analysed. Table 3 summarises the results and Figure 6 shows<br />
the fractal dimensi<strong>on</strong> before and after wear, while Figure 7 shows the surface kurtosis.<br />
Sign<br />
before<br />
wear<br />
Df [-]<br />
after<br />
wear<br />
Change<br />
in %<br />
before<br />
wear<br />
Sku [-]<br />
after<br />
wear<br />
Change<br />
in %<br />
2hPF_A 2.78 2.80 0.72 3.14 12.00 -282.17<br />
2hPF_B 2.88 2.76 -4.13 3.57 3.94 -10.36<br />
2hPR_C 2.89 2.71 -6.17 2.00 2.26 -13.00<br />
2hPR_D 2.80 2.67 -4.49 2.42 3.18 -31.40<br />
2hNF_E 2.77 2.80 0.89 3.40 8.74 -157.06<br />
2hNF_F 2.73 2.68 -1.60 5.02 4.54 9.56<br />
2hNR_G 2.72 2.57 -5.58 2.18 2.88 -32.11<br />
2hNR_H 2.84 2.65 -6.67 3.07 4.25 -38.44<br />
6hNF_I 2.84 2.65 -6.82 3.20 3.05 4.69<br />
6hNF_J 2.92 2.58 -11.65 3.08 3.77 -22.40<br />
6hNF_K 2.87 2.52 -12.22 3.54 2.48 29.94<br />
6hNF_L 2.92 2.79 -4.40 3.38 2.86 15.38<br />
6hNF_M 2.79 2.99 7.19 3.80 5.83 -53.42<br />
6hNF_N 2.80 2.76 -1.37 4.94 4.70 4.86<br />
Ch115PF_O 2.78 2.43 -12.72 3.62 2.91 19.61<br />
Bu115PWF_P 2.92 2.31 -20.88 3.94 2.51 36.29<br />
Table 3. Fractaldimensi<strong>on</strong> and surface kurtosis before and after wear<br />
As was c<strong>on</strong>cluded in [5] fractal dimensi<strong>on</strong> – in c<strong>on</strong>trast with other parameters – have correlati<strong>on</strong> with wear:<br />
Df decreased in examined wear processes. Only three case were where Df increased, but topographies in<br />
these cases have deep groves formed by wear particles.<br />
Increase of Sku paramer was supposed before the tests, because of platou-like character of mild wear<br />
surfaces. The results do not c<strong>on</strong>firm this statement. The change of kurtosis was minimal, and in some<br />
cases the parameter decreased. Topographies of six-hour wear process (sign I-N) have kurtosis between<br />
3.08–4.94 before wear. However the same process was carried out Sku chenged between -53.42 and<br />
29.94 %. No correlati<strong>on</strong> with wear process was found. Only <strong>on</strong>e interesting thing must be menti<strong>on</strong>ed:<br />
chanege of kurtosis was significant (more than 50%) in three cases. In these cases fractal dimensi<strong>on</strong> was<br />
increased. It means that not <strong>on</strong>ly the fractal analysis, but parameter surface kurtosis is sensitive for deep<br />
grooves of topographies. The fourth power in definit<strong>on</strong> of Sku explain this phenomen<strong>on</strong>.<br />
39<br />
Copyright © <str<strong>on</strong>g>2011</str<strong>on</strong>g> by Laboratory Soete
Sustainable C<strong>on</strong>structi<strong>on</strong> and Design <str<strong>on</strong>g>2011</str<strong>on</strong>g><br />
Fractal dimensi<strong>on</strong>, Df [-]<br />
3<br />
2.75<br />
2.5<br />
2.25<br />
2<br />
before wear<br />
after wear<br />
A B C D E F G H I J K L M N O P<br />
Figure 6. Fractal dimensi<strong>on</strong> before and after wear<br />
Surface Kurtosis, Sku [-]<br />
12<br />
9<br />
6<br />
3<br />
0<br />
before wear<br />
after wear<br />
A B C D E F G H I J K L M N O P<br />
5 CONCLUSIONS<br />
Figure 7. Surface curtosis before and after wear<br />
Results can be summarised as follows:<br />
Root mean squere slope (Sdq) and areal ratio (Sdr) parameters characterise similar features of<br />
topogrpahies, but Sdr parameter is more sensitive for changes.<br />
Fractal dimensi<strong>on</strong> (Df) of surfaces was decreased in case of mild wear, but special surface features – such<br />
as deep groves – increased its values.<br />
Surface kurtosis (Sku) has no correlati<strong>on</strong> with wear process, but it is sensitive for appearance of deep<br />
groves: Sku value draatrically increased.<br />
References<br />
[1] Horváth S. 2D and 3D characterizati<strong>on</strong> of surface waviness; survey and analysis of its impact <strong>on</strong><br />
operati<strong>on</strong>al characteristics. Disserati<strong>on</strong>, Nati<strong>on</strong>al Defence University 2008<br />
[2] Stout KJ, Sullivan PJ, D<strong>on</strong>g WP, Mainsah E, Luo N, Mathia T, Zahouni H. The development of<br />
methods for characterisati<strong>on</strong> of roughness in three dimensi<strong>on</strong>s. University of Birmingham Edgbust<strong>on</strong><br />
1993.<br />
[3] Perss<strong>on</strong> BNJ, Albohr O, Trataglino U, Volokitin AI, Tosatti E. On the nature of surface roughness with<br />
applicati<strong>on</strong> to c<strong>on</strong>tact mechanics, sealing, rubber fricti<strong>on</strong> and adhesi<strong>on</strong>. J. Phys, C<strong>on</strong>dens. Matter<br />
2005;17:R1-R62<br />
[4] Blateyr<strong>on</strong>, F.: New 3D Parameters and Filtrati<strong>on</strong> Techniques for Surface Metrology, Quality<br />
Magazine, White Paper, May 15, 2007<br />
[5] István Barányi, Árpád Czifra, Sándor Horváth: Power spectral density (PSD) analysis of worn<br />
Surfaces, Gépészet 2010 Proceedings of the seventh c<strong>on</strong>ference <strong>on</strong> mechanical engineering,<br />
Budapest,2010. május 25-26, ISBN 978-963-313-007-0<br />
40<br />
Copyright © <str<strong>on</strong>g>2011</str<strong>on</strong>g> by Laboratory Soete
Sustainable C<strong>on</strong>structi<strong>on</strong> and Design <str<strong>on</strong>g>2011</str<strong>on</strong>g><br />
REVIEW AND CLASSIFICATION OF FRETTING FATIGUE TEST RIGS<br />
J. De Pauw 1 , P. De Baets 1 and W. De Waele 1<br />
1<br />
Ghent University, Laboratory Soete, Belgium<br />
Abstract There is no standard or generally accepted test rig for fretting fatigue experiments. Therefore,<br />
researchers adopt an existing c<strong>on</strong>cept, or build a new test rig that meets their specific requirements.<br />
However, too many different test rigs may be disadvantageous because the results of two different test rigs<br />
are hard to compare. The increasing amount of diversity is mainly caused by the lack of a recent literature<br />
survey <strong>on</strong> fretting fatigue test rigs. In 1994, Hills and Nowell described a few test rigs in Mechanics Of<br />
Fretting Fatigue. In this study, the authors made a classificati<strong>on</strong> of test rigs based <strong>on</strong> the c<strong>on</strong>tact geometry,<br />
which is determined by the test specimens, not by the test rig itself.<br />
The authors of this article present a review of the available literature, and present a classificati<strong>on</strong> based <strong>on</strong><br />
the properties of test rigs. Fretting fatigue test rigs are first divided in two categories based <strong>on</strong> the geometry<br />
of the test specimen: full scale and coup<strong>on</strong> scale test rigs. The latter are mostly used to perform research<br />
and are subdivided in categories based <strong>on</strong> increasing functi<strong>on</strong>alities. This is the ability to apply a fatigue<br />
load, a c<strong>on</strong>stant normal force, and an alternating slip in the range of some micrometers. In time, from the<br />
fifties until now, progress has been seen in the design of fretting fatigue test rigs. More parameters can be<br />
c<strong>on</strong>trolled during experiments and more measuring techniques are incorporated. State of the art test rigs<br />
are classified in the last category with most functi<strong>on</strong>alities, but still have imperfecti<strong>on</strong>s. Future designers<br />
can use this article to classify their needs, or help to design a better test rig knowing the imperfecti<strong>on</strong>s of<br />
the state of the art test rigs.<br />
Keywords Fretting fatigue, test rig, coup<strong>on</strong> scale, full scale, classificati<strong>on</strong><br />
1 INTRODUCTION<br />
Fretting fatigue occurs frequently in mechanical c<strong>on</strong>necti<strong>on</strong> techniques such as bolted lap-joints, press fit<br />
c<strong>on</strong>necti<strong>on</strong>s, dovetail c<strong>on</strong>necti<strong>on</strong>s, splined couplings, … Early failures of such c<strong>on</strong>necti<strong>on</strong>s can cause<br />
failure of the whole mechanical c<strong>on</strong>structi<strong>on</strong>s. To prevent unexpected failures caused by fretting fatigue, a<br />
well-founded estimati<strong>on</strong> of the lifetime is needed. Lifetime can be measured during experiments or<br />
calculated by theories that are validated by experiments.<br />
Experiments are performed <strong>on</strong> a test rig that is capable to test fretting fatigue. However, there is no<br />
standard or generally accepted test rig to test fretting fatigue. Therefore, researchers copy literature<br />
designs, or design a custom test rig that meet their specific requirements. The proliferati<strong>on</strong> of test rigs has<br />
negative c<strong>on</strong>sequences though. Results obtained from two different test rigs are very difficult to compare<br />
with each other. A slight difference in the compliance of the test rig has already a significant influence <strong>on</strong><br />
the result in a fretting fatigue experiment. Next to the c<strong>on</strong>structi<strong>on</strong>s of the test rigs, the test specimen<br />
geometry has a significant influence <strong>on</strong> the result of an experiment as well. Figure 1 shows the stress field<br />
during two experiments, <strong>on</strong>ly the height h of the fretting bridges is changed, which is always arbitrarily<br />
chosen. The stress field in both experiments is very different as well as the c<strong>on</strong>tact pressure distributi<strong>on</strong>.<br />
41<br />
Copyright © <str<strong>on</strong>g>2011</str<strong>on</strong>g> by Laboratory Soete
Sustainable C<strong>on</strong>structi<strong>on</strong> and Design <str<strong>on</strong>g>2011</str<strong>on</strong>g><br />
h<br />
h<br />
Figure 1. Photo elastic picture of the stress field, with different height h of the fretting bridges [1].<br />
Without a standard, or recent overview of existing test rigs, researchers are forced to design their own test<br />
rig, increasing the number of test rig c<strong>on</strong>cepts. This problem was broached in 1990 during the first<br />
c<strong>on</strong>ference <strong>on</strong> fretting fatigue, Standardizati<strong>on</strong> of fretting fatigue methods and equipment [1]. However,<br />
twenty years later there is still no standard. The best overview of fretting fatigue tests known to the authors<br />
dates from 1994 in Mechanics of fretting fatigue [2] by Hills and Nowell. However, over the last 16 years<br />
there was a progress in test rigs both qualitative and quantitative that is not yet summarized.<br />
The authors of this article give a classificati<strong>on</strong> of test rigs, based solely <strong>on</strong> the properties of the test rig. This<br />
in c<strong>on</strong>trast with Hills and Nowell [2] who made a classificati<strong>on</strong> for fretting fatigue tests based <strong>on</strong> the<br />
specimen geometry rather than the performance of test rigs.<br />
2 FEATURES OF A FRETTING FATIGUE TEST RIG<br />
Fretting fatigue in <strong>on</strong>e c<strong>on</strong>tact point is schematically shown in Figure 2. Two specimens, a fatigue specimen<br />
(specimen) and an indenter (pad) are preloaded <strong>on</strong>to each other with a c<strong>on</strong>stant force F N . The indenter is<br />
alternately moving with an amplitude d, the amplitude of the resulting slip s is in the range of some (1..100)<br />
micrometer and fretting will occur between the pad and the specimen. Fatigue is introduced in the<br />
specimen by an alternating load F fat .<br />
Pad<br />
Specimen<br />
Figure 2. Schematic overview of fretting fatigue.<br />
The schematic overview of Figure 2 describes fretting fatigue for <strong>on</strong>e c<strong>on</strong>tact point. Most fretting fatigue<br />
experiments have multiple c<strong>on</strong>tact points for symmetry reas<strong>on</strong>s. However, to perform a fretting fatigue<br />
experiment <strong>on</strong>e needs to apply two forces and <strong>on</strong>e slip in the c<strong>on</strong>tact area:<br />
A c<strong>on</strong>stant force F N<br />
A dynamic force F fat<br />
A relative slip s<br />
42<br />
Copyright © <str<strong>on</strong>g>2011</str<strong>on</strong>g> by Laboratory Soete
Sustainable C<strong>on</strong>structi<strong>on</strong> and Design <str<strong>on</strong>g>2011</str<strong>on</strong>g><br />
These features are not always independently c<strong>on</strong>trolled. For scientists who want to perform state of the art<br />
research it is interesting to c<strong>on</strong>trol every parameter independently. If all the input parameters are known, a<br />
lot of experiments can be performed. However, industrial researchers d<strong>on</strong>’t know all the input parameters<br />
for this model. Therefore they perform experiments <strong>on</strong> full scale pieces and apply forces like in the real<br />
applicati<strong>on</strong>. The interacting forces F N , F fat and the slip s in <strong>on</strong>e c<strong>on</strong>tact area are coupled with each other by<br />
geometry, just like in the real applicati<strong>on</strong>.<br />
The difference between full scale experiments and coup<strong>on</strong> scale experiments is the specimen geometry.<br />
The specimens in full scale experiments are real geometries like a dovetail c<strong>on</strong>necti<strong>on</strong>, lap joint, etc. While<br />
the geometry of the specimens in a coup<strong>on</strong> scale experiment <strong>on</strong> the other hand is not related to a real<br />
problem. The geometry focuses <strong>on</strong> the c<strong>on</strong>tact area where fretting fatigue initiates, as shown in Figure 2.<br />
Different test rigs are needed to perform full scale experiments or coup<strong>on</strong> scale experiments. During<br />
coup<strong>on</strong> scale experiments we want to measure and c<strong>on</strong>trol as much parameters as possible, preferably<br />
independent <strong>on</strong>es. In a full scale experiment however, <strong>on</strong>ly those forces are applied that appear in the real<br />
applicati<strong>on</strong>.<br />
The classificati<strong>on</strong> of test rigs has a first subdivisi<strong>on</strong> between full scale test rigs and coup<strong>on</strong> scale test rigs.<br />
The next paragraph discusses and enumerates some full scale test rigs. Paragraph 4 focuses <strong>on</strong> coup<strong>on</strong><br />
scale test rigs, further subdivisi<strong>on</strong> of test rigs will be expanded in this secti<strong>on</strong>.<br />
3 FULL SCALE TEST RIGS<br />
<str<strong>on</strong>g>Full</str<strong>on</strong>g> scale test rigs are mostly used in industrial research, to estimate the lifetime of a comp<strong>on</strong>ent. The<br />
geometry of the test specimen is (scaled) related to the real applicati<strong>on</strong>.<br />
The advantage of a full scale test is the similarity in c<strong>on</strong>tact mechanics, because c<strong>on</strong>tact geometry and<br />
stiffness are similar. Another advantage is that <strong>on</strong>ly the known forces are applied. Test rigs for full scale<br />
tests usually <strong>on</strong>ly need <strong>on</strong>e actuator, with a simple c<strong>on</strong>troller.<br />
The applied force <strong>on</strong> the full scale geometry results in <strong>on</strong>e or more c<strong>on</strong>tact points where fretting fatigue can<br />
occur. In such a c<strong>on</strong>tact point there is a c<strong>on</strong>stant force F N , a dynamic force F fat and a relative slip s.<br />
However, these forces and slip are related to the applied force and cannot be c<strong>on</strong>trolled individually, nor be<br />
measured. Therefore, verificati<strong>on</strong> with coup<strong>on</strong> scale test is n<strong>on</strong>existent. Even verificati<strong>on</strong> between two<br />
similar full scale test rigs is difficult, because the compliance of the specimens and the test rigs will<br />
determine the distributi<strong>on</strong> of the normal force F N , the fatigue force F fat , and the relative slip s.<br />
<str<strong>on</strong>g>Full</str<strong>on</strong>g> scale tests are more expensive than coup<strong>on</strong> scale tests, therefore full scale test are <strong>on</strong>ly used when<br />
ec<strong>on</strong>omically justified, for example to predict the lifetime of c<strong>on</strong>necti<strong>on</strong> techniques in aerospace industry.<br />
An ordinary airplane has several c<strong>on</strong>necti<strong>on</strong> techniques that can fail due to fretting fatigue. The shell of an<br />
aircraft is c<strong>on</strong>structed by aluminum sheets that are bolted or riveted together, these lap joints are sensitive<br />
to fretting fatigue [3]. In the engine of an aircraft there are two c<strong>on</strong>necti<strong>on</strong> techniques that can fail due to<br />
fretting fatigue. A dovetail c<strong>on</strong>necti<strong>on</strong> to c<strong>on</strong>nect the turbine blades <strong>on</strong>to the rotor (paragraph 3.1 ), and a<br />
splined c<strong>on</strong>necti<strong>on</strong> to c<strong>on</strong>nect parts of the engine [4-6].<br />
Another applicati<strong>on</strong> where a full scale fretting fatigue test rig has been build comes from the oil and gas<br />
industry. To mine and transport oil and gas, pipelines are used. Pipelines are sometimes joined by a<br />
threaded c<strong>on</strong>necti<strong>on</strong> that fails due to fretting fatigue [7], leading to costly repairs and expensive downtime.<br />
The aim of the full scale experiment is to determine the lifetime of such a c<strong>on</strong>necti<strong>on</strong> accurately.<br />
<str<strong>on</strong>g>Full</str<strong>on</strong>g> scale test rigs are also used to test c<strong>on</strong>necti<strong>on</strong> techniques that are frequently used but still give<br />
problems, like press-fitted c<strong>on</strong>necti<strong>on</strong>s [8-11]. This c<strong>on</strong>necti<strong>on</strong> technique is frequently used to c<strong>on</strong>nect a<br />
shaft with a bearing, a gear, a flywheel, etc. The last full scale test rig listed in this article is used to test the<br />
fretting fatigue properties of a leaf spring package that is used for cars [12].<br />
An overview of some existing full scale test rigs is given in Table 1. This table indicates how the fatigue<br />
force F fat , the normal force F N , and the relative slip s are applied during an experiment. Most of the full<br />
scale test rigs have <strong>on</strong>ly <strong>on</strong>e actuator to apply the dynamic fatigue force. The slip is always dependent of<br />
the applied force and the local geometry. How the normal force is applied depends <strong>on</strong> the applicati<strong>on</strong>.<br />
43<br />
Copyright © <str<strong>on</strong>g>2011</str<strong>on</strong>g> by Laboratory Soete
Sustainable C<strong>on</strong>structi<strong>on</strong> and Design <str<strong>on</strong>g>2011</str<strong>on</strong>g><br />
Table 1. Overview of how the interacting forces and slip are applied in full scale experiments<br />
Fatigue force Normal force Slip<br />
Dovetail<br />
c<strong>on</strong>necti<strong>on</strong><br />
Applied by actuator<br />
Due to actuator<br />
Due to geometry and<br />
fatigue force<br />
Bolted or<br />
riveted lap<br />
c<strong>on</strong>necti<strong>on</strong><br />
Applied by actuator<br />
Pre stress bolt or rivet<br />
Due to geometry and<br />
applied forces<br />
Wire rope Applied by actuator Pre stress by dead weight<br />
Due to geometry and<br />
fatigue force<br />
Wire rope<br />
c<strong>on</strong>necti<strong>on</strong><br />
Applied by actuator<br />
Pre stress by dead weight<br />
Due to geometry and<br />
applied force<br />
Press-fit<br />
c<strong>on</strong>necti<strong>on</strong>s<br />
Applied by electric motor<br />
and geometry<br />
Press fit geometry<br />
Due to geometry and<br />
applied forces<br />
Splined<br />
coupling<br />
Applied by actuator<br />
Pre stress by spring system<br />
Due to geometry and<br />
applied forces<br />
Threaded<br />
c<strong>on</strong>necti<strong>on</strong>s<br />
Applied by electric motor<br />
and geometry<br />
Pre stress in threaded<br />
c<strong>on</strong>necti<strong>on</strong><br />
Due to geometry and<br />
applied forces<br />
Leaf spring<br />
Applied by actuator<br />
Pre stress of leaf spring<br />
package<br />
Due to geometry and<br />
applied forces<br />
The next two paragraphs give more details about two full scale test rigs. The first test rig is used to test<br />
dovetail c<strong>on</strong>necti<strong>on</strong>s, a typical c<strong>on</strong>necti<strong>on</strong> technique in aircraft engines, steam turbines and other turbines.<br />
The sec<strong>on</strong>d test rig is developed to test wire ropes that are used as overhead c<strong>on</strong>ductors.<br />
3.1 Dovetail c<strong>on</strong>necti<strong>on</strong>s<br />
Modern aircraft engines (turboprop) are based <strong>on</strong> a turbo machine, fluid energy is c<strong>on</strong>verted into<br />
mechanical energy by means of a blade. The blade transfers the energy <strong>on</strong>to the rotor through a dovetail<br />
c<strong>on</strong>necti<strong>on</strong>. Due to the wedge-formed shape of the dovetail and the interacting forces <strong>on</strong> the blade, a slip<br />
arises between the blade and the rotor [13-15].<br />
A full scale experiment of a dovetail c<strong>on</strong>necti<strong>on</strong> is shown in Figure 3. The specimens have the shape of a<br />
dovetail c<strong>on</strong>necti<strong>on</strong>. The <strong>on</strong>ly force that is applied during the experiment is F, working in vertical directi<strong>on</strong>.<br />
There are two c<strong>on</strong>tact areas between the blade and the rotor, notice that this test rig has replaceable parts<br />
in the upper block. The dovetail c<strong>on</strong>necti<strong>on</strong> is failed due to fretting fatigue, a crack initiated in the c<strong>on</strong>tact<br />
area, and propagated through the specimen (crack in Figure 3).<br />
Figure 3. Dovetail fretting fatigue experimental setup with failed specimen [14].<br />
44<br />
Copyright © <str<strong>on</strong>g>2011</str<strong>on</strong>g> by Laboratory Soete
Sustainable C<strong>on</strong>structi<strong>on</strong> and Design <str<strong>on</strong>g>2011</str<strong>on</strong>g><br />
3.2 Wire rope and wire rope fixture<br />
The sec<strong>on</strong>d full scale test rig discussed in this paper is developed to test an overhead c<strong>on</strong>ductor. Overhead<br />
c<strong>on</strong>ductors are just wire ropes that transport electricity. This test rig can be used to test other applicati<strong>on</strong>s<br />
of wire ropes like a hoisting mechanism, a suspended bridge, a ski lift, etc.<br />
The test rig exists of a 42 meter prestressed wire rope that is subjected to a dynamic loading by the shaker.<br />
The small wires in the wire rope will slip over each other leading to fretting fatigue failure in the wire rope.<br />
This problem can occur in the whole wire rope. However, most problems with fretting fatigue are seen in the<br />
suspensi<strong>on</strong> points of the wire rope. Clamping fixtures are placed around the wire rope and are securely<br />
tightened. The larger dimensi<strong>on</strong>s of the clamping fixture leads to a stiffer entity than the wire rope (Figure 5<br />
left). This results in a disc<strong>on</strong>tinuity of the bending stiffness of the wire rope in the vicinity of such a fixture,<br />
and will result in fretting fatigue.<br />
Figure 4. Schematic view of the fretting fatigue test rig for overhead c<strong>on</strong>ductors [16].<br />
A heavily worn wire rope is shows in Figure 5 right. The outer layer of wires are worn and broken due to<br />
fretting fatigue between the wire rope and the clamping fixture. The underlying layer of wires is visible and<br />
shows elliptical wear marks due to fretting between two wires (trellis c<strong>on</strong>tact). Some of these wires are<br />
broken in the worn c<strong>on</strong>tact due to fretting fatigue (not visible <strong>on</strong> Figure 5).<br />
Figure 5. Clamping fixture not mounted <strong>on</strong> the wire rope (left) and a heavily worn wire rope (right) [16].<br />
4 COUPON SCALE TEST RIGS<br />
In c<strong>on</strong>tradicti<strong>on</strong> to a full scale test rig, the specimens of a coup<strong>on</strong> scale test rig have no similarity with the<br />
real geometry of an applicati<strong>on</strong>. Coup<strong>on</strong> scale testing is a comm<strong>on</strong> practice for material characterizati<strong>on</strong><br />
and is used by academics to perform research.<br />
Simple geometry specimens are ideal for material characterizati<strong>on</strong> tests regarding to fretting fatigue. It is<br />
assumed that all the specimens are manufactured and assembled equally, so the interacting forces in the<br />
vicinity of the c<strong>on</strong>tact area are the same. A sec<strong>on</strong>d assumpti<strong>on</strong> is even more doubtful: when <strong>on</strong>e has a<br />
ranking for materials <strong>on</strong> coup<strong>on</strong> scale it is assumed tacitly that an identical ranking applies to the real<br />
problem [2].<br />
Academic researchers adopted the coup<strong>on</strong> scale technique for state of the art research. Coup<strong>on</strong> scale<br />
specimens have the advantage that all the dimensi<strong>on</strong>s can be chosen arbitrarily by the designer.<br />
Manageable specimens for laboratory testing have their benefits. However, the major advantage of a<br />
coup<strong>on</strong> specimen is the c<strong>on</strong>venience to perform a parametric study <strong>on</strong> the dimensi<strong>on</strong>s of the specimen.<br />
45<br />
Copyright © <str<strong>on</strong>g>2011</str<strong>on</strong>g> by Laboratory Soete
Sustainable C<strong>on</strong>structi<strong>on</strong> and Design <str<strong>on</strong>g>2011</str<strong>on</strong>g><br />
A well designed test rig has similar ease to perform parametric studies. Progress can be seen over time,<br />
the first types of coup<strong>on</strong> scale test rigs c<strong>on</strong>sist of <strong>on</strong>e servo-hydraulic actuator and some screws to apply<br />
the forces. While most modern test rigs have multiple actuators to c<strong>on</strong>trol the forces and slip independently<br />
in time.<br />
The last advantage of coup<strong>on</strong> scale test rigs that will be cited here is the visibility of the c<strong>on</strong>tact. In most full<br />
scale test rigs it is impossible to see the c<strong>on</strong>tact area, nor the crack. For research however it is important to<br />
know the slip between pad and specimen and is it interesting to see the surface where cracks will occur.<br />
Crack propagati<strong>on</strong>, and possible crack initiati<strong>on</strong>, can then be studied with new field measuring techniques<br />
such as a thermal camera [17-19], an optical camera [20-22], a magnetic camera [23]…<br />
4.1 One actuator test rig<br />
This secti<strong>on</strong> discusses test rigs that have <strong>on</strong>e c<strong>on</strong>trollable actuator. This can be a hydraulic actuator, a<br />
piezo-electric shaker, any crank mechanism or other c<strong>on</strong>trollable drive unit. The bulk fatigue load F fat is<br />
c<strong>on</strong>trolled by this actuator, all other applied external forces are set manually.<br />
The normal force is mostly applied by a floating circular spring system, called a proving ring ( Figure 6). The<br />
proving ring operates like a pre-stressed spring whereby the initial force is set by a setscrew and works<br />
based <strong>on</strong> the compliance of the spring. If the total length of the compressed parts doesn’t change, the<br />
normal force stays c<strong>on</strong>stant during the experiment. This is not the case in fretting (fatigue) experiments,<br />
where fretting causes wear.<br />
Figure 6. Fretting fatigue experiment whereby the normal load is applied with a proving ring [24]<br />
If voluminous oxidized wear particles stay in the c<strong>on</strong>tact area they will cause an el<strong>on</strong>gati<strong>on</strong> of the<br />
compressed parts, and the proving ring. This results in a higher normal force F N from the proving ring. On<br />
the other hand if particles escape from the c<strong>on</strong>tact area the pads will move towards the specimen due to<br />
wear. This is a shortening of the loading train that results in a decrease of normal force F N . These<br />
mechanisms are undesirable if the normal force has to be c<strong>on</strong>stant. For example, R.B. Waterhouse used a<br />
proving ring with an unidirecti<strong>on</strong>al stiffness of about 12MN/mm, this resulted in a reducti<strong>on</strong> of 15.5MPa<br />
when the relative distance of the two surfaces decreases 25µm [25].<br />
Besides the fatigue force and the normal force, <strong>on</strong>e should also apply a slip between the specimen and the<br />
pad. The relative displacement between the fatigue specimen and the pad is realized by the compliance of<br />
the specimens (fatigue specimen and pad) and the compliance of the test rig. The slip is always in phase<br />
with the fatigue loading and cannot be c<strong>on</strong>trolled independently. Two types of pad geometries will be<br />
discussed: floating fretting bridges (paragraph 3.1.1) and fixed fretting bridges (paragraph 3.1.2) as shown<br />
in Figure 7.<br />
46<br />
Copyright © <str<strong>on</strong>g>2011</str<strong>on</strong>g> by Laboratory Soete
Sustainable C<strong>on</strong>structi<strong>on</strong> and Design <str<strong>on</strong>g>2011</str<strong>on</strong>g><br />
Figure 7. Floating fretting bridge (a) and Fixed fretting bridge (b).<br />
4.1.1 Floating fretting bridges<br />
A floating fretting bridge is a pad that has two c<strong>on</strong>tact points with the specimen (Figure 7a). During an<br />
experiment two floating fretting bridges are mounted <strong>on</strong> <strong>on</strong>e fatigue specimen for symmetry. Floating<br />
fretting bridges in combinati<strong>on</strong> with a proving ring (Figure 6) are frequently used because of their easy<br />
installati<strong>on</strong> <strong>on</strong> an ordinary universal load frame.<br />
Applying a fatigue load <strong>on</strong> the specimen will el<strong>on</strong>gate the specimen. The initial c<strong>on</strong>tact points of <strong>on</strong>e floating<br />
fretting bridge move apart, and a slip will occur in both c<strong>on</strong>tact points. The slip is in phase with the applied<br />
fatigue force, and cannot be c<strong>on</strong>trolled. The slip can be influenced prior to an experiment by adapting the<br />
geometry of the floating fretting bridges or the specimen. However, not all combinati<strong>on</strong>s of slip and fatigue<br />
load are possible.<br />
Disadvantage of floating fretting bridges is the difficulty to compare results. A change in the geometry of the<br />
floating fretting bridges gives significant different results (see Figure 1). Other disadvantages of floating<br />
fretting bridges are the impossibility to measure the slip and the tangential force.<br />
4.1.2 Fixed fretting bridges<br />
A fixed fretting bridge is fixed <strong>on</strong> the test rig, and has <strong>on</strong>ly <strong>on</strong>e c<strong>on</strong>tact point with the fatigue specimen<br />
(Figure 7b). During an experiment two fixed fretting bridges are mounted <strong>on</strong> <strong>on</strong>e fatigue specimen<br />
(Figure 8). Loading the specimen causes a displacement of the c<strong>on</strong>tact area. A slip will occur between the<br />
pad and the specimen. This slip is in phase with the applied fatigue force.<br />
In c<strong>on</strong>tradicti<strong>on</strong> to floating fretting bridges, fixed fretting bridges have the ability to measure the slip and the<br />
tangential force. The tangential force can be measured by strain gauges <strong>on</strong> the fixed fretting bridge which<br />
act as a calibrated spring [26].<br />
47<br />
Copyright © <str<strong>on</strong>g>2011</str<strong>on</strong>g> by Laboratory Soete
Sustainable C<strong>on</strong>structi<strong>on</strong> and Design <str<strong>on</strong>g>2011</str<strong>on</strong>g><br />
Fixed fixture<br />
Moving fixture<br />
Proving Ring<br />
Fixed fretting bridge<br />
Figure 8. Fretting fatigue test rig with half fretting bridges and proving ring [25].<br />
4.2 One actuator test rig with adjustable compliance<br />
A sec<strong>on</strong>d type of coup<strong>on</strong> scale test rigs is based <strong>on</strong> <strong>on</strong>e actuator, and has the ability to adjust the<br />
compliance of the test rig. The working principle is similar to fixed fretting bridges, Figure 7b. The <strong>on</strong>ly<br />
difference is that these test rig are designed to have an (c<strong>on</strong>tinuous) adjustable compliance. This allows<br />
more combinati<strong>on</strong>s of slip and fatigue load. The slip is in phase with the fatigue load, but can be influenced<br />
prior to an experiment by adjusting the compliance of the test rig.<br />
The mechanisms to adjust the compliance of the test rig are based <strong>on</strong> l<strong>on</strong>gitudinal springs [27] or cantilever<br />
beams [28-30]. A schematic drawing of the latter is shown in Figure 9. Two fretting pads are mounted <strong>on</strong> a<br />
stiff plate by linear bearings and load cells (LC4-LC7). The stiff plate is c<strong>on</strong>nected <strong>on</strong>to the rigid base by<br />
two cantilever beams. The support of the cantilever beams can be adjusted, so the stiffness of the test rig<br />
can be adjusted c<strong>on</strong>tinuously prior to an experiment.<br />
Figure 9. Fretting fatigue test rig with adjustable compliance, adjustable by support [30].<br />
48<br />
Copyright © <str<strong>on</strong>g>2011</str<strong>on</strong>g> by Laboratory Soete
Sustainable C<strong>on</strong>structi<strong>on</strong> and Design <str<strong>on</strong>g>2011</str<strong>on</strong>g><br />
4.3 Two actuators test rig<br />
The last type of fretting fatigue test rig that will be discussed in this paper is based <strong>on</strong> two actuators that<br />
independently c<strong>on</strong>trol the fretting acti<strong>on</strong> and the fatigue acti<strong>on</strong> during experiments. In previously discussed<br />
test rigs these acti<strong>on</strong>s where always coupled by geometry and (adjustable) compliance of the test rig.<br />
This type of test rig is first used by researchers at the University of Oxford [31] to investigate the influence<br />
of the fretting acti<strong>on</strong> and the fatigue acti<strong>on</strong> separately. Therefore the authors used a test rig whereby the<br />
fretting and fatigue acti<strong>on</strong> can be c<strong>on</strong>trolled independently. A schematic overview is shown in Figure 10 for<br />
<strong>on</strong>e c<strong>on</strong>tact point.<br />
Figure 10. Schematic view of a fretting fatigue test rig with two actuators<br />
A schematic view of a real test rig is shown in Figure 11. Two pads are used for symmetry reas<strong>on</strong>s, and are<br />
installed <strong>on</strong> a fretting fixture (5). This fretting fixture is c<strong>on</strong>nected to a hydraulic actuator (1) by means of a<br />
structural frame (3). The fretting fixture is moved to c<strong>on</strong>trol the slip between the pad and the specimen.<br />
However, the displacement of the fixture will depend <strong>on</strong> the displacement of the hydraulic actuator and the<br />
compliance of the structural frame. This compliance will ensure that the slip cannot be c<strong>on</strong>trolled<br />
accurately. The <strong>on</strong>ly literature that menti<strong>on</strong>s the accuracy of the slip that they can apply is Magadu et. al.<br />
[32], who are able to c<strong>on</strong>trol the slip in the range of 15µm.<br />
Figure 11. Schematic view of the test rig at Wright-Patters<strong>on</strong> AFB [33]<br />
Table 2 gives an overview of five existing two actuators test rigs that are known to the authors, and lists the<br />
driving equipment for the fatigue force, normal force and slip. All the test rigs use a hydraulic actuator to<br />
apply the fatigue force. The slip in the test rigs is applied by a sec<strong>on</strong>d hydraulic actuator. The difference<br />
between the listed test rigs is how the normal load is applied.<br />
49<br />
Copyright © <str<strong>on</strong>g>2011</str<strong>on</strong>g> by Laboratory Soete
Sustainable C<strong>on</strong>structi<strong>on</strong> and Design <str<strong>on</strong>g>2011</str<strong>on</strong>g><br />
Table 2. Overview of some fretting fatigue test rigs based <strong>on</strong> two actuators<br />
Research<br />
institute<br />
Wright-<br />
Patters<strong>on</strong> AFB<br />
University of<br />
Brasília<br />
University of<br />
Oxford<br />
United<br />
Technologies<br />
Research Center<br />
University of<br />
Ly<strong>on</strong><br />
Fatigue force Normal force Slip<br />
Hydraulic actuator Compliant springs Hydraulic actuator and<br />
compliance test rig<br />
Hydraulic actuator Hydraulic accumulator Hydraulic actuator and<br />
compliance test rig<br />
Hydraulic actuator Hydraulic actuator Hydraulic actuator and<br />
compliance test rig<br />
Hydraulic actuator Hydraulic actuator Hydraulic actuator and<br />
compliance test rig<br />
Hydraulic actuator - Hydraulic actuator and<br />
compliance test rig<br />
5 CONCLUSION<br />
A classificati<strong>on</strong> of fretting fatigue test rigs based <strong>on</strong> the properties of the test rigs is given in Figure 12. A<br />
first difference of test rigs is based <strong>on</strong> the specimens scale, full scale or coup<strong>on</strong> scale. <str<strong>on</strong>g>Full</str<strong>on</strong>g> scale test rigs<br />
are directly related to a real applicati<strong>on</strong>, eight full scale rigs are listed in Table 1.<br />
Further classificati<strong>on</strong> has been d<strong>on</strong>e for the coup<strong>on</strong> scale test rigs. Based <strong>on</strong> their capability to apply a slip<br />
s, tree categories are made. The first type, <strong>on</strong>e actuator test rig, is not designed to c<strong>on</strong>trol or influence the<br />
slip. The sec<strong>on</strong>d type, <strong>on</strong>e actuator test rig with adjustable compliance, can influence the slip in advance,<br />
but is not able to c<strong>on</strong>trol the slip during the experiments. In both types of test rig, the slip is in phase with<br />
the fatigue force. The third and last type of coup<strong>on</strong> scale test rigs, two actuator test rig, can c<strong>on</strong>trol the slip<br />
independently of the fatigue load. However, due to c<strong>on</strong>structi<strong>on</strong> of the test rig, the slip cannot be applied<br />
accurately in the range of some micrometer, which is necessary to test fretting.<br />
Fretting fatigue test rigs<br />
Coup<strong>on</strong> scale<br />
<str<strong>on</strong>g>Full</str<strong>on</strong>g> scale<br />
One actuator test rig<br />
Floating fretting bridge<br />
Fixed fretting bridge<br />
One actuator test rig<br />
with adjustable compliance<br />
Two actuators test rig<br />
Figure 12. Classificati<strong>on</strong> of fretting fatigue test rigs.<br />
50<br />
Copyright © <str<strong>on</strong>g>2011</str<strong>on</strong>g> by Laboratory Soete
Sustainable C<strong>on</strong>structi<strong>on</strong> and Design <str<strong>on</strong>g>2011</str<strong>on</strong>g><br />
6 NOMENCLATURE<br />
d relative movement of pad µm<br />
s slip µm<br />
h height fretting bridge mm<br />
F N<br />
F<br />
fat<br />
normal force<br />
fatigue force<br />
F force N<br />
7 ACKNOWLEDGEMENTS<br />
N<br />
N<br />
The authors would like to acknowledge the support of the IWT (Agency for Innovati<strong>on</strong> by Science and<br />
Technology – n° SB-091510)<br />
8 REFERENCES<br />
[1] M. H. Attia and R. B. Waterhouse, Standardizati<strong>on</strong> of fretting fatigue test methods and equipment,<br />
1992.<br />
[2] D. A. Hills and D. Nowell, Mechanics of fretting fatigue vol. 30, 1994.<br />
[3] S. Wagle and H. Kato, "Ultras<strong>on</strong>ic wave intensity reflected from fretting fatigue cracks at bolt joints of<br />
aluminum alloy plates," Ndt & E <str<strong>on</strong>g>Internati<strong>on</strong>al</str<strong>on</strong>g>, vol. 42, pp. 690-695, Dec 2009.<br />
[4] D. Hought<strong>on</strong>, P. M. Wavish, E. J. Williams, and S. B. Leen, "Multiaxial fretting fatigue testing and<br />
predicti<strong>on</strong> for splined couplings," <str<strong>on</strong>g>Internati<strong>on</strong>al</str<strong>on</strong>g> Journal of Fatigue, vol. 31, pp. 1805-1815, Nov-Dec<br />
2009.<br />
[5] T. R. Hyde, S. B. Leen, and I. R. McColl, "A simplified fretting test methodology for complex shaft<br />
couplings," Fatigue & Fracture of Engineering Materials & Structures, vol. 28, pp. 1047-1067, Nov<br />
2005.<br />
[6] S. B. Leen, T. H. Hyde, C. H. H. Ratsimba, E. J. Williams, and I. R. McColl, "An investigati<strong>on</strong> of the<br />
fatigue and fretting performance of a representative aero-engine spline coupling," Journal of Strain<br />
Analysis for Engineering Design, vol. 37, pp. 565-583, Nov 2002.<br />
[7] L. Bertini, M. Beghini, C. Santus, and A. Baryshnikov, "Res<strong>on</strong>ant test rigs for fatigue full scale testing<br />
of oil drill string c<strong>on</strong>necti<strong>on</strong>s," <str<strong>on</strong>g>Internati<strong>on</strong>al</str<strong>on</strong>g> Journal of Fatigue, vol. 30, pp. 978-988, 2008.<br />
[8] B. Alfredss<strong>on</strong>, "Fretting fatigue of a shrink-fit pin subjected to rotating bending: Experiments and<br />
simulati<strong>on</strong>s," <str<strong>on</strong>g>Internati<strong>on</strong>al</str<strong>on</strong>g> Journal of Fatigue, vol. 31, pp. 1559-1570, 2009.<br />
[9] R. Gutkin and B. Alfredss<strong>on</strong>, "Growth of fretting fatigue cracks in a shrink-fitted joint subjected to<br />
rotating bending," Engineering Failure Analysis, vol. 15, pp. 582-596, 2008.<br />
[10] T. Juuma, "Torsi<strong>on</strong>al fretting fatigue strength of a shrink-fitted shaft with a grooved hub," Tribology<br />
<str<strong>on</strong>g>Internati<strong>on</strong>al</str<strong>on</strong>g>, vol. 33, pp. 537-543, 2000.<br />
[11] D. H. Lee, S. J. Kw<strong>on</strong>, Y. S. Ham, and W. H. You, "Characterizati<strong>on</strong> of fretting damage in a pressfitted<br />
shaft below the fretting fatigue limit," in Fatigue 2010. vol. 2, P. Lukas, Ed. Amsterdam: Elsevier<br />
Science Bv, pp. 1945-1949.<br />
[12] M. L. Aggarwal, R. A. Khan, and V. P. Agrawal, "Effect of surface roughness <strong>on</strong> the fretting fatigue<br />
behaviour of EN45A spring steel," in Proceedings of the Instituti<strong>on</strong> of Mechanical Engineers -- Part B<br />
-- Engineering Manufacture. vol. 220: Professi<strong>on</strong>al Engineering Publishing, 2006, pp. 1325-1331.<br />
[13] P. J. Golden and T. Nicholas, "The effect of angle <strong>on</strong> dovetail fretting experiments in Ti-6Al-4V,"<br />
Fatigue & Fracture of Engineering Materials & Structures, vol. 28, pp. 1169-1175, Dec 2005.<br />
[14] P. J. Golden and J. R. Calcaterra, "A fracture mechanics life predicti<strong>on</strong> methodology applied to<br />
dovetail fretting," Tribology <str<strong>on</strong>g>Internati<strong>on</strong>al</str<strong>on</strong>g>, vol. 39, pp. 1172-1180, Oct 2006.<br />
[15] A. Kermanpur, H. S. Amin, S. Ziaei-Rad, N. Nourbakhshnia, and M. Mosaddeghfar, "Failure analysis<br />
of Ti6Al4V gas turbine compressor blades," Engineering Failure Analysis, vol. 15, pp. 1052-1064,<br />
Dec 2008.<br />
[16] C. R. F. Azevedo, A. M. D. Henriques, A. R. Pulino Filho, J. L. A. Ferreira, and J. A. Araújo, "Fretting<br />
fatigue in overhead c<strong>on</strong>ductors: Rig design and failure analysis of a Grosbeak aluminium cable steel<br />
reinforced c<strong>on</strong>ductor," Engineering Failure Analysis, vol. 16, pp. 136-151, 2009.<br />
[17] O. Plekhov, T. Pain-Luc, N. Saintier, S. Uvarov, and O. Naimark, "Fatigue crack initiati<strong>on</strong> and growth<br />
in a 35CrMo4 steel investigated by infrared thermography," Fatigue & Fracture of Engineering<br />
Materials & Structures, vol. 28, pp. 169-178, Jan 2005.<br />
[18] D. Wagner, N. Ranc, C. Bathias, and P. C. Paris, "Fatigue crack initiati<strong>on</strong> detecti<strong>on</strong> by an infrared<br />
thermography method," Fatigue & Fracture of Engineering Materials & Structures, vol. 33, pp. 12-21,<br />
Jan 2009.<br />
51<br />
Copyright © <str<strong>on</strong>g>2011</str<strong>on</strong>g> by Laboratory Soete
Sustainable C<strong>on</strong>structi<strong>on</strong> and Design <str<strong>on</strong>g>2011</str<strong>on</strong>g><br />
[19] W. Thoms<strong>on</strong>, "On the dynamical theory of heat - with numerical results deduced from Mr.Joule’s<br />
equivalent of a thermal unit and M. Regaut’s observati<strong>on</strong>s <strong>on</strong> steam," Royal Society of Edinburgh,<br />
Transacti<strong>on</strong>s of the Royal Society, pp. 261–288, 1853.<br />
[20] S. Henkel, D. Holländer, M. Wünsche, H. Theilig, P. Hübner, H. Biermann, and S. Mehringer, "Crack<br />
observati<strong>on</strong> methods, their applicati<strong>on</strong> and simulati<strong>on</strong> of curved fatigue crack growth," Engineering<br />
Fracture Mechanics, vol. 77, pp. 2077-2090.<br />
[21] B. Bruzek and E. Leidich, "Evaluati<strong>on</strong> of crack growth at the weld interface between br<strong>on</strong>ze and<br />
steel," <str<strong>on</strong>g>Internati<strong>on</strong>al</str<strong>on</strong>g> Journal of Fatigue, vol. 29, pp. 1827-1831, 2007/11//.<br />
[22] P. Cavaliere, A. D. Santis, F. Panella, and A. Squillace, "Thermoelasticity and CCD analysis of crack<br />
propagati<strong>on</strong> in AA6082 fricti<strong>on</strong> stir welded joints," <str<strong>on</strong>g>Internati<strong>on</strong>al</str<strong>on</strong>g> Journal of Fatigue, vol. 31, pp. 385-<br />
392, 2009.<br />
[23] J. Hwang, J. Lee, and S. Kw<strong>on</strong>, "The applicati<strong>on</strong> of a differential-type Hall sensors array to the<br />
n<strong>on</strong>destructive testing of express train wheels," NDT & E <str<strong>on</strong>g>Internati<strong>on</strong>al</str<strong>on</strong>g>, vol. 42, pp. 34-41, 2009.<br />
[24] K. K. Liu and M. R. Hill, "The effects of laser peening and shot peening <strong>on</strong> fretting fatigue in Ti-6Al-4V<br />
coup<strong>on</strong>s," Tribology <str<strong>on</strong>g>Internati<strong>on</strong>al</str<strong>on</strong>g>, vol. 42, pp. 1250-1262, 2009.<br />
[25] R.B.Waterhouse, Fretting Corrosi<strong>on</strong>. Oxford: Pergam<strong>on</strong> Press 1972.<br />
[26] K. Endo and H. Goto, "Initiati<strong>on</strong> and propagati<strong>on</strong> of fretting fatigue cracks," Wear, vol. 38, pp. 311-<br />
324, 1976.<br />
[27] R. Cortez, S. Mall, and J. R. Calcaterra, "Investigati<strong>on</strong> of variable amplitude loading <strong>on</strong> fretting<br />
fatigue behavior of Ti-6Al-V," <str<strong>on</strong>g>Internati<strong>on</strong>al</str<strong>on</strong>g> Journal of Fatigue, vol. 21, pp. 709-717, Aug 1999.<br />
[28] S. Fouvry, K. Kubiak, A. M. Marechal, and J. M. Vernet, "Behaviour of shot peening combined with<br />
WC-Co HVOF coating under complex fretting wear and fretting fatigue loading c<strong>on</strong>diti<strong>on</strong>s," Surface &<br />
Coatings Technology, vol. 201, pp. 4323-4328, 20 December 2006.<br />
[29] M. C. Gean and T. N. Farris, "Elevated temperature fretting fatigue of Ti-17 with surface treatments,"<br />
Tribology <str<strong>on</strong>g>Internati<strong>on</strong>al</str<strong>on</strong>g>, vol. 42, pp. 1340-1345, Sep 2009.<br />
[30] Wittkowsky, Birch, Dominguez, and Suresh, "An apparatus for quantitative fretting testing," Fatigue &<br />
Fracture of Engineering Materials & Structures, vol. 22, pp. 307-320, 1999.<br />
[31] L. J. Fellows, D. Nowell, and D. A. Hills, "On the initiati<strong>on</strong> of fretting fatigue cracks," Wear, vol. 205,<br />
pp. 120-129, 1997.<br />
[32] A. Mugadu, D. A. Hills, and D. Nowell, "Modificati<strong>on</strong>s to a fretting-fatigue testing apparatus based<br />
up<strong>on</strong> an analysis of c<strong>on</strong>tact stresses at complete and nearly complete c<strong>on</strong>tacts," Wear, vol. 252, pp.<br />
475-483, 2002.<br />
[33] R. Magaziner, O. Jin, and S. Mall, "Slip regime explanati<strong>on</strong> of observed size effects in fretting," Wear,<br />
vol. 257, pp. 190-197, 2004.<br />
52<br />
Copyright © <str<strong>on</strong>g>2011</str<strong>on</strong>g> by Laboratory Soete
Sustainable C<strong>on</strong>structi<strong>on</strong> and Design <str<strong>on</strong>g>2011</str<strong>on</strong>g><br />
DEGRADATION OF CARBON FIBER REINFORCED EPOXY<br />
COMPOSITES UNDER SLIDING IN AMBIENT AIR<br />
1<br />
H. Dhieb 1 , J.G. Buijnsters 1 , J.P. Celis 1<br />
Katholieke Universiteit Leuven, Dept. MTM, Kasteelpark Arenberg 44, B3001 Leuven, Belgium<br />
Abstract For many technical applicati<strong>on</strong>s fricti<strong>on</strong> and wear are critical issues. Polymer composites<br />
reinforced by different comp<strong>on</strong>ents are currently widely used in various automotive and aerospace<br />
applicati<strong>on</strong>s as well as structural engineering. However, the degradati<strong>on</strong> of such composite materials in<br />
fretting c<strong>on</strong>tacts leads to change and loss of the material in use and the c<strong>on</strong>tact behaviour of these<br />
materials depend <strong>on</strong> the counter body, reinforcements, and operati<strong>on</strong> time. In this paper, the wear and<br />
coefficient of fricti<strong>on</strong> of bulk epoxy and carb<strong>on</strong> fiber reinforced epoxy composite have been investigated<br />
under reciprocating sliding against alumina and stainless steel balls in ambient air. The effect of sliding<br />
directi<strong>on</strong> with respect to the l<strong>on</strong>g and unidirecti<strong>on</strong>al carb<strong>on</strong> fibers has been studied. The coefficient of<br />
fricti<strong>on</strong> measured for the bulk epoxy against stainless steel and alumina is around 0.65, whereas the values<br />
measured for the epoxy reinforced with carb<strong>on</strong> fibers are significantly lower. It was found that sliding with<br />
stainless steel in a directi<strong>on</strong> parallel to the fiber orientati<strong>on</strong> results in a lower coefficient of fricti<strong>on</strong> than<br />
under sliding in anti parallel directi<strong>on</strong>. The reduced wear volume of the composite is largely influenced by<br />
the carb<strong>on</strong> fiber reinforcement due the auto-protecting film formed <strong>on</strong> the c<strong>on</strong>tact area.<br />
Keywords Carb<strong>on</strong> fiber reinforced epoxy composite, reciprocating sliding, fricti<strong>on</strong> and wear, material<br />
degradati<strong>on</strong><br />
1 INTRODUCTION<br />
Carb<strong>on</strong> fibre reinforced thermoset polymers are composite materials that are usually not applied for<br />
tribological purposes, although they have inherent great potential. When using such composites (e.g., in<br />
sports equipment, automotive, marine, and aerospace applicati<strong>on</strong>s) <strong>on</strong>e should bear in mind the sliding<br />
c<strong>on</strong>tact z<strong>on</strong>e. Tribological properties of such materials in reciprocating c<strong>on</strong>tacts depend definitely <strong>on</strong> the<br />
properties of both matrix and reinforcement elements, and their interface. Research is thus needed to<br />
understand the degradati<strong>on</strong> of the surface and subsurface of such materials. In that respect, tribochemical<br />
reacti<strong>on</strong>s and cracking occurring at the surface may be of large importance besides other mechanisms.<br />
Many researches have been d<strong>on</strong>e under sliding movement using the pin-<strong>on</strong>-disc system [1-5] as well as<br />
ring-<strong>on</strong>-block [6-8], ring-<strong>on</strong>-ring [9], disk-<strong>on</strong>-disk [10], wheel abrasi<strong>on</strong> [11], face-c<strong>on</strong>tact-sliding [12], twin<br />
disc rings [13] and ball-<strong>on</strong>-prism [14] c<strong>on</strong>figurati<strong>on</strong>s to investigate the fricti<strong>on</strong> and wear behaviour and<br />
mechanisms like surface fatigue and abrasi<strong>on</strong> of such kind of materials. As we menti<strong>on</strong>ed before, the<br />
applicati<strong>on</strong> fields of composite materials imply that c<strong>on</strong>tact vibrati<strong>on</strong>s can be the origin of material<br />
degradati<strong>on</strong>. Up to now, research studies <strong>on</strong> the reciprocating movement of composites against different<br />
counter bodies have not been reported at all. In the multiple studies involving sliding movements, various<br />
reinforcements [15] and matrixes were investigated, such as short carb<strong>on</strong> fibres [4], glass fibres [2],<br />
graphite fillers [5], or a mix of different reinforcements [16]. The PEEK thermoplastic polymer is extensively<br />
used as a matrix, whereas the epoxy thermoset polymer is less well investigated. It is generally recognized<br />
that the most comm<strong>on</strong> types of wear of polymers are abrasi<strong>on</strong>, adhesi<strong>on</strong> and fatigue [17]. The carb<strong>on</strong> fibres<br />
increase the compressive strength and the creep resistance of the polymer matrix. It has been shown that<br />
the effect of fiber orientati<strong>on</strong> is str<strong>on</strong>gly dependent <strong>on</strong> the nominal c<strong>on</strong>tact pressure. It is evident that the<br />
abrasive wear behaviour of composites and specifically carb<strong>on</strong> fibre reinforced epoxy is complex and it is<br />
widely recognised that it needs more systematic investigati<strong>on</strong>.<br />
In this study, the fricti<strong>on</strong> and wear under reciprocating fretting c<strong>on</strong>tacts [18] were investigated. The wear<br />
tests were performed <strong>on</strong> a fretting/reciprocating sliding machine and the wear tracks <strong>on</strong> the samples and<br />
ball counter bodies were examined in detail. SEM and profilometry were employed to characterise the<br />
materials degradati<strong>on</strong>. Our results provide valuable informati<strong>on</strong> of the evoluti<strong>on</strong> of the wear and the effect of<br />
fretting directi<strong>on</strong>, and they help to understand the tribological behaviour of carb<strong>on</strong> fibre reinforced epoxy in<br />
c<strong>on</strong>tact with stainless steel and alumina counter bodies.<br />
53<br />
Copyright © <str<strong>on</strong>g>2011</str<strong>on</strong>g> by Laboratory Soete
Sustainable C<strong>on</strong>structi<strong>on</strong> and Design <str<strong>on</strong>g>2011</str<strong>on</strong>g><br />
2 EXPERIMENTAL<br />
The materials used in this study are bulk epoxy and carb<strong>on</strong> fiber reinforced epoxy. For the producti<strong>on</strong> of the<br />
bulk epoxy we have used standard DGEBA (Epikote 828) and Aradur 3486 (aliphatic polyamine) as a<br />
hardener (ratio epikote/hardener 100/30). For the carb<strong>on</strong> fiber reinforced samples, the resin was mixed,<br />
poured in a mould and cured at room temperature followed by an oven treatment. The cycle to cure those<br />
samples was 24 hrs at room temperature plus 8 hrs at 80°C. The reinforced epoxy sample c<strong>on</strong>tains 8<br />
layers of unidirecti<strong>on</strong>al carb<strong>on</strong> fibre mixed with the epoxy to obtain 1 mm of thickness. The stack of preimpregnated<br />
fibers is placed <strong>on</strong> a PTFE sheet <strong>on</strong> an aluminium base plate. It is covered with another PTFE<br />
layer and a 10-mm thick aluminium plate is put <strong>on</strong> top. The assembly is covered with bleeder fabric and a<br />
vacuum bag. Vacuum is applied through a tube that is incorporated in the sealing of the bag. A vacuum of<br />
0.095 MPa is then applied for 15 min at room temperature to debulk. Following, the assembly is placed in<br />
an oven (while maintaining the vacuum) and heated to 90°C for 60 min and finally heated to 130°C for 90<br />
min. After that, the assembly is taken out of the oven and the vacuum is released (Figure 1). The carb<strong>on</strong><br />
fibre mixed with the epoxy is STS - 24K having the following specific properties: 24,000 filaments, 4,000<br />
MPa tensile strength, 240 GPa tensile modulus, 1.7% el<strong>on</strong>gati<strong>on</strong>, 7-µm diameter, and 1.75 g /cm 3 density.<br />
All the specimens were cut into the same dimensi<strong>on</strong> (20 x 20 mm 2 ) for testing.<br />
Figure 1. Carb<strong>on</strong> fibre reinforced epoxy’s producti<strong>on</strong> set-up<br />
Reciprocating tests were performed to investigate the coefficient of fricti<strong>on</strong>, the wear track and the wear<br />
volume lost. Stainless steel (AISI 316) and alumina balls, both with a diameter of 10 mm, were used as the<br />
counter body. All materials were degreased and cleaned prior to the fretting tests using acet<strong>on</strong>e and<br />
ethanol. The reciprocating tests were carried out under ambient air c<strong>on</strong>diti<strong>on</strong>s (temperature: 22 ºC, relative<br />
humidity: 50%) and the total number of cycles varied from 10,000 to 200,000. A normal load of 9 N, a<br />
frequency of 3 Hz, and a displacement distance of 600 µm were used for all tests. More details <strong>on</strong> the<br />
laboratory simulati<strong>on</strong> of fretting and the applied test set-up can be found elsewhere [18]. Reciprocating<br />
sliding was analysed under dry c<strong>on</strong>diti<strong>on</strong> through examining the wear tracks of the samples with scanning<br />
electr<strong>on</strong> microscopy and a white light interferometer.<br />
3 RESULTS AND DISCUSSION<br />
SEM images of the worn bulk epoxy surfaces after 40,000 and 100,000 sliding cycles of sliding against the<br />
stainless steel ball are displayed in Figure 2. The relative directi<strong>on</strong>s of the sliding are indicated by the<br />
arrows in Figures 2a,b. The most damaged regi<strong>on</strong>s are situated near both edges of the wear tracks and<br />
they present many micro-cracks that appear perpendicular to the displacement (Figure 2d). These cracks<br />
are the result of the shear force during sliding. This fatigue wear causes micro-surface damage, which<br />
normally occurs at high temperatures. Another important aspect of the degradati<strong>on</strong> process of the bulk<br />
epoxy material is the formati<strong>on</strong> of debris in and around the wear tracks. Most of the debris is located<br />
outside the damaged area and, in particular, relatively large debris particles are observed at the very ends<br />
of the wear tracks. A specific form of debris or rollers is represented in Figure 2c. This form with different<br />
sizes is due to the rolling effect of the sample debris during sliding and probably c<strong>on</strong>sists of shear-deformed<br />
epoxy. It could reduce the shear stress, the coefficient of fricti<strong>on</strong>, and the c<strong>on</strong>tact temperature, which leads<br />
to a reducti<strong>on</strong> of the damage. The formati<strong>on</strong> of these rollers is c<strong>on</strong>sidered an important process that plays a<br />
key role in enhancing the wear resistance. In general, the most recognized comm<strong>on</strong> types of wear of<br />
polymers are abrasi<strong>on</strong>, adhesi<strong>on</strong>, and fatigue [1].<br />
SEM images of the wear tracks formed <strong>on</strong> the bulk epoxy after 40,000 and 100,000 sliding cycles against<br />
alumina balls are displayed in Figure 3. It is clear that the wear tracks differ from those produced with the<br />
stainless steel counter body (Figure 2). The material damage for the epoxy/alumina c<strong>on</strong>tact is significantly<br />
higher as can be c<strong>on</strong>cluded from the higher density of cracks and wear debris. In particular, the high<br />
number of rollers of accumulated epoxy in- and outside the wear track formed after 100,000 cycles (Figure<br />
3b) is striking.<br />
54<br />
Copyright © <str<strong>on</strong>g>2011</str<strong>on</strong>g> by Laboratory Soete
Sustainable C<strong>on</strong>structi<strong>on</strong> and Design <str<strong>on</strong>g>2011</str<strong>on</strong>g><br />
Figure 2. SEM images of the wear tracks of bulk epoxy sliding against stainless steel after (a) 40,000 cycles<br />
and (b) 100,000 cycles. (c) Zoom of debris outside the wear track (area A in Fig. 2a) and (d) zoom of cracks<br />
within the wear track (area B in Fig. 2b)<br />
Figure 3. SEM images of the wear tracks of bulk epoxy against alumina after (a) 40,000 cycles and (b)<br />
100,000 cycles<br />
Figure 4 shows the wear tracks formed <strong>on</strong> the surfaces of the carb<strong>on</strong> fibre reinforced epoxy after 40,000<br />
cycles against both the stainless steel and alumina counter faces. Tests have been worked out with a<br />
sliding directi<strong>on</strong> parallel and anti-parallel to the orientati<strong>on</strong> of the carb<strong>on</strong> fibre reinforcements (the latter<br />
orientati<strong>on</strong> being indicated by the bundle of 4 parallel lines in Figure 4). Sliding against stainless steel<br />
(Figures 4a,b) results in a larger amount of wear debris (indicated by the black arrows) than for sliding<br />
against alumina (Figures 4c,d), irrespective of the sliding directi<strong>on</strong>. Note that for the carb<strong>on</strong> fibre reinforced<br />
epoxy, the wear debris is mainly located at the circumference of the wear tracks, parallel to the directi<strong>on</strong> of<br />
displacement. On the c<strong>on</strong>trary, the wear debris is mostly located at the ends of the wear tracks for the bulk<br />
55<br />
Copyright © <str<strong>on</strong>g>2011</str<strong>on</strong>g> by Laboratory Soete
Sustainable C<strong>on</strong>structi<strong>on</strong> and Design <str<strong>on</strong>g>2011</str<strong>on</strong>g><br />
epoxy (Figures 2 and 3). The composite displays a higher wear resistance against stainless steel when the<br />
fibres are oriented parallel to the sliding directi<strong>on</strong>. For all cases, the matrix has been affected within the<br />
wear track, since individual fibers are exposed and, therefore, the direct c<strong>on</strong>tact area is decreased. This<br />
could result in a higher c<strong>on</strong>tact pressure and increased surface stress, which might affect the<br />
microstructure of the composite surface at the sliding c<strong>on</strong>tact as well.<br />
Figure 4. SEM images of the wear tracks of the carb<strong>on</strong> fibre reinforced epoxy after 40,000 cycles of<br />
reciprocated sliding against stainless steel with (a) anti-parallel and (b) parallel orientati<strong>on</strong>, and alumina<br />
with (c) anti-parallel and (d) parallel orientati<strong>on</strong><br />
The coefficient of fricti<strong>on</strong> for the different sliding c<strong>on</strong>tacts is presented in Figure 5. The coefficient of fricti<strong>on</strong><br />
observed <strong>on</strong> the bulk epoxy is highest (0.65 ± 0.03) and is very similar and relatively c<strong>on</strong>stant throughout<br />
the whole reciprocating test of 10,000 cycles against either alumina or stainless steel. For the composite,<br />
the coefficient of fricti<strong>on</strong> str<strong>on</strong>gly depends <strong>on</strong> the counter face material. It is high during the early stages of<br />
reciprocating sliding and reaches a value around 0.53 after about 500 to 1,000 cycles. On reciprocating<br />
sliding against alumina, the coefficient of fricti<strong>on</strong> is relatively high and it does not depend <strong>on</strong> the relative<br />
sliding directi<strong>on</strong>. On the c<strong>on</strong>trary, the relative sliding directi<strong>on</strong> significantly affects the coefficient of fricti<strong>on</strong><br />
recorded for sliding against the stainless steel counter face. It decreases to values as low as 0.25 after<br />
10,000 sliding cycles with the sliding directi<strong>on</strong> parallel to the orientati<strong>on</strong> of the fibre reinforcements. In the<br />
case that the sliding is d<strong>on</strong>e anti-parallel to the fibre orientati<strong>on</strong>, the coefficient of fricti<strong>on</strong> is somewhat<br />
higher. The coefficient of fricti<strong>on</strong> reaches lower steady-state values of 0.27 ± 0.05 and 0.11 ± 0.01 <strong>on</strong><br />
sliding against stainless steel in the anti-parallel and parallel directi<strong>on</strong>s, respectively, after about 60,000<br />
cycles (not shown). It is evident that the reciprocating sliding behaviour depends <strong>on</strong> the mechanical<br />
properties of, and possibly the tribochemical interacti<strong>on</strong> with, the counter face material. Material originating<br />
from both the epoxy matrix and the fibre reinforcements might be transformed into a graphitic, low-fricti<strong>on</strong><br />
tribolayer which will change the sliding c<strong>on</strong>tact behaviour. These kinds of lubricating surface layers are<br />
comm<strong>on</strong>ly observed for testing other soft and hard carb<strong>on</strong>-based materials, such as hydrogenated<br />
amorphous carb<strong>on</strong> [19]. In future work, micro-Raman spectroscopy and atomic force microscopy analysis<br />
will be employed to investigate the microstructural and topographical changes of the composite material at<br />
the sliding c<strong>on</strong>tacts as a functi<strong>on</strong> of test parameters and counter face material.<br />
56<br />
Copyright © <str<strong>on</strong>g>2011</str<strong>on</strong>g> by Laboratory Soete
Sustainable C<strong>on</strong>structi<strong>on</strong> and Design <str<strong>on</strong>g>2011</str<strong>on</strong>g><br />
Figure 5. Representative evoluti<strong>on</strong> of the coefficients of fricti<strong>on</strong> recorded <strong>on</strong> bulk epoxy and carb<strong>on</strong> fibre<br />
reinforced epoxy sliding in parallel and anti parallel orientati<strong>on</strong> against stainless steel and alumina counter<br />
bodies (al: alumina, ss: stainless steel, AP: anti parallel, P: parallel)<br />
4 CONCLUSIONS<br />
The results of this study <strong>on</strong> bulk epoxy and carb<strong>on</strong> fiber reinforced epoxy composite against alumina and<br />
stainless steel balls in a reciprocating mode revealed some interesting phenomena related to fricti<strong>on</strong> and<br />
wear.<br />
1. The carb<strong>on</strong> fiber reinforcements improve the tribological properties of the thermoset epoxy by<br />
reducing the coefficient of fricti<strong>on</strong>, the wear volume lost, and the wear track damage and debris<br />
formati<strong>on</strong>.<br />
2. The wear track of the carb<strong>on</strong> fiber reinforcement epoxy is smoother than the wear track of the bulk<br />
epoxy due to the formati<strong>on</strong> of an auto-protecting surface layer which changes the surface c<strong>on</strong>tact<br />
behaviour.<br />
3. The choice of counter face material has no significant effect <strong>on</strong> the coefficient of fricti<strong>on</strong> (i.e., 0.65 ±<br />
0.03) for bulk epoxy material.<br />
4. The choice of counter face material has an important effect <strong>on</strong> the coefficient of fricti<strong>on</strong> for the<br />
carb<strong>on</strong> fiber reinforced epoxy composite. It is always lower <strong>on</strong> sliding against stainless steel.<br />
5. When alumina is used as the counter face, the sliding directi<strong>on</strong> with respect to the orientati<strong>on</strong> of the<br />
carb<strong>on</strong> fibers has no effect <strong>on</strong> the coefficient of fricti<strong>on</strong>. For stainless steel, the steady-state value of<br />
the coefficient of fricti<strong>on</strong> in parallel sliding directi<strong>on</strong> (0.11 ± 0.01) is lower than in the anti-parallel<br />
directi<strong>on</strong> (0.27 ± 0.05).<br />
5 ACKNOWLEDGEMENTS<br />
The authors would like to thank the Flemish Science Foundati<strong>on</strong> Flanders (FWO) for a fellowship (c<strong>on</strong>tract<br />
No. Senior- GP.007.10N) granted to JGB. This research is part of a research project d<strong>on</strong>e jointly by<br />
Universiteit Gent and Katholieke Universiteit Leuven and funded by the FWO-Flanders under c<strong>on</strong>tract n°<br />
F6/12-2008.<br />
6 REFERENCES<br />
[1] Davim, J.P., Cardoso, R., Effect of the reinforcement (carb<strong>on</strong> or glass fibres) <strong>on</strong> fricti<strong>on</strong> and wear<br />
behaviour of the PEEK against steel surface at l<strong>on</strong>g dry sliding, Wear, 266, 795-799, 2009.<br />
57<br />
Copyright © <str<strong>on</strong>g>2011</str<strong>on</strong>g> by Laboratory Soete
Sustainable C<strong>on</strong>structi<strong>on</strong> and Design <str<strong>on</strong>g>2011</str<strong>on</strong>g><br />
[2] Larsen, T., Andersen, T.L., Thorning, B., Horsewell, A., Vigild, M.E., Comparis<strong>on</strong> of fricti<strong>on</strong> and wear<br />
for an epoxy resin reinforced by a glass or a carb<strong>on</strong>/aramid hybrid weave, Wear, 262, 1013-1020,<br />
2007.<br />
[3] Sumer, M., Unal, H., Mimaroglu, A., Evaluati<strong>on</strong> of tribological behaviour of PEEK and glass fibre<br />
reinforced PEEK composite under dry sliding and water lubricated c<strong>on</strong>diti<strong>on</strong>s, Wear, 265, 1061-1065,<br />
2008.<br />
[4] Chang, L., Zhang, Z., Tribological properties of epoxy nanocomposites. Part II. A combinative effect<br />
of short carb<strong>on</strong> fibre with nano-TiO 2 , Wear, 260, 869-878, 2006.<br />
[5] Suresha, B., Siddaramaiah, Kishore, Seetharamu, S., Kumaran, P.S., Investigati<strong>on</strong>s <strong>on</strong> the influence<br />
of graphite filler <strong>on</strong> dry sliding wear and abrasive wear behaviour of carb<strong>on</strong> fabric reinforced epoxy<br />
composites, Wear, 267, 1405-1414, 2009.<br />
[6] Jia, J.H., Zhou, H.D., Gao, S.Q., Chen, J.M., A comparative investigati<strong>on</strong> of the fricti<strong>on</strong> and wear<br />
behavior of polymide composites under dry sliding and water-lubricated c<strong>on</strong>diti<strong>on</strong>, Materials Science<br />
and Engineering A, 356, 48-53, 2003.<br />
[7] Jia, J., Chen, J., Zhou, H., Hu, L., Chen, L., Comparative investigati<strong>on</strong> <strong>on</strong> the wear and transfer<br />
behaviors of carb<strong>on</strong> fiber reinforced polymer composites under dry sliding and water lubricati<strong>on</strong>,<br />
Composites Science and Technology, 65, 1139-1147, 2005.<br />
[8] Zhang, H., Zhang, Z., Friedrich, K., Effect of fiber length <strong>on</strong> the wear resistance of short carb<strong>on</strong> fiber<br />
reinforced epoxy composites, Composite Science and Technology, 67, 222-230, 2007.<br />
[9] Zhou, X.H., Sun, Y.S., Wang, W.S., Influences of carb<strong>on</strong> fabric/epoxy composites fabricati<strong>on</strong> process<br />
<strong>on</strong> its fricti<strong>on</strong> and wear properties, Journal of Materials Processing Technology, 209, 4553-4557,<br />
2009.<br />
[10] Lu, X., W<strong>on</strong>g, K.C., W<strong>on</strong>g, P.C., Mitchell, K.A.R., Cotter, J., Eadie, D.T., Surface characterizati<strong>on</strong> of<br />
polytetrafluoroethylene (PTFE) transfer films during rolling-sliding tribology tests using X-ray<br />
photoelectr<strong>on</strong> spectroscopy, Wear, 261, 1155-1162, 2006.<br />
[11] Suresha, B., Chandramohan, G., Siddaramaiah, Samapthkumaran, P., Seetharamu, S., Three-body<br />
abrasive wear behaviour of carb<strong>on</strong> and glass fiber reinforced epoxy composites, Materials Science<br />
and Engineering A, 443, 285-291, 2007.<br />
[12] Yamamoto, Y., Hashimoto, M., Fricti<strong>on</strong> and wear of water lubricated PEEK and PPS sliding c<strong>on</strong>tacts<br />
Part 2. Composites with carb<strong>on</strong> or glass fibre, Wear, 257, 181-189, 2004.<br />
[13] Kukureka, S.N., Hooke, C.J., Rao, M., Liao, P., Chen. Y.K., The effect of fibre reinforcement <strong>on</strong> the<br />
fricti<strong>on</strong> and wear of polyamide 66 under dry rolling-sliding c<strong>on</strong>tact, Tribology <str<strong>on</strong>g>Internati<strong>on</strong>al</str<strong>on</strong>g>, 32, 107-<br />
116, 1999.<br />
[14] Werner, P., Altstadt, V., Jaskulka, R., Jacobs, O., Sandler, J.K.W., Shaffer, M.S.P., Windle, A.H.,<br />
Tribological behaviour of carb<strong>on</strong>-nanofibre-reinforced poly(ether ether ket<strong>on</strong>e), Wear, 257, 1006-<br />
1014, 2004.<br />
[15] Friedrich, K., Zhang, Z., Schlarb, A.K., Effects of various fillers <strong>on</strong> the sliding wear of polymer<br />
composites, Composites Sliding and Technology, 65, 2329-2343, 2005.<br />
[16] Zhang, G., Rasheva, Z., Schlarb, A.K., Fricti<strong>on</strong> and wear variati<strong>on</strong>s of short carb<strong>on</strong> fiber<br />
(SCF)/PTFE/graphite (10 vol.%) filled PEEK: Effects of fiber orientati<strong>on</strong> and nominal c<strong>on</strong>tact<br />
pressure, Wear, 268, 893-899, 2010.<br />
[17] Myshkin, N.K., Petrokovets, M.I., Kovalev, A.V., Tribology of polymers: Adhesi<strong>on</strong>, fricti<strong>on</strong>, wear and<br />
mass-transfer, Tribology <str<strong>on</strong>g>Internati<strong>on</strong>al</str<strong>on</strong>g>, 38, 910-921, 2005.<br />
[18] Mohrbacher, H., Celis, J.P., Roos, J.R., Laboratory testing of displacement and load induced fretting,<br />
Tribology <str<strong>on</strong>g>Internati<strong>on</strong>al</str<strong>on</strong>g>, 28(5), 269-278, 1995.<br />
[19] Buijnsters, J.G., Camero, M., Vázquez, L., Agulló-Rueda, F., Gago, R., Jiménez, I., Gómez-<br />
Aleixandre, C., Albella, J.M., Diam<strong>on</strong>d and Related Materials, 19, 1093-1102, 2010.<br />
58<br />
Copyright © <str<strong>on</strong>g>2011</str<strong>on</strong>g> by Laboratory Soete
Sustainable C<strong>on</strong>structi<strong>on</strong> and Design <str<strong>on</strong>g>2011</str<strong>on</strong>g><br />
TURNING SPECIALITIES OF ZrO 2 CERAMICS<br />
G. Fledrich, I. Pálinkás, R. Keresztes, L. Zsidai, K. Petróczki<br />
Institute for Mechanical Engineering Technology, Faculty of Mechanical Engineering,<br />
Szent István University, Gödöllő, Hungary<br />
www.geti.gek.szie.hu<br />
Abstract In place of brittle ceramics used so far have appeared up-to-date so called tough ceramic<br />
materials resisting better against mechanical effects [6]. Such material is the zirc<strong>on</strong>ium-dioxide, too. The<br />
important advantage of hard-turning is the applicability of universal tool. Various outlines can be formed by<br />
a tool given. Machining ceramics in case of using traditi<strong>on</strong>al machining (turning, milling, drilling) requires<br />
special technological c<strong>on</strong>diti<strong>on</strong>s (tools, machine-tools, technological parameters, etc.) which are developing<br />
presently [2]. We would like extending our research work in this course, too.<br />
To clarify the machinability – turning – of ZrO 2 ceramics we developed a cutting force measurements for the<br />
applied CBN and PCD cutting tools. The forces were studied in the functi<strong>on</strong> of cutting speed and feed, the<br />
surfaces were analized by SEM and the cutting process was c<strong>on</strong>trolled by thermo-camera. The failure of<br />
cutting edges were also studied. The summarized results suggest the possible turning possibilities of ZrO 2<br />
ceramics.<br />
Keywords polycrystal diam<strong>on</strong>d, cubic bor<strong>on</strong> nitride, 3D-topography, heat ring, surface roughness, fricti<strong>on</strong><br />
1 INTRODUCTION<br />
By industry development the demand is increasing for such materials to be applied at higher temperature<br />
beside at heavy physical and chemical load. The structural ceramics can have an important role exactly in<br />
this segment. The zirc<strong>on</strong>ium –dioxide is also such material [3]. The role of ceramics hard-machining is<br />
increasing presently [4]. The zirc<strong>on</strong>ium-dioxide deriving from its lower hardness and from other<br />
characteristics [1] is suitable to machine by tool having regular edge can become a potential material at<br />
piece or small- and medium series producti<strong>on</strong>. To ensure this it has to be known its cutting characteristics<br />
[5].<br />
Our research work focusing a part of this in keeping with the recommendati<strong>on</strong> of the company producing<br />
and developing zirc<strong>on</strong>ium-dioxide semi-finished products.<br />
2 MATERIALS TESTED AND THEIR FORMS<br />
The comm<strong>on</strong> properties of engineering ceramics are that they have outstanding physical and chemical<br />
characteristics in very high temperature range [7]. The ceramics tested by us have got high hardness<br />
(1250-1800 HV), because of this it can be cut by polycrystal diam<strong>on</strong>d and cubic bor<strong>on</strong> nitride tools. The<br />
material tested is zirc<strong>on</strong>ium-dioxide ceramics. The specimens used at turning tests were cylindrical, their<br />
diameters were 16 and 20 mm (Figure 1).<br />
Figure 1. The zirc<strong>on</strong>ium-dioxide (Zn40) ceramics used at tests.<br />
59<br />
Copyright © <str<strong>on</strong>g>2011</str<strong>on</strong>g> by Laboratory Soete
Sustainable C<strong>on</strong>structi<strong>on</strong> and Design <str<strong>on</strong>g>2011</str<strong>on</strong>g><br />
The ceramic properties tested [6].<br />
Dimensi<strong>on</strong><br />
Material ZN 40<br />
Main comp<strong>on</strong>ent<br />
ZrO 2 -MgO<br />
Density g/cm 3 5,74<br />
Bending strength MPa 500<br />
Compressi<strong>on</strong> strength MPa 1600<br />
Young modulus GPa 210<br />
Poiss<strong>on</strong> - ratio 0,3<br />
Vickers hardness HV0,5 1240<br />
Thermal c<strong>on</strong>vectivity W/mK 3<br />
Linear coefficient of thermal expansi<strong>on</strong> 10 -6 K -1 10,2<br />
Cutting tests<br />
During turning the work-piece rotating movement is the main movement, the auxiliary movements are the<br />
turning tool movement in feeding and depth of cut directi<strong>on</strong>s. We have set the cutting speed by the workpiece<br />
revoluti<strong>on</strong> number.<br />
To measure the axial and tangential comp<strong>on</strong>ents of the cutting force [8] we have used a measuring toolhead<br />
with strain gauge. We have used the Spider 8 measuring amplifier for the tests. We have c<strong>on</strong>nected<br />
four channels. We have coupled to the O-channel the revoluti<strong>on</strong> marker, we have measured the tangential<br />
and feeding forces <strong>on</strong> the 1 and 2 channels. The 3. channel served to measure the tool displacement, here<br />
we have c<strong>on</strong>nected an inductive displacement tele-transmitter restored by spring.<br />
Heat affected z<strong>on</strong>e tests.<br />
The heat arising during cutting influences c<strong>on</strong>siderably the removal of stock process as well as influences<br />
very much the tool durability. We have also made shots with thermo-camera during cutting to study the heat<br />
affected z<strong>on</strong>e formed.<br />
3 DISCUSSION<br />
During cutting we have measured the main and feeding forces affecting the tool. With the measuringsystem<br />
capable to measure active forces-developed by us in the institute – we show some diagrams<br />
(Figure 2 and 3) in the followings. We present the main cutting force with thin line the feeding force with<br />
crossed line. We show the change of feed-rate with secti<strong>on</strong>s having circle end point.<br />
20<br />
Diagram of force measured (ZrO2-MgO, CBN)<br />
( a = 0,02 mm; f = 0,01-0,02-0,03-0,04-0,05 mm; vc = 75 m/min )<br />
0,2<br />
Cutting force [N]<br />
15<br />
10<br />
5<br />
0,15<br />
0,1<br />
0,05<br />
Feeding [mm/rev.]<br />
0<br />
0<br />
0 1 2 3 4 5 6 7 8 9 10 11 12 13 14 15 16<br />
Displacement length [mm]<br />
Main cutting force Feeding-force Feeding<br />
Figure 2. Diagrams of main cutting force and feeding force<br />
(v c = 75 m/min., a= 0,02 mm; f= 0,01-0,02-0,03-0,04-0,05 mm,<br />
ceramic: zirc<strong>on</strong>iumdioxide, tool: CBN)<br />
60<br />
Copyright © <str<strong>on</strong>g>2011</str<strong>on</strong>g> by Laboratory Soete
Sustainable C<strong>on</strong>structi<strong>on</strong> and Design <str<strong>on</strong>g>2011</str<strong>on</strong>g><br />
The zirc<strong>on</strong>ium-dioxide was cut with cubic bor<strong>on</strong> nitride tool in the above. Figure 2.<br />
It can be seen that main cutting force and feeding force show increasing tendency with the increasing feedrate.<br />
20<br />
Diagram of force measured (ZrO2-MgO, PCD)<br />
( a = 0,02 mm; f = 0,01-0,02-0,03-0,04-0,05 mm; vc = 75 m/min )<br />
0,2<br />
Cutting force [N]<br />
15<br />
10<br />
5<br />
0,15<br />
0,1<br />
0,05<br />
Feeding [mm/rev.]<br />
0<br />
0 1 2 3 4 5 6 7 8 9 10 11 12 13 14 15 16<br />
Dispalcement length [mm]<br />
Main cutting force Feeding-force Feeding<br />
0<br />
Figure 3. Diagrams of main cutting force and feeding force<br />
(v c = 75 m/min., a= 0,02 mm; f= 0,01-0,02-0,03-0,04-0,05 mm,<br />
ceramic: zirc<strong>on</strong>iumdioxide, tool: PCD)<br />
In Figure 3 at the same c<strong>on</strong>diti<strong>on</strong>s but cutting with polycrystal diam<strong>on</strong>d resulted some different curves. The<br />
main cutting force increase is less rising in this case but it has got similar tendency, the feeding force<br />
following a short rising shows rather smaller increasing angular curve.<br />
20<br />
Diagram of force measured (Plate graphite, PCD)<br />
( a = 0,02 mm; f = 0,01-0,02-0,03-0,04-0,05 mm; vc = 75 m/min )<br />
0,2<br />
Cutting force [N]<br />
15<br />
10<br />
5<br />
0,15<br />
0,1<br />
0,05<br />
Feeding [mm/rev.]<br />
0<br />
0<br />
0 1 2 3 4 5 6 7 8 9 10 11 12 13 14 15 16<br />
Displacement length [mm]<br />
Main cutting force Feeding-force Feeding<br />
Figure 4. Diagrams of main cutting force and feeding force<br />
(v c = 75 m/min., a= 0,02 mm; f= 0,01-0,02-0,03-0,04-0,05 mm,<br />
cast ir<strong>on</strong>: plate graphite, tool: PCD)<br />
We have cut plate graphite cast ir<strong>on</strong> with PCD-tool similar with previous cutting data in case of Figure 4.<br />
We compared the known cast ir<strong>on</strong> with zirc<strong>on</strong>ium-oxide unknown from turning standpoint is such way. The<br />
diagrams got are similar though with lower values. Difference can be experienced in the initial increasing<br />
61<br />
Copyright © <str<strong>on</strong>g>2011</str<strong>on</strong>g> by Laboratory Soete
Sustainable C<strong>on</strong>structi<strong>on</strong> and Design <str<strong>on</strong>g>2011</str<strong>on</strong>g><br />
secti<strong>on</strong>. The change of forces are directly proporti<strong>on</strong>al. In case of ceramic the initial increase is steeper at<br />
both tool materials.<br />
SEM photos of the cut surfaces can be seen in figure 5-7 in 2000 x magnificati<strong>on</strong>. The different surface<br />
effects of the CBN and PCD tools can be realized.<br />
Fig. 5. Ceramic surface, machined with CBN.<br />
v c =75 m/min., a = 0.02 mm, f = 0.04 mm/rev.<br />
magnificati<strong>on</strong> x2000<br />
Fig. 6. Ceramic surface, machined with PCD.<br />
v c =75 m/min., a = 0.02 mm, f = 0.04 mm/rev.<br />
magnificati<strong>on</strong> x2000<br />
Figure 7. Grinded surface<br />
The ZrO 2 phase transformati<strong>on</strong> tracks caused by mechanical effect can be seen in 2000x-magnificati<strong>on</strong> of<br />
the original surface grinded ( Figure 7.). In case of PCD-tool the rate of greater shell-like tears is similar to<br />
grinding. The amount of micro-cracks can be reduced based <strong>on</strong> the Figures. Less micro-cracks can be<br />
seen <strong>on</strong> surfaces turned compared to grinded in the Figures.<br />
3D-topography pictures can be seen in Figure 8-10.<br />
62<br />
Copyright © <str<strong>on</strong>g>2011</str<strong>on</strong>g> by Laboratory Soete
Sustainable C<strong>on</strong>structi<strong>on</strong> and Design <str<strong>on</strong>g>2011</str<strong>on</strong>g><br />
v c<br />
Figure 8. PCD tool turned<br />
Figure 9. PCD tool turned<br />
=75 m/min., a = 0.02 mm, f = 0.05 mm/rev. v c =75 m/min., a = 0.02 mm, f = 0.02 mm/rev.<br />
Figure 10. Grinded surface<br />
In Figure 8-9. can be seen that the higher cutting speed (v c =75 m/min.) resulted more favourable surface<br />
roughness than at lower cutting speed (v c =25 m/min.).<br />
From the point of applicability of cutting technology for ceramics, it is important to examine the fricti<strong>on</strong><br />
behaviour of the different machined ceramic surfaces (grinded and machined surfaces with different cutting<br />
tools and technological settings) because the most comm<strong>on</strong> applicati<strong>on</strong>s of such materials can be found<br />
am<strong>on</strong>g the slide bearing soluti<strong>on</strong>s.<br />
In the dry fricti<strong>on</strong> tribological model system – steel pin <strong>on</strong> the machined ceramic ring surfaces - we have<br />
analyzed the fricti<strong>on</strong> force (coefficient) (Figure.11), and wear. Regarding the machining phenomena of the<br />
two tool materials, the PCD tool was selected to produce machined ceramic surfaces with different<br />
technological settings. In the tribological test system we have increased the normal load in three steps:<br />
starting with 50N (σ Hertz-max = 391 N, without wear) load the measurements were running for 5 minutes, then<br />
it was increased upto 100 N for 5 minutes and further 150N was applied to the seizure of samples.<br />
Having S355 steel pin with grinded surface Ra 0,3 <strong>on</strong> the different machined ceramic ring surfaces, we<br />
have found that the applied higher cutting speed (v c =75 m/min) and lower feed (f=0,01-0,02 mm/ford)<br />
resulted lower fricti<strong>on</strong> between the steel and ceramic surface than it was with the original grinded ceramic<br />
surface. The original grinded ceramic surface has more but smaller sized “pits”, which can stick the steel<br />
worn particles, thus the fricti<strong>on</strong> process turns quickly to a steel/steel like c<strong>on</strong>tact having relatively high<br />
adhesi<strong>on</strong>.<br />
63<br />
Copyright © <str<strong>on</strong>g>2011</str<strong>on</strong>g> by Laboratory Soete
Sustainable C<strong>on</strong>structi<strong>on</strong> and Design <str<strong>on</strong>g>2011</str<strong>on</strong>g><br />
50<br />
Fricti<strong>on</strong> force<br />
( v = 0,23 m/s; PCD; 75 m/min )<br />
Fricti<strong>on</strong> force [N]<br />
45<br />
40<br />
35<br />
30<br />
25<br />
20<br />
15<br />
10<br />
5<br />
0<br />
0 100 200 300 400 500 600 700 800 900 1000<br />
Time [s]<br />
PCD 75 k PCD 75 5 PCD 75 4 PCD 75 3 PCD 75 2 PCD 75 1<br />
Figure 11. Fricti<strong>on</strong> force diagram<br />
(steel/grinded and machined ceramic surfaces)<br />
3 CONCLUSIONS<br />
Trend characterizing steel turning appears at using CBN turning tool, local cutting force maximum can be<br />
identified.<br />
In case of PCD-tool at higher cutting speed more favourable surface roughness can be got, comparing to<br />
CBN-tool.<br />
It is possible turning zirc<strong>on</strong>ium-dioxide semi-finished product. The c<strong>on</strong>diti<strong>on</strong> of the starting surface has got<br />
definite importance how is possible to turn the surface point of view. The raw-product surface grinded has<br />
damaged the PCD-tools in case of all cutting parameters tested.<br />
The hardness recommendati<strong>on</strong> accepted for tools in technical literature (3-4 times higher hardness<br />
difference in favour for the tool) can not be used at raw-products grinded in case of zirc<strong>on</strong>ium-dioxide<br />
ceramics, Softer, 2 times higher hardness can be used.<br />
Based <strong>on</strong> the tests can be established that given cutting speeds in case of increasing feedings at different<br />
tool-materials and workpiece materials show similar tendency, <strong>on</strong>ly in steepness is change. The<br />
phenomen<strong>on</strong> validity can be extended from the steel/carbide c<strong>on</strong>necti<strong>on</strong> to the zirc<strong>on</strong>ium-dioxide/CBN<br />
fricti<strong>on</strong>, chip removal c<strong>on</strong>necti<strong>on</strong>, too. The CBN and PCD-tools have resulted significantly different cutting<br />
forces. It can be stated that the cutting speed increase has resulted well measured increase in cutting force<br />
in case of diam<strong>on</strong>d turning tool which has called forth significant heat evoluti<strong>on</strong>.<br />
This is significantly unfavourable tribological c<strong>on</strong>necti<strong>on</strong>.<br />
The standard PCD –tool used did not result different surfaces regarding the surface roughness.<br />
It can be stated <strong>on</strong> the basis of SEM photos that <strong>on</strong> the surfaces grinded phase transformati<strong>on</strong>s take plate<br />
at microcracks. This results the higher cutting forces at turning in case of grinded surfaces. At surfaces<br />
turned phase transformati<strong>on</strong> can not be seen. The surface cut by PCD –tool results favourable surface<br />
roughness.<br />
We have found that it is possible to produce machined ceramic surface, which can offer better sliding<br />
properties against steel than the original grinded ceramic surface.<br />
64<br />
Copyright © <str<strong>on</strong>g>2011</str<strong>on</strong>g> by Laboratory Soete
Sustainable C<strong>on</strong>structi<strong>on</strong> and Design <str<strong>on</strong>g>2011</str<strong>on</strong>g><br />
4 NOMENCLATURE<br />
a depth of cut mm<br />
CBN cubic bor<strong>on</strong> nitride -<br />
f feed mm/rev<br />
F c cutting force N<br />
HV Vickers hardness -<br />
PCD polycrystal diam<strong>on</strong>d -<br />
R a surface roughness μm<br />
S355 structural steel -<br />
SEM scanning electr<strong>on</strong> microscop -<br />
v c cutting speed m/min<br />
ZrO 2 zirc<strong>on</strong>ium – dioxide (ceramic) -<br />
ZrO 2 -MgO zirc<strong>on</strong>ium – dioxide with magnesiumoxide (ceramic) -<br />
σ Hertz Hertzian stress MPa<br />
5 REFERENCES<br />
1. CURTIS, C.E.: Development of zirc<strong>on</strong>ia resistant to thermal shock. J. Am. Ceram. Soc. 30 180-196.,<br />
1947.<br />
2. A. H. Fritz, G. Schulze (Hrsg.):Fertigungstechnik. 8. Aufl Springer Verlag, Berlin 279. o., 2007<br />
3. H. SALMANG, H. SCHOLZE: Keramik, Springer Verlag, Berlin, 2007<br />
4. SWAIN, M.V.; ROSE, L.R.F.: Strength Limitati<strong>on</strong>s of Transformati<strong>on</strong>-Toughened Zirc<strong>on</strong>ia Alloys. J.<br />
Am. Ceram. Soc. 69 511-518., 1986.<br />
5. MÉSZÁROS I., SZEPESI D.: Edzett acélok nagyp<strong>on</strong>tosságú megmunkálása IV. Gépgyártás XLVI.<br />
évf. 4. sz. 29-33 old., 2006.<br />
6. SZÉPVÖLGYI J.: Korszerű műszaki kerámiák, Magyar Tudomány, 4. sz. 7- 13 old., 1994.<br />
7. CeramTec AG Innovative Ceramic Engineering Medical Products Divisi<strong>on</strong>: Broschüre 2008<br />
8. FARKAS G., KALÁCSKA G.:The effect of the different cutting tools <strong>on</strong> the micro-geometrical surface<br />
of engineering plastics. Sustainable C<strong>on</strong>structi<strong>on</strong> & Design. 2010. Vol.1. p. 102-107.<br />
65<br />
Copyright © <str<strong>on</strong>g>2011</str<strong>on</strong>g> by Laboratory Soete
Sustainable C<strong>on</strong>structi<strong>on</strong> and Design <str<strong>on</strong>g>2011</str<strong>on</strong>g><br />
IMPROVED HANDLING CHARACTERISTICS OF OFF-ROAD VEHICLES<br />
BY APPLYING ACTIVE CONTROL OF STEERING WHEEL TORQUE<br />
J. Kis, L. Jánosi<br />
Institute for Mechanical Engineering Technology, Faculty of Mechanical Engineering,<br />
Szent István University, Gödöllő, Hungary<br />
Abstract Driving speed of agricultural mobile machines have been increased in the recent years, raising<br />
serious questi<strong>on</strong>s about vehicle handling characteristics c<strong>on</strong>sidering the high center-of-gravity, multi-mass<br />
c<strong>on</strong>figurati<strong>on</strong> and rear-wheel-steering of these vehicles. The next generati<strong>on</strong> of steering systems <strong>on</strong> offroad<br />
vehicles will incorporate a steering column mechatr<strong>on</strong>ic subsystem which will generate tactile<br />
feedback for operator. This paper presents our research work to utilize steering wheel torque to improve<br />
off-road vehicle handling characteristics.<br />
Keywords agricultural mobile machines, rear wheel steering, off-road vehicles, haptic feedback, handling<br />
1 INTRODUCTION<br />
To gain productivity the weight and speed of off-road vehicles, particularly agricultural mobile machines is<br />
c<strong>on</strong>tinuously increasing. Operati<strong>on</strong> <strong>on</strong> the field (or in some circumstances at least retain mobility) and have<br />
safe and comfortable vehicle handling <strong>on</strong> public roads have c<strong>on</strong>tra verse requirements <strong>on</strong> vehicle design [6]<br />
Good example for the c<strong>on</strong>tra verse requirements is the tire design and pressure of agricultural tires. The<br />
design of the steering system is also a result of a suboptimal compromise between road transport and field<br />
operati<strong>on</strong>. Some vehicle have articulated steering Figure 1/b which allows <strong>on</strong>ly very limited speed, because<br />
of the steering kinematics. Self propelled forage harvester or combine harvesters are equipped with rear<br />
wheel steering, which have several benefits for the field operati<strong>on</strong> in terms of header operati<strong>on</strong>, and also in<br />
machine design in terms of body clearance. This c<strong>on</strong>cept has also serious drawbacks in terms of vehicle<br />
handling in transport mode, because of the stability problems with rear wheel steering.<br />
In Steer-by-Wire (SBW) systems there is no mechanical or hydraulic link between hand wheel and road<br />
wheels. The hand wheel angle is measured by redundant rotary sensors, processed by an electric c<strong>on</strong>trol<br />
unit to obtain road wheel angle, and calculates also the set value for the actuator c<strong>on</strong>trol. [3] This c<strong>on</strong>cept<br />
enables decoupling the moti<strong>on</strong> and the forces of the road wheels from the hand wheel moti<strong>on</strong> and torque,<br />
which makes possible to implement various driver supporting c<strong>on</strong>trol systems. Using an active force<br />
feedback device <strong>on</strong> hand wheel unit, the SBW system can provide various type of haptic signals for the<br />
operator.<br />
In this paper we investigate the stability c<strong>on</strong>diti<strong>on</strong>s for the heavy-duty agricultural vehicle with rear wheel<br />
steering. C<strong>on</strong>sidering of a SBW system with active force feedback, we present <strong>on</strong>e method to emulate<br />
synthetic torque <strong>on</strong> hand wheel, which corresp<strong>on</strong>ds to the ideal aligning moment of a virtual fr<strong>on</strong>t wheel<br />
steered vehicle. The paper will provide informati<strong>on</strong> about the calculati<strong>on</strong> of the state feedback gain, and the<br />
stability of the modified system. The c<strong>on</strong>cept uses the state variables of the vehicle moti<strong>on</strong>, which can be<br />
estimated <strong>on</strong> various ways, and these methods are not part of this paper.<br />
2 INFLUENCE OF MODEL PARAMETERS ON STABILITY<br />
2.1 Vehicle model<br />
For the investigati<strong>on</strong> of the rear wheel steering system, and the handling behavior of the heavy-duty<br />
agricultural mobile machine we use a linear single track model. The model and the resulting differential<br />
equati<strong>on</strong>s are derived in and analyzed for the fr<strong>on</strong>t wheel steering system but there is limited informati<strong>on</strong><br />
about pure rear wheel steering systems [2,4,7].<br />
The model shown <strong>on</strong> Figure 1/a is body with 3 degree of freedom, whereby moti<strong>on</strong> in z-plane is allowed.<br />
The differential equati<strong>on</strong>s for lateral and rotati<strong>on</strong>al moti<strong>on</strong>s are:<br />
66<br />
Copyright © <str<strong>on</strong>g>2011</str<strong>on</strong>g> by Laboratory Soete
Sustainable C<strong>on</strong>structi<strong>on</strong> and Design <str<strong>on</strong>g>2011</str<strong>on</strong>g><br />
The model is valid below 0.4g lateral accelerati<strong>on</strong>, and below 5 degree lateral tire slip. We investigate the<br />
vehicle under these c<strong>on</strong>diti<strong>on</strong>s in road transport mode. Assuming a c<strong>on</strong>stant velocity al<strong>on</strong>g x axis the state<br />
variables of the model can be reduced to the rotati<strong>on</strong>al speed r and slip angle . There are two lateral tire<br />
forces acting <strong>on</strong> the chassis, whereby l<strong>on</strong>gitudinal comp<strong>on</strong>ents are ignored.<br />
v f<br />
d f<br />
a f<br />
a<br />
a<br />
b<br />
a r<br />
v<br />
<br />
d r<br />
v r<br />
F sf<br />
m<br />
y<br />
F sr<br />
instantaneous<br />
centre<br />
geometry<br />
centre<br />
geometry<br />
centre<br />
b<br />
instantaneous<br />
centre<br />
a f<br />
F sr<br />
F sf<br />
v f<br />
d<br />
<br />
d a<br />
a r<br />
v r<br />
v<br />
s 1<br />
a<br />
s2<br />
b<br />
Figure 1: Linear single track models for fr<strong>on</strong>t/rear and articulated steering<br />
Because vehicle behavior is functi<strong>on</strong> of tire lateral force and moments, therefore model accuracy is<br />
significantly influenced by the accuracy of tire models. There are widely accepted n<strong>on</strong>linear tire models,<br />
e.g. the “magic formula” to cover different aspects of tire-road interacti<strong>on</strong>s. Due to small lateral slip, in our<br />
analysis we use a simple linear relati<strong>on</strong>ship between the lateral force and lateral slip, and aligning moment<br />
and lateral slip. The c<strong>on</strong>stant parameter used in the model is the cornering stiffness (C F,R ). In our analysis<br />
we d<strong>on</strong>’t c<strong>on</strong>sider the effect of suspensi<strong>on</strong> flexibility <strong>on</strong> lateral tire forces, and so the elasto-kinematic trail,<br />
because we investigate a system with no suspensi<strong>on</strong> and very rigid steering linkage (hydraulic cylinders<br />
acting directly <strong>on</strong> the wheel). We ignore the fact also that most of the mobile machines equipped with rear<br />
wheel steering are designed with large castor angle and mechanical trail. The model c<strong>on</strong>sider <strong>on</strong>ly the<br />
effect of the pneumatic trail <strong>on</strong> aligning moments.<br />
Using Figure 1/a we can obtain the equati<strong>on</strong>s for the tire lateral slip angles from rotati<strong>on</strong> and slip angle:<br />
Combining the equati<strong>on</strong> from above we can set up the differential equati<strong>on</strong>s for the single track model in<br />
the form where the derivatives of state variables are <strong>on</strong> the left hand side:<br />
Using these equati<strong>on</strong>s we can obtain the state equati<strong>on</strong>s of the system in matrix form x ̇ = A x + B u.<br />
67<br />
Copyright © <str<strong>on</strong>g>2011</str<strong>on</strong>g> by Laboratory Soete
Sustainable C<strong>on</strong>structi<strong>on</strong> and Design <str<strong>on</strong>g>2011</str<strong>on</strong>g><br />
The system state variables are x 1 = x 2 =r and the inputs are the steering angles d F,R . The differential<br />
equati<strong>on</strong> system in matrix form.<br />
2.2 Stability of rear wheel steered vehicles<br />
Why pure rear wheel steering is not used in passenger cars has several reas<strong>on</strong>s. One is that the tire<br />
aligning moment acts <strong>on</strong> opposite directi<strong>on</strong>, and changes directi<strong>on</strong> in transient situati<strong>on</strong>. Therefore<br />
mechanical force feedback can not be realized. The other reas<strong>on</strong> is, that because of the flexibility of the<br />
steering system and the suspensi<strong>on</strong>, an elasto-kinematic steering angle created, if lateral force is present.<br />
The opposite aligning moment increases this angle, therefore there is no stable operating point for this<br />
situati<strong>on</strong>.<br />
Driving the vehicle <strong>on</strong> steady-state path, the realized elasto-kinematic steering angle reduces the lateral<br />
force, which has an impact <strong>on</strong> the rear axle cornering stiffness and so <strong>on</strong> over steering behavior of the<br />
vehicle.<br />
2.3 Modeling the mechanical steering system<br />
To compare fr<strong>on</strong>t- and rear wheel steering, the single track vehicle model is extended with the model of the<br />
steering system. In this model the inertia, viscous fricti<strong>on</strong> and (as an external disturbance) hand wheel<br />
steering torque are modeled, and it can be regarded as a feedback system. The differential equati<strong>on</strong> used<br />
for the steering system model:<br />
The viscous fricti<strong>on</strong> is proporti<strong>on</strong>al to the angular speed of the steering system. This parameter can be part<br />
of the c<strong>on</strong>trol system and can represent a virtual fricti<strong>on</strong> to reduce system oscillati<strong>on</strong>s. The aligning moment<br />
depends <strong>on</strong>ly <strong>on</strong> the pneumatic trail and lateral force. The kinematic relati<strong>on</strong>ship between hand wheel angle<br />
and road wheels are modeled with fixed ratio i S .<br />
Combining the equati<strong>on</strong>s from above, and expressing the angular accelerati<strong>on</strong> the differential equati<strong>on</strong> of<br />
the steering system:<br />
Substituting the rear wheel steering angle in the differential equati<strong>on</strong>s of the single track vehicle model:<br />
This gives the state equati<strong>on</strong>s for the fr<strong>on</strong>t wheel steering system in the following form:<br />
68<br />
Copyright © <str<strong>on</strong>g>2011</str<strong>on</strong>g> by Laboratory Soete
Sustainable C<strong>on</strong>structi<strong>on</strong> and Design <str<strong>on</strong>g>2011</str<strong>on</strong>g><br />
The state equati<strong>on</strong> for the rear wheel steered vehicle :<br />
The difference between the two system matrix (A) are marked bold. We can see the negative feedback of<br />
the hand wheel angle <strong>on</strong> the yaw rate change and the angular accelerati<strong>on</strong>, which cases the system<br />
instability.<br />
In the following secti<strong>on</strong> we will analyze the stability of this system in functi<strong>on</strong> of different model parameters<br />
using the eigenvalues of the system matrix. It is known, that at given model parameter set, if all the<br />
eigenvalues of A have negative real parts the system is stable. Figure 2 shows the eigenvalues of the fr<strong>on</strong>t<br />
and rear wheel steered system at changing model parameters.<br />
Figure 2/a shows the effect of increasing ground speed <strong>on</strong> the system pole locati<strong>on</strong>s. Both pole pairs are<br />
slowing down, and the damping of the system is not changing. Because of the increasing phase lag the<br />
system poles get positive real parts, and at 25 m/s the system get unstable. Figure 2/b shows the effect of<br />
decreasing rear tire cornering stiffness. The damping of the faster pole pair is decreasing, due to the<br />
decreasing aligning moment. The slower pole pair get into the unstable regi<strong>on</strong> because of the over steering.<br />
It is obvious if the pneumatic trail get reduced (Figure 2/c) the c<strong>on</strong>trollability of the system decreases, which<br />
shows over damped poles at not changing viscous fricti<strong>on</strong>. If speed increases a higher viscous fracti<strong>on</strong><br />
value is required to keep vehicle stable (Figure 2/d). This is <strong>on</strong>e of the c<strong>on</strong>cept used in the following secti<strong>on</strong><br />
to modify vehicle handling characteristics. Figure 2/e shows the system poles of the rear wheel steered<br />
vehicle at increasing speed. It is obvious that this system is unstable, because it has <strong>on</strong>e real poles in the<br />
right hand plane.<br />
3 ALTERING VEHICLE HANDLING CHARACTERISTICS<br />
In this paper a c<strong>on</strong>cept will be presented to alter vehicle handling using an active force feedback device<br />
which will generate virtual aligning moment for the operator to keep the vehicle stable. In the following<br />
model we assume, that the wheels are c<strong>on</strong>trolled by an electromechanical actuator, which can “keep-up”<br />
with the hand wheel dynamics, disregarding the c<strong>on</strong>trol effort problem in this model.<br />
3.1 Haptic feedback modeling<br />
The haptic feedback is realized with a brushless DC motor and teethed belt transmissi<strong>on</strong>. The haptic<br />
feedback c<strong>on</strong>tains inertia, viscous fricti<strong>on</strong>, a ratio to hand wheel and a ratio the steered wheels. The torques<br />
acting <strong>on</strong> the motor shaft are:<br />
The generated back electromagnetic force (BEMF) using the motor parameters:<br />
The electrical differential equati<strong>on</strong> with impedances for the brushless dc motor:<br />
69<br />
Copyright © <str<strong>on</strong>g>2011</str<strong>on</strong>g> by Laboratory Soete
Imaginary Axis<br />
Imaginary Axis<br />
Imaginary Axis<br />
Imaginary Axis<br />
Imaginary Axis<br />
Sustainable C<strong>on</strong>structi<strong>on</strong> and Design <str<strong>on</strong>g>2011</str<strong>on</strong>g><br />
a<br />
8<br />
6<br />
System Poles<br />
b<br />
8<br />
6<br />
System Poles<br />
4<br />
4<br />
2<br />
2<br />
0<br />
0<br />
-2<br />
-2<br />
-4<br />
-4<br />
-6<br />
-6<br />
-8<br />
-10 -8 -6 -4 -2 0 2<br />
Real Axis<br />
-8<br />
-10 -8 -6 -4 -2 0 2<br />
Real Axis<br />
c<br />
6<br />
4<br />
2<br />
System Poles<br />
d<br />
8<br />
6<br />
4<br />
2<br />
a<br />
b<br />
System Poles<br />
a<br />
b<br />
0<br />
0<br />
-2<br />
-2<br />
-4<br />
-4<br />
-6<br />
-6<br />
-12 -10 -8 -6 -4 -2 0<br />
Real Axis<br />
-8<br />
-10 -8 -6 -4 -2 0 2<br />
Real Axis<br />
System Poles<br />
10<br />
e<br />
8<br />
a. increasing ground speed: loosing<br />
6<br />
4<br />
2<br />
0<br />
-2<br />
-4<br />
-6<br />
-8<br />
-10<br />
-10 -8 -6 -4 -2 0 2 4<br />
Real Axis<br />
Figure 2: System pole locati<strong>on</strong>s with changing model parameters.<br />
stability at 25mps (positive real part of<br />
system matrix eigenvalues)<br />
b. System poles at decreasing rear wheel<br />
cornering stiffness: loosing stability<br />
c. decreasing pneumatic trail, remaining<br />
viscous fricti<strong>on</strong><br />
d. decreasing viscous fricti<strong>on</strong>, at 10 m/s<br />
(a) and 20 m/s (b)<br />
e. unstable Rear Wheel Steering poles at<br />
increasing speed<br />
Combining the mechanical and dynamic differential equati<strong>on</strong>s we get for the haptic feedback:<br />
70<br />
Copyright © <str<strong>on</strong>g>2011</str<strong>on</strong>g> by Laboratory Soete
Sustainable C<strong>on</strong>structi<strong>on</strong> and Design <str<strong>on</strong>g>2011</str<strong>on</strong>g><br />
The state equati<strong>on</strong>s for the haptic feedback device:<br />
Because of the limited dynamics of the whole system, in the simulati<strong>on</strong> we ignore the inductive impedance.<br />
And therefore we can reduce the number of state variables to angular speed and angle positi<strong>on</strong>. The<br />
reduced state equati<strong>on</strong>s are:<br />
The input of the haptic feedback is the armature voltage which is c<strong>on</strong>trolled by the state feedback c<strong>on</strong>troller.<br />
3.2 Explicit calculati<strong>on</strong> of feedback gain for emulated fr<strong>on</strong>t wheel steering<br />
The c<strong>on</strong>trol system is shown <strong>on</strong> Figure 3. There are several methods for optimal design for the feedback<br />
gain, e.g. the c<strong>on</strong>cept of the linear quadratic regulator (LQR). It will give optimal soluti<strong>on</strong> for full state<br />
feedback at given transient and steady-state c<strong>on</strong>strains.<br />
t D<br />
Haptic Feedback<br />
Device<br />
d R<br />
Rear Wheel<br />
Steering Vehicle<br />
<br />
r<br />
f<br />
f<br />
v<br />
State Feedback<br />
C<strong>on</strong>troller<br />
Figure 3: State feedback c<strong>on</strong>troller for rear wheel steered vehicle (without steering actuator dynamics)<br />
based <strong>on</strong> emulated fr<strong>on</strong>t wheel aligning moment and added viscous fricti<strong>on</strong><br />
We follow a different method by explicit calculating the feedback gain, because we would like to emulate a<br />
steering system which has a fr<strong>on</strong>t wheel steering. So the system may work suboptimal compared to the<br />
LQR design but gives the operator the feeling of an fr<strong>on</strong>t wheel steered vehicle. The c<strong>on</strong>troller has to<br />
calculate the necessary voltage to create realistic steering torque:<br />
The emulated hand wheel torque can be calculated <strong>on</strong> the virtual aligning moment <strong>on</strong> the fr<strong>on</strong>t wheels in<br />
case of an fr<strong>on</strong>t wheel steering plus the synthetic viscous fricti<strong>on</strong> in the system, which is used to modify<br />
system dynamics.<br />
71<br />
Copyright © <str<strong>on</strong>g>2011</str<strong>on</strong>g> by Laboratory Soete
Imaginary Axis<br />
Sustainable C<strong>on</strong>structi<strong>on</strong> and Design <str<strong>on</strong>g>2011</str<strong>on</strong>g><br />
Substituting into the electric equati<strong>on</strong> we get for the voltage:<br />
After modifying the equati<strong>on</strong> above we can describe the four feedback gains for all four state variables:<br />
Some parameters of the c<strong>on</strong>trol system are given by vehicle geometry or electrical comp<strong>on</strong>ents(a, b, R,<br />
etc.) State variables are directly or indirectly measurable like yaw rate, lateral accelerati<strong>on</strong> angular speed,<br />
angle. Other parameters like cornering stiffness must be estimated by <strong>on</strong>line system identificati<strong>on</strong><br />
algorithms. The results of the simulati<strong>on</strong> <strong>on</strong> unit hand wheel torque is shown <strong>on</strong> figure 5.<br />
4<br />
System Poles<br />
3<br />
2<br />
b<br />
b<br />
1<br />
a<br />
0<br />
a<br />
-1<br />
-2<br />
-3<br />
-4<br />
-14 -12 -10 -8 -6 -4 -2 0 2<br />
Real Axis<br />
Figure 4: System poles of the single track model with haptic feedback at increasing damping at 10<br />
mps(a) and 20 mps(b)<br />
4 CONCLUSIONS<br />
Off-road vehicles with rear wheel steering have acceptable handling <strong>on</strong>ly at lower speeds. This behavior<br />
can be significantly improved by using active haptic feedback systems. The presented method of explicitly<br />
calculating the feedback gain to emulate fr<strong>on</strong>t wheel steering feedback can improve the stability of system.<br />
This is shown <strong>on</strong> Figure 4, whereby the closed loop poles of the system with increasing damping at<br />
different ground speed are <strong>on</strong> the left hand plane, If appropriate synthetic viscous fricti<strong>on</strong> has been set.<br />
Further work is necessary to c<strong>on</strong>sider a road wheel actuator with finite dynamics, analyze the effect of the<br />
state estimati<strong>on</strong> and parameter identificati<strong>on</strong>. The presented c<strong>on</strong>cept must be also verified <strong>on</strong> real vehicle.<br />
72<br />
Copyright © <str<strong>on</strong>g>2011</str<strong>on</strong>g> by Laboratory Soete
delta R<br />
[rad]<br />
v [volta]<br />
F SF [N]<br />
F SR [N]<br />
beta [rad]<br />
r [rad/sec]<br />
tau D<br />
[Nm]<br />
acc y [mps2]<br />
Sustainable C<strong>on</strong>structi<strong>on</strong> and Design <str<strong>on</strong>g>2011</str<strong>on</strong>g><br />
1<br />
1<br />
0.8<br />
0<br />
0.6<br />
-1<br />
0.4<br />
-2<br />
0.2<br />
-3<br />
0<br />
0 1 2 3 4 5<br />
Time [sec]<br />
-4<br />
0 1 2 3 4 5<br />
Time [sec]<br />
0.16<br />
0.14<br />
0.12<br />
0.1<br />
0<br />
-0.05<br />
-0.1<br />
-0.15<br />
0.08<br />
0.06<br />
0.04<br />
0.02<br />
0<br />
0 1 2 3 4 5<br />
Time [sec]<br />
-0.2<br />
-0.25<br />
-0.3<br />
-0.35<br />
-0.4<br />
0 1 2 3 4 5<br />
Time [sec]<br />
0.5 x 10⁴ Time [sec]<br />
1 x 10⁴<br />
0<br />
-0.5<br />
-1<br />
-1.5<br />
0<br />
-1<br />
-2<br />
-2.5<br />
-3<br />
-3.5<br />
-4<br />
0 1 2 3 4 5<br />
-2<br />
-3<br />
-4<br />
0 1 2 3 4 5<br />
Time [sec]<br />
0.16<br />
0.14<br />
0.12<br />
0.1<br />
0.08<br />
0.06<br />
0.04<br />
0.02<br />
1<br />
0.5<br />
0<br />
-0.5<br />
-1<br />
-1.5<br />
-2<br />
0<br />
0 1 2 3 4 5<br />
Time [sec]<br />
Figure 5: Step resp<strong>on</strong>se of the system to unit hand wheel torque<br />
-2.5<br />
0 1 2 3 4 5<br />
Time [sec]<br />
73<br />
Copyright © <str<strong>on</strong>g>2011</str<strong>on</strong>g> by Laboratory Soete
Sustainable C<strong>on</strong>structi<strong>on</strong> and Design <str<strong>on</strong>g>2011</str<strong>on</strong>g><br />
5 NOMENCLATURE<br />
F SF,SR Lateral tire force N<br />
C F,R Cornering stiffness N/rad<br />
a F,R Tire slip angle rad<br />
d F,R Steering angle rad<br />
a,b acc to fig. 1 m<br />
r Yaw rate rad/s<br />
Slip angle rad<br />
v Ground speed m/s<br />
v Voltage V<br />
I Inertia kgm2<br />
Hand wheel angle rad<br />
J S Steering inertia kgm2<br />
t Torque <strong>on</strong> hand wheel Nm<br />
i S Steering ratio -<br />
f Motor shaft angle rad<br />
J H<br />
HapticFeedback inertia kgm2<br />
Current A<br />
K M<br />
Motor torque c<strong>on</strong>stant Nm/A<br />
K F Viscous c<strong>on</strong>stant Nms/rad<br />
K B BEMF c<strong>on</strong>stant Vs/rad<br />
R Resistance Ohm<br />
i H Haptic ratio -<br />
i M Force feedback ratio -<br />
6 REFERENCES<br />
[1] Janosi, L., & Kis, J. (2010.). Steer-by-Wire Technology: Steering wheel as new, intelligent Human<br />
Machine Interface. VDI-MEG. <str<strong>on</strong>g>C<strong>on</strong>ference</str<strong>on</strong>g> Agricultural Engineering. (pp. 7-14.). Düsseldorf: VDI Verlag.<br />
[2] Jazar, R. N. (2008). Vehicle Dynamics: Theory and Applicati<strong>on</strong>s. NY: Springer.<br />
[3] Kopetz, H. (1997). Real-Time Systems: Design Principles for Distributed Embedded Applicati<strong>on</strong>s.<br />
L<strong>on</strong>d<strong>on</strong>: Kluwer Academic Publishers.<br />
[4] Odenthal, D. (2002). How to make Steer-by-Wire Feel like Power Steering. 1<str<strong>on</strong>g>5th</str<strong>on</strong>g> Triennial World<br />
C<strong>on</strong>gress, Barcel<strong>on</strong>a, Spain: Elsevier IFAC.<br />
[5] Switkes, J., Rossetter, E., & Gerdes, J. (2006). Handwheel Force feedback for Lanekeeping<br />
Assistance: Combined Dynamics and Stability. Journal of Dynamic Systems Measurement and C<strong>on</strong>trol<br />
v.128, no. 3 , 532-542.<br />
[6] Tapazdi, T., Kis, J., & Laib, L. (1997). Does the C<strong>on</strong>cept of the trailer with propelled Axles Experince a<br />
renaissance. VDI-MEG. <str<strong>on</strong>g>C<strong>on</strong>ference</str<strong>on</strong>g> Agricultural Engineering. (pp. 55-58.). Düsseldorf.: VDI-Verlag.<br />
[7] Yih, P., & Gerdes, J. (2005, oct. 25). Modificati<strong>on</strong> of vehicle handling characteristics via steer-by-wire.<br />
IEEE Transacti<strong>on</strong>s <strong>on</strong> C<strong>on</strong>trol Systems Technology , pp. 965-976.<br />
74<br />
Copyright © <str<strong>on</strong>g>2011</str<strong>on</strong>g> by Laboratory Soete
Sustainable C<strong>on</strong>structi<strong>on</strong> and Design <str<strong>on</strong>g>2011</str<strong>on</strong>g><br />
DEVELOPMENT ENVIRONMENT FOR HAPTIC FEEDBACK DEVICE ON<br />
MOBILE AGRICULTURAL EQUIPMENT<br />
L. Jánosi, J. Kis<br />
Institute for Mechanical Engineering Technology, Faculty of Mechanical Engineering,<br />
Szent István University, Gödöllő, Hungary<br />
www.geti.gek.szie.hu<br />
Abstract The steering wheel equipped with a tactile feedback is a human machine interface (HMI),<br />
capable to present sophisticated feedback informati<strong>on</strong> for the operator. Haptic stimulati<strong>on</strong> is superior in<br />
interpretati<strong>on</strong> speed by humans compared to audio-visual informati<strong>on</strong>. In this paper we present the<br />
c<strong>on</strong>cept of haptic feedback <strong>on</strong> vehicle and the <strong>on</strong>going research activities at the Department of<br />
Mechatr<strong>on</strong>ics to develop flexible technology to retrofit producti<strong>on</strong> machines with steer-by-wire capability to<br />
collect data representing the interacti<strong>on</strong>s in different applicati<strong>on</strong> c<strong>on</strong>text (road and field modes).<br />
Keywords haptic feedback, steering wheel, off-road vehicles<br />
1 INTRODUCTION<br />
In the last decade numerous scientific results has been presented to the engineering community in the topic<br />
of Steer-by-Wire technology (SBW). Despite the fact that the more complex mechatr<strong>on</strong>ics providing the bywire<br />
functi<strong>on</strong>ality raises several safety related questi<strong>on</strong>s, also open exciting new opportunities for off-road<br />
vehicles not existing before.<br />
The topic SBW can be discussed in numerous aspects: For example the advanced sensor/actuator<br />
comp<strong>on</strong>ents, the administrative regulati<strong>on</strong> of by-wire systems, the failure-tolerant communicati<strong>on</strong> to<br />
interc<strong>on</strong>nect comp<strong>on</strong>ents and the redundant system design are all large topics al<strong>on</strong>e [1], [2]. We would like<br />
to focus in this presentati<strong>on</strong> <strong>on</strong> the new, exciting functi<strong>on</strong>s, which could be realized by the Human-Machine-<br />
Interfaces (HMI) of the SBW systems.<br />
Driving speed of agricultural mobile machines have been increased in the recent years, raising serious<br />
questi<strong>on</strong>s about vehicle handling characteristics c<strong>on</strong>sidering the high center-of-gravity, multi-mass<br />
c<strong>on</strong>figurati<strong>on</strong> and rear-wheel-steering of these vehicles. The next generati<strong>on</strong> of steering systems <strong>on</strong> offroad<br />
vehicles will incorporate a steering column mechatr<strong>on</strong>ic subsystem which will generate tactile<br />
feedback for operator.<br />
Figure 1. Operator’s C<strong>on</strong>trol Functi<strong>on</strong>s: the „5 level model”<br />
The steering wheel and its force-feedback actuator should be recognized as a new operator interface which<br />
enables the representati<strong>on</strong> of feedback informati<strong>on</strong> <strong>on</strong> a new way.<br />
75<br />
Copyright © <str<strong>on</strong>g>2011</str<strong>on</strong>g> by Laboratory Soete
Sustainable C<strong>on</strong>structi<strong>on</strong> and Design <str<strong>on</strong>g>2011</str<strong>on</strong>g><br />
C<strong>on</strong>sidering the “operator – steering – vehicle” as a closed loop c<strong>on</strong>trol system, quality of the c<strong>on</strong>trol<br />
system performance significantly can be improved or degraded by the quality of the steering wheel<br />
feedback [5]. The force or pressure sensed by the human hand – to so called haptic stimulus - get a<br />
significantly faster interpretati<strong>on</strong> in our brain compared to the acoustic or visual informati<strong>on</strong>.<br />
The HMI’s of today’s agricultural equipment are based mostly <strong>on</strong> visual informati<strong>on</strong> and some acoustic<br />
warning signals. These channels are overloaded and a new signal representati<strong>on</strong> could be very useful to<br />
unload these channels. There are several HMI devices in the cockpit, where an intelligent feedback signal<br />
could be used: hydraulic levers with force feedback, or speed handles with tracti<strong>on</strong> feedback, etc.<br />
2 5 LEVEL MODEL OF OPERATOR ASSISTANCE SYSTEMS IN AGRICULTURAL EQUIPMENT<br />
The haptic feedback signals of the vehicle steering should be analyzed as part of the ‘big picture’, as sub<br />
domain of the Operator Assistance System in agricultural mobile equipment. Analogy with passenger car<br />
exist, c<strong>on</strong>sidering the Driver Assistance Systems (Fahrer Assistanz Systeme - FAS).<br />
In passenger cars the functi<strong>on</strong>s of supporting electr<strong>on</strong>ics can be linked to hierarchy levels of driver’s<br />
c<strong>on</strong>trolling functi<strong>on</strong>s: navigati<strong>on</strong>, trajectory selecti<strong>on</strong> and vehicle stabilizing [3]. The navigati<strong>on</strong> systems are<br />
<strong>on</strong> the topmost level, helping to locate the vehicle and selecting optimal route. Recent advance in<br />
automotive electr<strong>on</strong>ic systems provide support for the driver to keep vehicle inside the lane, and to keep<br />
safe distance in busy traffic. Stabilizing of the vehicle needs the shortest resp<strong>on</strong>se time from the driver, and<br />
this is very well supported today by electr<strong>on</strong>ic systems in the car. (advertised with acr<strong>on</strong>yms like ABS, ESP,<br />
ASR, etc.)<br />
Using this analogy, similar hierarchy levels can be defined <strong>on</strong> agricultural mobile equipment also Figure 1.<br />
These levels should be extended with two more hierarchy levels compared to passenger car, which are<br />
unique <strong>on</strong> mobile equipment: Collaborative task executi<strong>on</strong> and process c<strong>on</strong>trol. Collaborative task<br />
executi<strong>on</strong> is very comm<strong>on</strong> <strong>on</strong> field work, whereby operators must synchr<strong>on</strong>ize the moti<strong>on</strong> and processes of<br />
several machines (e.g. Forage Harvester + Transport Equipment). In the collaborative field maneuvers<br />
safety is extremely critical to avoid equipment damage or serious injuries. As we know, there are no product<br />
features or electr<strong>on</strong>ic systems available to support operator in these functi<strong>on</strong>s.<br />
The majority of the mobile agricultural equipments are “rolling factories”, whereby the complex processes<br />
have to be c<strong>on</strong>trolled: settings must be changed according to changing field c<strong>on</strong>diti<strong>on</strong>s, to achieve the<br />
requested product quality and equipment productivity. These processes are also supported some by<br />
electr<strong>on</strong>ic systems, mostly by visualizing process key figures or reloading preset values of machine<br />
settings. Navigati<strong>on</strong> task <strong>on</strong> mobile equipment is supported by GPS based precisi<strong>on</strong> farming systems. The<br />
trajectory decisi<strong>on</strong> and speed c<strong>on</strong>trol are also supported by GPS based automatic steering, which functi<strong>on</strong>s<br />
are state-of-the-art <strong>on</strong> today’s producti<strong>on</strong> machines.<br />
Figure 2. Haptic feedback signal testing equipment<br />
76<br />
Copyright © <str<strong>on</strong>g>2011</str<strong>on</strong>g> by Laboratory Soete
Sustainable C<strong>on</strong>structi<strong>on</strong> and Design <str<strong>on</strong>g>2011</str<strong>on</strong>g><br />
The vehicle stability and c<strong>on</strong>trollability gets even more important. Increasing productivity means often<br />
higher transport speed and higher vehicle weight <strong>on</strong> public roads. We should c<strong>on</strong>sider the fact, that these<br />
vehicles will have higher center of gravity, low lateral stiffness of tires (terra) and no real suspensi<strong>on</strong>, even<br />
some have rear-wheel steering. This represents a rising risk, which can be significantly reduced by<br />
electr<strong>on</strong>ic systems, supporting the operator in stabilizing the vehicle. The numerous complex c<strong>on</strong>trolling<br />
task requires new informati<strong>on</strong> channels to be established, in order to provide safe way to feed informati<strong>on</strong><br />
to the operator. Haptic feedback signals of the steering system regarded as <strong>on</strong>e of this opportunities.<br />
3 HAPTIC FEEDBACK RESEARCH METHODS AND TOOLS<br />
Flexible research platform was designed to analyze the human-machine interacti<strong>on</strong> and the vehicle<br />
dynamics, in accordance with the above menti<strong>on</strong>ed physical and artificial feedback signals. The toolset can<br />
be placed <strong>on</strong> any kind of vehicle, with or without power steering.<br />
.<br />
Figure 3. The dsPICDEMTM MCLV Development Board<br />
The Figure 2 is showing the schematic of the tool used in the HMI experiments. The steering wheel positi<strong>on</strong><br />
and driving torque is c<strong>on</strong>trolled by a brushless dc motor (BLDC) and timing belt transmissi<strong>on</strong> which is free<br />
from backlash. The four quadrant power electr<strong>on</strong>ics servo system (Figure 3 and Figure 4) incorporates the<br />
experimental feedback logic software.<br />
The steering shaft is driven also by a high torque servo with timing belt. The high torque is required<br />
because also vehicles with no hydraulic support are going to be analyzed.<br />
Figure 4. Human-in-the-Loop simulati<strong>on</strong> tool chain<br />
The moti<strong>on</strong> of the steering wheel and the steering shaft are independent, therefore ratio, torque and timing<br />
could be programmed according to the analyzed effect. In case of locked clutch in the transmissi<strong>on</strong>, makes<br />
the ratio between steering wheel and steering shaft fixed and experiments with superpositi<strong>on</strong> torque c<strong>on</strong>trol<br />
can be executed.<br />
77<br />
Copyright © <str<strong>on</strong>g>2011</str<strong>on</strong>g> by Laboratory Soete
Sustainable C<strong>on</strong>structi<strong>on</strong> and Design <str<strong>on</strong>g>2011</str<strong>on</strong>g><br />
4 FEEDBACK SIGNALS REPRESENTED BY THE HUMAN MACHINE INTERFACE<br />
As menti<strong>on</strong>ed in the previous secti<strong>on</strong>, the steering wheel regarded as a Human Machine Interface, can<br />
present several signal types to the operator. Let us overview first the signal types and their possible use in<br />
c<strong>on</strong>trol of agricultural mobile machines.<br />
Some of the possible emulated signals are of physical nature, and can be derived from the tire-soil/road<br />
interacti<strong>on</strong> or vehicle dynamics. Some others are artificial feedback signals, like warnings or guiding<br />
signals. Physical or artificial feedbacks are programmable, and can be activated or suppressed dependent<br />
<strong>on</strong> the work-envir<strong>on</strong>ment c<strong>on</strong>text, driving situati<strong>on</strong> or user preferences.<br />
4.1 Emulated aligning moment and tire side forces<br />
It has been proven [4], that intenti<strong>on</strong>al modificati<strong>on</strong> of the steering wheel torque has a positive impact <strong>on</strong><br />
vehicle stability. State-of-the-art c<strong>on</strong>trol technology used extensively in driver assistance systems like ESP<br />
[7],which is able to estimate state variables of vehicle moti<strong>on</strong>, using signal processing algorithms (based<br />
<strong>on</strong> Kalman filtering), and set of low-cost sensors (wheels speed, lateral accelerati<strong>on</strong>). This state informati<strong>on</strong><br />
derived from the internal model can be used to calculate simulated aligning moment of the wheels.<br />
This informati<strong>on</strong> of vehicle dynamics fed to the operator by emulating with the steering wheel haptic<br />
feedback (Illustrated in Example 1). Aligning moment can be also decreasing if wheel slip increases; this<br />
gives informati<strong>on</strong> about fr<strong>on</strong>t wheel tracti<strong>on</strong>.<br />
Figure 5. C<strong>on</strong>trol c<strong>on</strong>cept for Haptic Feedback<br />
In certain operati<strong>on</strong>al c<strong>on</strong>text it is advantageous; if operator is able to realize if the turning torque of the<br />
wheel is rapidly increasing. In case of ploughing, guiding vehicle in furrow, or hitting an object, lateral forces<br />
<strong>on</strong> tire are transmitted to the steering wheel, and are interpreted by the operator as guiding or warning<br />
signals.<br />
Off-road vehicles using hydrostatic steering lacks <strong>on</strong> steering feedback, which have a negative impact <strong>on</strong><br />
vehicle handling, especially at higher speeds. An active steering feedback have an advantage, that <strong>on</strong>ly<br />
positive effects are emulated which can improve resp<strong>on</strong>se time and quality, cornering predictability, center<br />
point feeling and reduce overshooting and unwanted steering torque oscillati<strong>on</strong>s. Feeling of the applied<br />
steering torque and or aligning moment support the operator to c<strong>on</strong>trol vehicle in turning (Figure 5). This is<br />
<strong>on</strong>e the most important haptic informati<strong>on</strong> <strong>on</strong> the steering wheel, which should be emulated by the active<br />
force feedback device. The aligning moment is present until steering wheel and the wheels get back to a<br />
neutral positi<strong>on</strong>, which is very useful (and safe) for vehicles, which have hard to see rear wheels. The<br />
emulated steering provides informati<strong>on</strong> about tracti<strong>on</strong> c<strong>on</strong>diti<strong>on</strong>s, side forces, fricti<strong>on</strong> coefficients or slip. If<br />
the driver gets closer to tracti<strong>on</strong> limit the emulated aligning torque decreases.<br />
4.2 Warning and guiding signals<br />
Warning signals are of great importance, because haptic informati<strong>on</strong> is realized significantly faster than<br />
audio or visual signals. Collisi<strong>on</strong> avoidance or other operator acti<strong>on</strong>s requiring fast resp<strong>on</strong>se should be<br />
placed <strong>on</strong> steering wheel actuator, for example as vibrati<strong>on</strong>. This could be combined with guiding signals,<br />
which gives the operator a proposed directi<strong>on</strong> of safe steering wheel moti<strong>on</strong>.<br />
78<br />
Copyright © <str<strong>on</strong>g>2011</str<strong>on</strong>g> by Laboratory Soete
Sustainable C<strong>on</strong>structi<strong>on</strong> and Design <str<strong>on</strong>g>2011</str<strong>on</strong>g><br />
Guiding signals offers several applicati<strong>on</strong> possibilities (see applicati<strong>on</strong> <strong>on</strong> passenger cars [6]): proposed<br />
driving directi<strong>on</strong> based <strong>on</strong> GPS positi<strong>on</strong>, or local sensors. The driver can override anytime the guiding<br />
signals, and system will go back to the original proposed directi<strong>on</strong>. The guiding signal feels like a magnetic<br />
c<strong>on</strong>veyor. The guided directi<strong>on</strong> could be a GPS based straight running, returning to steering wheel zero<br />
positi<strong>on</strong> or “centre point feeling”. The last <strong>on</strong>e could be interesting, if no aligning moment available or<br />
vehicle have any visible steered wheels.<br />
Guiding signals can be used efficiently in collaborative working envir<strong>on</strong>ment, whereby moti<strong>on</strong> of machinechains<br />
should be synchr<strong>on</strong>ized. In this case a guiding steering torque presented in both vehicle. If a handle<br />
with active feedback available, also speed could be synchr<strong>on</strong>ized.<br />
4.3 Steering wheel used as hand force sensor<br />
The steering wheel is able not <strong>on</strong>ly measure the positi<strong>on</strong>-velocity-accelerati<strong>on</strong>, but also measures torque<br />
using current sensing of the motor drive. If velocity informati<strong>on</strong> and the driving torque available changes of<br />
inertia and reactive torque can be estimated. This informati<strong>on</strong> is used to determine the operator fitness or<br />
availability. If an automatic steering device available, often operators d<strong>on</strong>’t hold the steering wheel, which<br />
represent a risk.<br />
For most of the working machines (forklift, forage harvester) is essential to identify operator presence for<br />
safety, and for this mostly a simple switch is built in the seat. This simple sensor cannot identify if the driver<br />
is inactive, e.g. sleeping. The haptic feedback <strong>on</strong> the steering can be used to integrate an intelligent driver<br />
presence sensing algorithm.<br />
The power electr<strong>on</strong>ics have build in current sense comp<strong>on</strong>ents, and the driving torque can be calculated<br />
very accurately, without using any additi<strong>on</strong>al sensors. Using the known calibrated rotati<strong>on</strong>al inertia of the<br />
system and the motor driving/braking torque, the hand force of the operator can be estimated. If no steering<br />
force required, <strong>on</strong> stand or driving <strong>on</strong> a straight line, the steering wheel can use a modulated “ringing”<br />
signal to check, if driver’s hands are still <strong>on</strong> the steering wheel.<br />
Changing the steering ratio dynamically can improve the steering-kinematics. Unique functi<strong>on</strong>s can be<br />
implemented, like backing-up with trailer where a virtual relocati<strong>on</strong> of the steered wheel from fr<strong>on</strong>t to back is<br />
possible. Implements using three point hitch can be also regarded as a new opti<strong>on</strong> for relocati<strong>on</strong> of the<br />
virtual steered wheels and create optimal new steering kinematics.<br />
4.4 Hardware-in-the-Loop simulati<strong>on</strong><br />
Figure 6 a-b shows the steering wheel angle and c<strong>on</strong>troller internal model outputs at different model<br />
settings. If lower damping (angular speed dependent viscous fricti<strong>on</strong>) is used the system resp<strong>on</strong>se (yaw<br />
rate, slipping angle) oscillate (Figure 6/a-d), which is close to the handling experience with passenger cars<br />
<strong>on</strong> public roads. Increasing the damping these oscillati<strong>on</strong>s <strong>on</strong> the steering wheel can be reduced (Figure<br />
6/e-f) and so the optimal value for comfort and safety can be achieved.<br />
Figure 6/g shows an implementati<strong>on</strong> of the above menti<strong>on</strong>ed soft-end feel. Figure 6/h shows both soft-end<br />
implementati<strong>on</strong> and an example for the synthetic warning signals at assumed handling limits (yaw rate).<br />
5 CONCLUSIONS<br />
Haptic feedback is an interesting new opportunity to improve functi<strong>on</strong>ality of agricultural mobile machines.<br />
There are numerous opti<strong>on</strong>s to implement physical type of signals, like aligning moment, to increase safety<br />
and vehicle handling.<br />
There is also a new and interesting opportunity to design synthetic haptic feedback to present fast, and not<br />
yet existing warning signals for the operator. Using the presented development envir<strong>on</strong>ment and the<br />
human-in-the-loop simulati<strong>on</strong> tools further investigati<strong>on</strong> of the human-machine interacti<strong>on</strong> must be<br />
analyzed.<br />
The haptic feedback can be used in the same time as an intelligent sensor to detect driver presence and<br />
ability. This opportunity must be investigated further involving erg<strong>on</strong>omist expertise.<br />
79<br />
Copyright © <str<strong>on</strong>g>2011</str<strong>on</strong>g> by Laboratory Soete
Sustainable C<strong>on</strong>structi<strong>on</strong> and Design <str<strong>on</strong>g>2011</str<strong>on</strong>g><br />
100<br />
80<br />
60<br />
a<br />
0.4<br />
0.3<br />
b<br />
Steering Wheel Angle [deg]<br />
40<br />
20<br />
0<br />
-20<br />
-40<br />
-60<br />
-80<br />
-100<br />
1 2 3 4 5 6 7 8 9<br />
Time [s]<br />
Feedback Torque [Nm]<br />
0.2<br />
0.1<br />
0<br />
-0.1<br />
-0.2<br />
-0.3<br />
-0.4<br />
2 3 4 5 6 7 8 9 10<br />
Time [s]<br />
20<br />
15<br />
c<br />
3<br />
d<br />
10<br />
2<br />
Yaw Rate [deg/s]<br />
5<br />
0<br />
-5<br />
-10<br />
Sideslip Angle [deg]<br />
1<br />
0<br />
-1<br />
-15<br />
-2<br />
-20<br />
-3<br />
2 3 4 5 6 7 8 9<br />
Time [s]<br />
1 2 3 4 5 6 7 8 9 10<br />
Time [s]<br />
20<br />
15<br />
e<br />
3<br />
f<br />
10<br />
2<br />
Yaw Rate [deg/s]<br />
5<br />
0<br />
-5<br />
-10<br />
Sideslip Angle [deg]<br />
1<br />
0<br />
-1<br />
-15<br />
-2<br />
-20<br />
-3<br />
1 2 3 4 5 6 7 8 9<br />
Time [s]<br />
1 2 3 4 5 6 7 8 9<br />
Time [s]<br />
100<br />
g<br />
1.5<br />
h<br />
Steering Wheel Angle [deg]<br />
80<br />
60<br />
40<br />
20<br />
Feedback Torque [Nm]<br />
1<br />
0.5<br />
0<br />
0<br />
4 4.5 5 5.5 6 6.5<br />
Time [s]<br />
4.5 5 5.5 6 6.5<br />
Time [s]<br />
Figure 6: Human-in-the-Loop test results with different parameter set<br />
80<br />
Copyright © <str<strong>on</strong>g>2011</str<strong>on</strong>g> by Laboratory Soete
Sustainable C<strong>on</strong>structi<strong>on</strong> and Design <str<strong>on</strong>g>2011</str<strong>on</strong>g><br />
6 REFERENCES<br />
[1] Amberkar, Sanket. „A C<strong>on</strong>trol System Methodology for Steer by Wire Systems.” Reprinted From:<br />
Steering and Suspensi<strong>on</strong> Technology Symposium 2004. Michigan: 2004 SAE World C<strong>on</strong>gress, 2004.<br />
[2] Kopetz, Hermann. Real-Time Systems: Design Principles for Distributed Embedded Applicati<strong>on</strong>s.<br />
L<strong>on</strong>d<strong>on</strong>: Kluwer Academic Publishers, 1997.<br />
[3] Winner, Hermann, Hakuli, Stephan and Wolf, Gabriele. Handbuch Fahrerassistenzsysteme.<br />
Wiesbanden : Vieweg, 2009.<br />
[4] Odenthal, Dirk. „How to make Steer-by-Wire Feel like Power Steering.” 1<str<strong>on</strong>g>5th</str<strong>on</strong>g> Triennial World C<strong>on</strong>gress,<br />
Barcel<strong>on</strong>a, Spain: Elsevier IFAC, 2002.<br />
[5] Schmidt, Gerrit. Haptische Signale in der Lenkung: C<strong>on</strong>trollability zusätzlicher Lenkmomente.<br />
Braunschweig: Technischen Universität Carolo-Wilhelmina zu Braunschweig, Dissertati<strong>on</strong>, 2009.<br />
[6] Switkes, J.P., E.J. Rossetter, és J.C. Gerdes. „Handwheel Force feedback for Lanekeeping Assistance:<br />
Combined Dynamics and Stability.” Journal of Dynamic Systems Measurement and C<strong>on</strong>trol v.128, no.<br />
3, 2006: 532-542.<br />
81<br />
Copyright © <str<strong>on</strong>g>2011</str<strong>on</strong>g> by Laboratory Soete
Sustainable C<strong>on</strong>structi<strong>on</strong> and Design <str<strong>on</strong>g>2011</str<strong>on</strong>g><br />
ABRASIVE WEAR OF DIFFERENT HOT-DIP GALVANIZED<br />
MULTILAYERS<br />
L. Szabadi, G. Kalácska, L. Pék, I. Pálinkás<br />
Institute for Mechanical Engineering Technology, Faculty of Mechanical Engineering, Szent István<br />
University, Gödöllő,<br />
www.geti.gek.szie.hu<br />
Abstract<br />
More and more steel c<strong>on</strong>structi<strong>on</strong>s are provided with zinc coatings as durable protecti<strong>on</strong> against corrosi<strong>on</strong>.<br />
Hot-dip galvanizing process is widely used in Europe c<strong>on</strong>sidering its favourable characteristics. Lately<br />
beside the corrosi<strong>on</strong> resistance demand of hot-dip galvanized coatings as a new requirement is the<br />
abrasive wear resistance. The industrial floor boards, agricultural walking grids get heavy abrasi<strong>on</strong> effect.<br />
The abrasive wear resistance of zinc coatings with multilayer structure is not tested yet, less known<br />
domain.<br />
Keywords: hot-dip galvanized, diffusi<strong>on</strong>, abrasive wear, gradient material structure.<br />
1 INTRODUCTION, APPLICATION FIELDS OF COATING HOT-DIP GALVANIZED, THEIR<br />
PRODUCING AND THE COATING CHARACTERISTICS<br />
The hot-dip galvanizing technology is used for durable resistance against of surfaces of ir<strong>on</strong>- and steel<br />
c<strong>on</strong>structi<strong>on</strong>s and of goods sold by the piece, its protecti<strong>on</strong> effect depends decisively <strong>on</strong> the thickness of a<br />
layer [1]. Its main applicati<strong>on</strong> fields suggested is the surface protecti<strong>on</strong> against atmospheric load in all<br />
corrosivity grades as well as to protect the metal structures of indoor ventilated spaces. Its applicati<strong>on</strong><br />
expands c<strong>on</strong>tinuously because of its reliable protective effect, the process industrial-scale applicability, its<br />
comparatively high productivity and low need for human labor demand. C<strong>on</strong>tinually increasing proporti<strong>on</strong> of<br />
steel c<strong>on</strong>structi<strong>on</strong>s manufactured in Europe-yearly more than 6 milli<strong>on</strong> t<strong>on</strong>-are covered by coatings hot-dip<br />
galvanized. Nowadays the products get also mechanical loads beside corrosi<strong>on</strong> effects at industrial filters,<br />
industrial, agricultural, public square pavement grids hot-dip galvanized meaning new and at the same time<br />
expanding applicati<strong>on</strong> fields. At surfaces hot-dip galvanized exposed to abrasive wear, sand and<br />
breakst<strong>on</strong>e spreading there is an applicati<strong>on</strong> demand for today wear- and fricti<strong>on</strong> resistant coatings.<br />
Comparing test data regulated relating to wear resistance there are not available neither in technical<br />
literature nor in the data-base of companies producing and developing coatings. These data are<br />
indispensable to develop technology improving wear resistance.<br />
Two basic groups developed hot-dip galvanizing [2]. The most characteristic phase of individual processes<br />
are the dip into the metal bath exists at each group, however there are significant differences between<br />
individual soluti<strong>on</strong>s c<strong>on</strong>sidering the preceding surface preparati<strong>on</strong> and subsequent treatments. There is no<br />
difference between the two process groups c<strong>on</strong>sidering the zinc-layer forming which takes place by the<br />
same physical-chemical processes. They so called c<strong>on</strong>tinuous technologies bel<strong>on</strong>g to the first group, during<br />
which the product to be galvanized “as spliced” c<strong>on</strong>tinuously with suitable speed passes through <strong>on</strong> the<br />
technological system.<br />
The c<strong>on</strong>tinuous broad strip-, narrow strip- and wire galvanizing processes have similar methods essentially.<br />
The strip surfaces are oxide relieved in a closed technological system, their materials are heated up then<br />
are guided into zinc-bath where the coat develops.<br />
The so called periodic technologies bel<strong>on</strong>g to the sec<strong>on</strong>d group. At there the products get treatment by<br />
individually or in groups. The surface is here also pre-treated then this is followed with hot-dip galvanizing.<br />
Covering steel c<strong>on</strong>structi<strong>on</strong>s bel<strong>on</strong>g to this group, too.<br />
The pure zinc is readily-formed and soft metal. The Zn hardness- 55-70HBS [3] is far below of the mild<br />
steel hardness -120HBS-, thus its wear resistance is also significantly smaller. In case of alloyed steels this<br />
difference can be still significantly greater. The structure of zinc-layer is determined decisively by the<br />
82<br />
Copyright © <str<strong>on</strong>g>2011</str<strong>on</strong>g> by Laboratory Soete
Sustainable C<strong>on</strong>structi<strong>on</strong> and Design <str<strong>on</strong>g>2011</str<strong>on</strong>g><br />
chemical compositi<strong>on</strong> and texture of steel base-metal, the zinc-bath temperature, the dip durati<strong>on</strong>, the zincbath<br />
alloying elements, the surface c<strong>on</strong>diti<strong>on</strong> and thickness of the workpiece as well drawing out speed and<br />
the lifting method of the workpiece to be coated [4]. During dip-hot galvanizing an intermetallic, multi phase<br />
zinc layer develops <strong>on</strong> the products surfaces. The last step of technological treatment is the galvanizing<br />
when at about 450 0 C temperature the zinc atoms diffuse into the clean metal surface and produce atomic<br />
(cohesi<strong>on</strong>) b<strong>on</strong>d infiltrating into the metal-crystalline, namely they form an alloy with ir<strong>on</strong>, <strong>on</strong> the zinc-ir<strong>on</strong><br />
boundary surface zinc rich Fe-crystallines develop. This forms essentially the “adhesive-bridge” between<br />
the zinc coating and the ir<strong>on</strong> plate. The further alloy layers are based <strong>on</strong> this which ir<strong>on</strong> c<strong>on</strong>tent decreases<br />
progressively to the outer layer and in case of optimal steel quality also cease to exist. The coating<br />
thickness is about 80-100 μm. Figure 1. shows the zinc layer structure.<br />
Figure 1. The zinc layer structure and the individual phases.<br />
The gradient material structure developed during diffusi<strong>on</strong> is not homogeneous, its compositi<strong>on</strong> changes in<br />
the functi<strong>on</strong> of thickness.<br />
2 METHOD AND RESULTS<br />
2.1 Specimens tested<br />
We have chosen S235JRG2 steel as specimen material used for abrasive tests, which is the most definite<br />
base metal for example of pavement grid. As this material is desoxidized with aluminium- and not with<br />
silicium – and the mechanism of layer developing is determined first of all by the amount of silicium to be in<br />
steel, therefore it can be hot-dip galvanizing outstandingly. We have taken into account at deciding the<br />
specimens dimensi<strong>on</strong> the tool form of the abrasi<strong>on</strong> tester, as well as those positi<strong>on</strong>s and the geometrical<br />
dimensi<strong>on</strong> of the c<strong>on</strong>tainer c<strong>on</strong>taining the abrasive medium ensuring abrasi<strong>on</strong>. Figure 2 shows the<br />
dimensi<strong>on</strong> of specimen galvanized.<br />
Figure 2. Specimen dimensi<strong>on</strong>.<br />
Two types of coating were tested in the functi<strong>on</strong> of fricti<strong>on</strong> length, speed and pressure of abrasive medium.<br />
- Technigalva: The determining comp<strong>on</strong>ents are the zinc (Zn), aluminium (Al), lead<br />
(Pb) and nickel (Ni) of the zinc-bath. The coating was made by dry<br />
periodic technology.<br />
- Technigalva heat treated: The specimens were heat treated in order to the coating should<br />
have zinc-ir<strong>on</strong> alloy phases in the total cross-secti<strong>on</strong>.<br />
Copyright © <str<strong>on</strong>g>2011</str<strong>on</strong>g> by Laboratory Soete<br />
83
Sustainable C<strong>on</strong>structi<strong>on</strong> and Design <str<strong>on</strong>g>2011</str<strong>on</strong>g><br />
The abrasi<strong>on</strong> resistance of coatings depends <strong>on</strong> its hardness, therefore it is needed to measure the microhardness.<br />
The micro-hardness tests showed that the Techigalva coatings had 48HVM in average, while the<br />
heat treated coating had 106 HVM in average.The testing points <strong>on</strong> the specimen’s surface can be seen in<br />
figure 3. we have selected 10 – 10 test speciemens and after measuring each <strong>on</strong>es the registered hardness<br />
values were averaged that are summarized in Table 1.<br />
Figure 3. The hardness measuring points <strong>on</strong> the specimen’s surface<br />
Table 1. the measured micro Vickers hardness values<br />
Measuring point<br />
„Technigalva” sample<br />
[HV M]<br />
„Heat treated<br />
Technigalva” sample<br />
[HV M]<br />
1 48,7 98,2<br />
2 50,7 97,3<br />
3 45,9 114,2<br />
4 46,8 92,5<br />
5 49,7 96,3<br />
6 45,9 89,5<br />
7 51,8 101,4<br />
8 49,7 105,4<br />
9 45,9 108,2<br />
10 54,0 112,2<br />
11 45,9 112,2<br />
12 42,5 103,5<br />
13 41,7 96,3<br />
14 43,3 91,2<br />
15 44,7 91,2<br />
Figure 4. and 5. show the SEM-pictures made from coatings, introducing the distinguished layers and EDS<br />
sampling areas. Certain layers, phases can be separated very good in the thousand-fold magnificati<strong>on</strong>. We<br />
have also carried out EDS (Electr<strong>on</strong> Detector System) tests.<br />
EDS spectra result are summarized in table 2., the measured graphs can be seen in Figure 6.<br />
84<br />
Copyright © <str<strong>on</strong>g>2011</str<strong>on</strong>g> by Laboratory Soete
Sustainable C<strong>on</strong>structi<strong>on</strong> and Design <str<strong>on</strong>g>2011</str<strong>on</strong>g><br />
Figure 4. 1000X-magnificati<strong>on</strong> of<br />
Technigalva specimen zinc coating,<br />
(numbered layers with indicated EDS<br />
z<strong>on</strong>e)<br />
Figure 5. 1000X magnificati<strong>on</strong> of specimen<br />
heat treated zinc coating, (numbered layers<br />
with indicated EDS z<strong>on</strong>e)<br />
Table 2. EDS spectra result of Fe, Zn and Pb values (%)<br />
Technigalva „T”<br />
Heat treated Technigalva „H”<br />
Layer Fe (%) Zn (%) Pb (%) Fe (%) Zn (%) Pb (%)<br />
1 16,4 83,6 - 47,5 52,5 -<br />
2 10,1 89,9 - 16,3 87,7 -<br />
3 - 100 - 19,6 79,6 0,8<br />
4 - 21,2 78,8 17,9 82,1 -<br />
Figure 6. EDS spectra of Technivalva<br />
layer, phase Gamma (1)<br />
Figure 7. EDS spectra of heat treated<br />
Technivalva layer, phase Gamma (1)<br />
Copyright © <str<strong>on</strong>g>2011</str<strong>on</strong>g> by Laboratory Soete<br />
85
Sustainable C<strong>on</strong>structi<strong>on</strong> and Design <str<strong>on</strong>g>2011</str<strong>on</strong>g><br />
Figure 8. EDS spectra of Technivalva<br />
layer, phase Delta (2)<br />
Figure 9. EDS spectra of heat treated<br />
Technivalva layer, phase Delta (2)<br />
Figure 10. EDS spectra of Technivalva<br />
layer, phase Zeta (3)<br />
Figure 11. EDS spectra of heat treated<br />
Technivalva layer, phase Zeta (3)<br />
Figure 12. EDS spectra of Technivalva<br />
layer, phase Eta (4)<br />
Figure 13. EDS spectra of heat treated<br />
Technivalva layer, phase Eta (4)<br />
2.2 Abrasi<strong>on</strong> test with “sand-slurry” equipment<br />
The “sand-slurry” principle is well known in the VI. test category of tribological modeling. Several versi<strong>on</strong>s<br />
are wide-spread but they agree that for example in a sand with grain compositi<strong>on</strong> given - as in abrasive<br />
medium – a specimen moves in circular orbit generally with speed given. Great number of specimens can<br />
be measured at the same time in abrasive medium given as well as it can be well define but beside in<br />
different c<strong>on</strong>diti<strong>on</strong>s with the abrasi<strong>on</strong> tester developed in the Institute for Mechanical Engineering<br />
Technology. The results got made possible the evaluati<strong>on</strong> according to various standpoints, too. Figure 14.<br />
shows the abrasi<strong>on</strong> tester developed.<br />
86<br />
Copyright © <str<strong>on</strong>g>2011</str<strong>on</strong>g> by Laboratory Soete
Sustainable C<strong>on</strong>structi<strong>on</strong> and Design <str<strong>on</strong>g>2011</str<strong>on</strong>g><br />
The electric motor shaft c<strong>on</strong>nects to a worm-gear which gear transmissi<strong>on</strong> in 22,58. The working shaft can<br />
be found at the exit side of the worm-gear <strong>on</strong> which 3 pcs. arm cross-clamps can be found – in different<br />
heights related to the base plate (Figure 15.) The specimens to be abraded can be fixed in suitable positi<strong>on</strong><br />
<strong>on</strong> this. To <strong>on</strong>e tool, to each arm 3 pcs. altogether 6-6 pcs. specimens can be fixed. Important characteristic<br />
of the cross-clamps is that the specimens can be fixed with each other in 90 0 included positi<strong>on</strong>, at their<br />
sides in pairs altogether 6 various positi<strong>on</strong>s related to the centre of gyrati<strong>on</strong>. The tools are set turned away<br />
to <strong>on</strong>e another <strong>on</strong> the working shaft in top view the circle is divided to 30 0 sectors. The c<strong>on</strong>tainer c<strong>on</strong>taining<br />
the abrasive medium can be put into an outer c<strong>on</strong>tainer in case of demand, which can be filled with coolingheating<br />
water to the thermal dynamics of measuring procedure can be regulated.<br />
Tested specimens<br />
Figure 14. The abrasi<strong>on</strong> with specimens mounted.<br />
Figure 15. Specimens placed <strong>on</strong> three levels.<br />
The abrasive medium was 0/8 OK – type ballast st<strong>on</strong>e. Its average aggregati<strong>on</strong> density in dry c<strong>on</strong>diti<strong>on</strong> is<br />
1,7 t<strong>on</strong>/m 3 . There is no practically clay-sludge c<strong>on</strong>tent as it is produced from washed, granulated gravels by<br />
knapping. The grain fracti<strong>on</strong> is between 2 and 8 mm.<br />
The specimens to be in different radiuses move with various different peripheral speed in the abrasive<br />
medium and the height positi<strong>on</strong> results different surface pressure rati<strong>on</strong>s (Figure 16). The abrasi<strong>on</strong> tester<br />
makes possible excepti<strong>on</strong>al complex evaluati<strong>on</strong> in the functi<strong>on</strong> of these variables.<br />
Copyright © <str<strong>on</strong>g>2011</str<strong>on</strong>g> by Laboratory Soete<br />
87
Sustainable C<strong>on</strong>structi<strong>on</strong> and Design <str<strong>on</strong>g>2011</str<strong>on</strong>g><br />
2.3 The abrasi<strong>on</strong> and speed c<strong>on</strong>necti<strong>on</strong><br />
We have measured the abrasi<strong>on</strong> of the 6 pcs. heat treated and 6 pcs. not heat treated specimens placed in<br />
all three levels (A,B,C) after seven various abrasi<strong>on</strong> time. The surface pressures in standing (not rotating)<br />
c<strong>on</strong>diti<strong>on</strong>:<br />
p 1 (A level) = 153,83 Pa<br />
p2 (B level) = 521,82 Pa<br />
p3 (C level) = 902,41 Pa<br />
Testing speed range: 14 – 40 m/min<br />
Figure 16. Positi<strong>on</strong> of specimens <strong>on</strong> different radiuses.<br />
The specimens covered different length with different peripheral speed moving <strong>on</strong> various radiuses. After<br />
averaging the abrasi<strong>on</strong> results measured at each specimen, repeating three times the measuring series the<br />
same incline could be seen at the lines to be adapteable to the plot at heat treated and not heat treated<br />
specimens, too. Based <strong>on</strong> these the speed independence supposed were proved by mathematical –<br />
statistical methods, by covariance analyses at all three levels at heat treated and not heat treated<br />
specimens, too. The abrasi<strong>on</strong> values of all specimens to be in the different levels can be presented with a<br />
single regressi<strong>on</strong> straight line.<br />
This means that the abrasi<strong>on</strong> values do not depend <strong>on</strong> the abrasive speed in the speed domain tested<br />
(Figure 17. and 18). There is no significant difference between the specimens moved with various speeds<br />
but placed at the same level.<br />
70<br />
wear (um)<br />
60<br />
Heat treated, level A<br />
50<br />
40<br />
Heat treated, level B<br />
Heat treated, level C<br />
y = 0,0007x + 0,5017<br />
R 2 = 0,9964<br />
y = 0,0006x + 0,3581<br />
R 2 = 0,9962<br />
30<br />
20<br />
y = 0,0005x + 0,5453<br />
R 2 = 0,996<br />
10<br />
0<br />
0 10000 20000 30000 40000 50000 60000 70000 s (m)<br />
Figure 17. Abrasi<strong>on</strong> values of heat treated specimens <strong>on</strong> “A”, “B” and “C” level<br />
(h 1 , h 2 and h 3 depth)<br />
88<br />
Copyright © <str<strong>on</strong>g>2011</str<strong>on</strong>g> by Laboratory Soete
Sustainable C<strong>on</strong>structi<strong>on</strong> and Design <str<strong>on</strong>g>2011</str<strong>on</strong>g><br />
wear (um)<br />
70<br />
60<br />
Not heat treated, level A<br />
Not heat treated, level B<br />
y = 0,001x + 0,4293<br />
R 2 = 0,9996<br />
y = 0,0009x + 0,4236<br />
R 2 = 0,9996<br />
50<br />
Not heat treated, level C<br />
40<br />
30<br />
y = 0,0008x + 0,4761<br />
R 2 = 0,9994<br />
20<br />
10<br />
0<br />
0 10000 20000 30000 40000 50000 60000 70000 s (m)<br />
Figure 18. Not heat treated specimens abrasi<strong>on</strong> values <strong>on</strong> “A”, “B” and “C” levels.<br />
2.4 C<strong>on</strong>necti<strong>on</strong> between surface load and abrasi<strong>on</strong><br />
The specimens placed <strong>on</strong> the “A”, “B” and “C” level get different surface loads because of this the abrasi<strong>on</strong><br />
values measured <strong>on</strong> “A”, “B” and “C” levels has to be compared. According to the hypothesis the abrasi<strong>on</strong><br />
values depend <strong>on</strong> the load. It can be approximated with linear trend-line the appropriate data to different<br />
levels <strong>on</strong> the diagrams, the matching is close in each case. The data appropriate to different levels can be<br />
separated visibly however if there is significant difference between them it has to be examined by<br />
regressi<strong>on</strong> analysis. The worst case is where there is the smallest difference: this is the “A” and “B” level<br />
data of the specimens heat treated. The calculati<strong>on</strong>s carried out proved that there is significant difference<br />
between the abrasi<strong>on</strong> values of specimens fixed <strong>on</strong> “A” and “B” level. This means that the amount of<br />
surface load has significant effect <strong>on</strong> the abrasi<strong>on</strong> values in the system tested. In case of higher load the<br />
specimens have got higher abrasi<strong>on</strong>.<br />
2.5 Comparing the layer structure of coating and abrasi<strong>on</strong> values<br />
The abrasi<strong>on</strong> measured as a resulting effect <strong>on</strong> the surface of specimens means the c<strong>on</strong>tinuous decreasing<br />
of coatings with layer structure. In Figure 19. and 20. can be seen how changes the percentage rate of<br />
decisive chemical elements in certain layers of heat treated specimens. The chemical compositi<strong>on</strong>’s<br />
changing does not influence the abrasi<strong>on</strong> intensity. According to data tested by EDS spectroscopy the<br />
percentage rate of chemical elements in the layers of not heat treated specimens is formed otherwise, but<br />
this compound does not influence the abrasi<strong>on</strong> intensity of certain layers.<br />
Copyright © <str<strong>on</strong>g>2011</str<strong>on</strong>g> by Laboratory Soete<br />
89
Sustainable C<strong>on</strong>structi<strong>on</strong> and Design <str<strong>on</strong>g>2011</str<strong>on</strong>g><br />
Figure 19. Heat treated specimens abrasi<strong>on</strong> and the c<strong>on</strong>necti<strong>on</strong> of layer structure.<br />
Figure 20. Not treated specimens abrasi<strong>on</strong> and layer structure<br />
90<br />
Copyright © <str<strong>on</strong>g>2011</str<strong>on</strong>g> by Laboratory Soete
Sustainable C<strong>on</strong>structi<strong>on</strong> and Design <str<strong>on</strong>g>2011</str<strong>on</strong>g><br />
3 CONCLUSION<br />
- The multilayer coatings of hot-dip galvanized abrasi<strong>on</strong> intensity in the test-system does not depend <strong>on</strong><br />
the ficti<strong>on</strong> speed neither at heat treated nor at not heat treated specimens, but it depends <strong>on</strong> the<br />
medium pressure and <strong>on</strong> the resistance of medium deriving from that.<br />
- The heat treatment improves the abrasive resistance. The higher hardness results higher abrasive<br />
resistance improvement.<br />
- SEM-pictures and EDS spectroscopy proved that heat treatment results different gradient layer structure<br />
and compositi<strong>on</strong>.<br />
- The linear abrasi<strong>on</strong> dynamics of hot-dip galvanized layers tested does not depend <strong>on</strong> that, which layer<br />
comes to fricti<strong>on</strong> c<strong>on</strong>necti<strong>on</strong> with abrasive medium. The inner gradient fricti<strong>on</strong> character did not effect<br />
the abrasi<strong>on</strong> intensity measured, but the resultant of different gradient structure has different abrasive<br />
resistance.<br />
4 REFERENCES<br />
[1] Arenasa M. A., Damboreneaa J. Medranob J., A., J., García B. A., Rodríguez R. (2002): Corrosi<strong>on</strong><br />
behaviour of rare earth i<strong>on</strong>-implanted hot-dip galvanised steel. Surface and Coatings Technology,<br />
<str<strong>on</strong>g>Volume</str<strong>on</strong>g> 158-159, Page 615-619<br />
[2] Magyar Tűzihorganyzók szövetsége: Szakmai Ismeretek, Dunaújváros, Dunatáj Kiadó Kft.,<br />
Dunaújváros, 1997 (Associati<strong>on</strong> of Hungarian Hot Dip galvanizing Companies. Professi<strong>on</strong>al<br />
Knowledge. In Hungarian)<br />
[3] Dr. Zorkóczi Béla: Metallográfia és anyagvizsgálat, Tankönyvkiadó Budapest, 1975. (Metallurgy and<br />
Material Testing. In Hungarian)<br />
[4] Magyar Tűzihorganyzók szövetsége, Tűzihorganyzás, CD-kiadvány, 2008. (Associati<strong>on</strong> of Hungarian<br />
Hot Dip galvanizing Companies. Galvanizing Technologies. In Hungarian)<br />
Copyright © <str<strong>on</strong>g>2011</str<strong>on</strong>g> by Laboratory Soete<br />
91
Day of Research 2010 – February 10 – Labo Soete, Ghent University, Belgium<br />
INVESTIGATION OF FRICTION HYSTERESIS USING A LABORATORY-<br />
SCALE TRIBOMETER<br />
P. D. Neis 1,2 , P. De Baets 2 , Y. Perez Delgado 2 and N. F. Ferreira 1<br />
1 Federal University of Rio Grande do Sul, Brazil<br />
2 Ghent University, Laboratory Soete, Belgium<br />
Abstract The current paper addresses the characterizati<strong>on</strong> of dynamic fricti<strong>on</strong> by using a laboratory-scale<br />
tribometer. A special post-processing script in MatLab has been developed in order to analyse the data<br />
from the experiments. A sine wave signal for the velocity is imposed, with three different frequencies and,<br />
c<strong>on</strong>sequently, accelerati<strong>on</strong> and decelerati<strong>on</strong> rates. A fricti<strong>on</strong> material from brakes, with nominal c<strong>on</strong>tact<br />
area of 254 mm², was subjected to sliding against a commercially available brake disc (gray cast ir<strong>on</strong>,<br />
diameter of 256 mm). Some technical details and adjustments from the designed tribometer are showed<br />
and the results from the experiments are discussed. A fricti<strong>on</strong> hysteresis has been observed for all<br />
experimental curves, which exhibit loops in elliptical shape. A negative slope has been encountered for the<br />
curves when the imposed frequency is 1 Hz and 2 Hz, while for the highest frequency (4 Hz) the slope is<br />
positive. The laboratory-scale tribometer, associated to the post-processing stage, is capable to<br />
successfully be used to characterize fricti<strong>on</strong> hysteresis effect.<br />
Keywords fricti<strong>on</strong>, tribometer, hysteresis<br />
1 INTRODUCTION<br />
In the last decades, demand for high-accuracy positi<strong>on</strong>ing and tracking systems has been c<strong>on</strong>siderably<br />
increased in the machining and assembly industry. Not accurate informati<strong>on</strong> about the fricti<strong>on</strong> behavior can<br />
severely deteriorate c<strong>on</strong>trol systems performance in the form of higher tracking errors, larger setting times,<br />
hunting and stick-slip phenomena [1]. Many parameters can influence the fricti<strong>on</strong>: material, surface<br />
roughness, apparent c<strong>on</strong>tact area, c<strong>on</strong>tact pressure, relative sliding velocity, ambient c<strong>on</strong>diti<strong>on</strong>s,<br />
mechanical system parameters and the accelerati<strong>on</strong>/decelerati<strong>on</strong> rate [2].<br />
The current paper addresses the influence of the last factor <strong>on</strong> the fricti<strong>on</strong> behavior of mating materials. A<br />
laboratory-scale tribometer has been modified in order to incorporate evaluati<strong>on</strong>s in different<br />
accelerati<strong>on</strong>/decelerati<strong>on</strong> rates of the slider against the disc. These modificati<strong>on</strong>s relate to changes in the<br />
c<strong>on</strong>trol program of the machine (in Simulink) and the development of a post-processing script in MatLab for<br />
analysis of the results.<br />
2 DYNAMIC CHARACTERIZATION OF FRICTION<br />
For fricti<strong>on</strong> dynamic characterizati<strong>on</strong>, as during the changes in sliding velocity, a linear reciprocating<br />
tribometer is used. Typically, this equipment c<strong>on</strong>sists of a linear actuator (electrical or pneumatic), a<br />
displacement sensor, a load cell and a compartment where the fricti<strong>on</strong> elements are installed (Figure 1).<br />
Figure 1. Linear Tribometer in Catholic University of Leuven [3]<br />
92<br />
Copyright © 2010 by Labo Soete
Day of Research 2010 – February 10 – Labo Soete, Ghent University, Belgium<br />
By means of a reciprocating tribometer is possible to simulate the geometry and moti<strong>on</strong>s experienced in<br />
many types of rubbing comp<strong>on</strong>ents whose normal operati<strong>on</strong> results in periodic reversals in the directi<strong>on</strong> of<br />
relative sliding. Fricti<strong>on</strong> coefficient is produced for forward and backward movements of the stroke. This<br />
equipment is very useful for studying static coefficient of fricti<strong>on</strong>, when the directi<strong>on</strong> changes [4]. In this type<br />
of machine, the maximum frequency is inversely proporti<strong>on</strong>al to the set stroke. According to a manufacturer<br />
[5], their reciprocating tribometer achieves frequency of 2 Hz for a maximum stroke of 35 mm. But for<br />
strokes lower than 2 mm, frequencies up to 120 Hz can be achievable by using such equipment.<br />
Figure 2 presents some typical results from linear reciprocating tribometer. In this graph, the large dots<br />
represent the steady-state fricti<strong>on</strong>-velocity curve and the fricti<strong>on</strong> hysteresis is shown by the loops a,b,c,d,<br />
and e, corresp<strong>on</strong>ding to the frequencies 0.1,0.25,0.5,1 and 5, respectively . Notice that in this graph the<br />
loops exhibit an elliptical shape for the fricti<strong>on</strong> hysteresis.<br />
Figure 2. Dynamic characterizati<strong>on</strong> of fricti<strong>on</strong> force [1]<br />
Other comm<strong>on</strong> shapes for the fricti<strong>on</strong> force vs. velocity curves (Figure 3) during fricti<strong>on</strong> hysteresis<br />
behaviour are known as loops clockwise and counter-clockwise loops [6].<br />
F<br />
F<br />
(a)<br />
V rel<br />
Fig. 3. Fricti<strong>on</strong> force-relative speed relati<strong>on</strong>s: (a) clockwise loops; (b) counter-clockwise loops (adapted<br />
from [6])<br />
(b)<br />
V rel<br />
According to the literature [1,2], fricti<strong>on</strong> hysteresis effect is associated with the instantaneous real c<strong>on</strong>tact<br />
area, which is not <strong>on</strong>ly a functi<strong>on</strong> of the instantaneous relative sliding velocity, but also of the time available<br />
for the system to adapt to the situati<strong>on</strong> corresp<strong>on</strong>ding to the actual sliding speed.<br />
3 EXPERIMENTAL APPARATUS<br />
Figure 4 shows the experimental apparatus used in the current research, where both the rotating and<br />
actuator systems of the tribometer are presented.<br />
93<br />
Copyright © 2010 by Labo Soete
Day of Research 2010 – February 10 – Labo Soete, Ghent University, Belgium<br />
Pneumatic<br />
actuator<br />
Sample<br />
Bearings<br />
Load<br />
cell<br />
Disc<br />
Shaft<br />
Torque<br />
transducer<br />
Motor<br />
Figure 4. Experimental apparatus: (a) photograph and (b) scheme of the tribometer<br />
The laboratory-scale tribometer (Fig. 4) has been designed to match the range of c<strong>on</strong>tact pressure and<br />
sliding speed as those in real car brakes, according to a previous study [7]. In this equipment, the sample<br />
has a small size in order to allow versatility during the tests and reduce the costs.<br />
Regarding to the load/actuator system, the tribometer can operate in two different modes:<br />
I) C<strong>on</strong>stant force mode: the normal force <strong>on</strong> the disc, which is d<strong>on</strong>e by means a pneumatic actuator, is kept<br />
c<strong>on</strong>stant over time during the tests. At the same time, the braking torque remains free to vary according to<br />
the changes in the coefficient of fricti<strong>on</strong>.<br />
II) C<strong>on</strong>stant torque mode: the braking torque is kept c<strong>on</strong>stant over time during the tests. This is d<strong>on</strong>e by a<br />
closed loop process that c<strong>on</strong>trols the applied force at each fracti<strong>on</strong> of a sec<strong>on</strong>d. A feedback from the<br />
current torque is performed by means of a torque transducer installed <strong>on</strong> the tribometer shaft.<br />
Regarding to the rotating system, the tribometer can operate in three modes:<br />
I) C<strong>on</strong>stant drag mode: rotati<strong>on</strong> speed of the disc is kept c<strong>on</strong>stant over time during the tests.<br />
II) Disc decelerati<strong>on</strong> mode: the rotati<strong>on</strong> speed of the disc decreases at a pre-set rate as the braking<br />
proceeds, similar to the braking process in cars and the tests performed <strong>on</strong> brake dynamometers.<br />
III) Wave mode: this opti<strong>on</strong> allow us to characterize fricti<strong>on</strong> dynamics, such as fricti<strong>on</strong> hysteresis in velocity.<br />
For doing that, a sine or squared wave signal for the velocity is imposed by the servomotor of the tribometer<br />
(Figure 5). Different accelerati<strong>on</strong> and decelerati<strong>on</strong> rates can be tested by altering the frequency of the<br />
imposed velocity.<br />
Rotati<strong>on</strong> [1/min]<br />
160<br />
140<br />
120<br />
100<br />
80<br />
60<br />
40<br />
20<br />
0<br />
0 0,5 1 1,5 2 2,5 3 3,5<br />
Time [s]<br />
Rotati<strong>on</strong> [1/min]<br />
250<br />
200<br />
150<br />
100<br />
50<br />
0<br />
0 0,5 1 1,5 2 2,5 3 3,5<br />
Time [s]<br />
(a)<br />
Figure 5 – Type of waves for the velocity in the wave mode: a) Sine wave; b) Squared wave.<br />
(b)<br />
Table 1 summarizes the general characteristics of the described machine, where the range of frequencies<br />
for the imposed velocity in the wave mode (0 to 4 Hz) is showed. These frequencies are valid between 0.1<br />
to 200 rpm and for a maximum load of 400 N. When using 4 Hz, a rotati<strong>on</strong> speed higher than 200 rpm or a<br />
load higher than 400 N may put the motor inverter in “over-torque limit” due to the high starting torque<br />
required from the servomotor.<br />
94<br />
Copyright © 2010 by Labo Soete
Day of Research 2010 – February 10 – Labo Soete, Ghent University, Belgium<br />
Table 1. General characteristics of the tribometer<br />
Normal load<br />
Motor power<br />
Sliding radius<br />
Rotating disc speed<br />
Disc diameter<br />
Frequency for the imposed velocity in<br />
the wave mode<br />
0 to 4200 N<br />
11 kW<br />
27 to 54 mm<br />
0 to 4500 rpm<br />
159 mm<br />
0 to 4 Hz<br />
4 SET UP OF THE TESTS<br />
4.1 Matlab script for post-processing<br />
Due to the high dynamic involved in the current tests, performed with wave mode, both hardware and<br />
software filters (type “pass-band”) have been removed. A calibrati<strong>on</strong> procedure has been previously d<strong>on</strong>e in<br />
order to determine the torque due to the inertia of the tribometer shaft during the accelerati<strong>on</strong>s and<br />
decelerati<strong>on</strong>s. These curves are used in a post-processing script, developed in MatLab. During postprocessing<br />
stage, the signal noises are filtered (Fig. 6-a) and the fricti<strong>on</strong> torque (net torque) is determined<br />
by subtracting the total torque, measured during the experiments, by the torque due to the inertia in the<br />
tribometer shaft (Fig. 6-b).<br />
Torque [Nm]<br />
6<br />
5<br />
4<br />
3<br />
2<br />
Unfiltered<br />
Filtered<br />
Torque [Nm]<br />
6<br />
5<br />
4<br />
3<br />
2<br />
Total torque<br />
Inertia torque<br />
Net torque<br />
1<br />
1<br />
0<br />
1.5 2 2.5 3 3.5<br />
Time [s]<br />
0<br />
1.5 2 2.5 3 3.5<br />
Time [s]<br />
(a)<br />
Figure 6. Post-processing the data: a) filtering the signal; b) determining the fricti<strong>on</strong> torque.<br />
(b)<br />
4.2 Samples preparati<strong>on</strong><br />
Table 2 shows the formulati<strong>on</strong> of the newly formulated sample used in this study. All the c<strong>on</strong>stituents were<br />
weighed using an analytical balance and mixed for 10 min by using a commercial blender.<br />
Table 2. Formulati<strong>on</strong> of the sample<br />
C<strong>on</strong>stituents C<strong>on</strong>tent in wt%<br />
Binder 43<br />
Metal 0.6<br />
Fricti<strong>on</strong> Modifiers 15<br />
Filler 17<br />
Fibers 20<br />
Others 4.4<br />
95<br />
Copyright © 2010 by Labo Soete
Day of Research 2010 – February 10 – Labo Soete, Ghent University, Belgium<br />
The final mixture was loaded into a cylindrical mold. Post-curing was carried out at a c<strong>on</strong>stant temperature<br />
of 180ºC by placing the samples in a preheated. This fricti<strong>on</strong> material is currently in development process to<br />
become a commercial brake pad for light vehicles by a manufacturer in Brazil.<br />
Sample was machined in a circular shape with nominal c<strong>on</strong>tact area of 254 mm² (Fig. 7). As counter<br />
surface, a commercially available brake disc (gray cast ir<strong>on</strong>, diameter of 256 mm, thickness of 6 mm) has<br />
been used.<br />
Figure 7 - Sample geometry.<br />
4.3 Operating Parameters<br />
In order to eliminate transient effects, such as running-in, a pre-run sliding of 1h durati<strong>on</strong> (c<strong>on</strong>stant load and<br />
speed of 150 N and 1.5 m/s, respectively) has been d<strong>on</strong>e prior the tests. Table 3 shows the operating<br />
c<strong>on</strong>diti<strong>on</strong>s used in each experiment, where a sine wave signal has been set for the imposed speed.<br />
Test<br />
Number<br />
Frequency<br />
[Hz]<br />
Table 3. Operating parameters<br />
Accelerati<strong>on</strong>/decelerati<strong>on</strong><br />
rate [mm/s²]<br />
Max speed<br />
[mm/s]<br />
Min speed<br />
[mm/s]<br />
1 1 100 50.4 (12 rpm) 4.2 (1 rpm)<br />
2 2 200 50.4 (12 rpm) 4.2 (1 rpm)<br />
3 4 400 50.4 (12 rpm) 4.2 (1 rpm)<br />
A normal c<strong>on</strong>stant load of 400 N was adjusted during all tests, resulting in a nominal pressure of 1,57 MPa,<br />
whose value is equivalent to a typical braking c<strong>on</strong>diti<strong>on</strong> that occur in light vehicles [7]. Data acquisiti<strong>on</strong><br />
sampling rate was set in 1 kHz and 10s of durati<strong>on</strong> for each test.<br />
5 EXPERIMENTAL RESULTS<br />
Figure 8 shows the fricti<strong>on</strong> hysteresis behaviour for the test number 1, corresp<strong>on</strong>ding to the frequency 1 Hz.<br />
A negative slope of -0.0012 has been encountered for this curve, where this parameter was determined by<br />
subtracting cof 2 by cof 1 , divided by the difference between the maximum and minimum rotati<strong>on</strong> (rpm).<br />
Coefficient of fricti<strong>on</strong> [-]<br />
0.215<br />
0.21<br />
0.205<br />
0.2<br />
0.195<br />
Cof 1<br />
Decelerati<strong>on</strong><br />
Slope=-0.0012<br />
Accelerati<strong>on</strong><br />
0.19<br />
0 2 4 6 8 10 12<br />
Rpm [1/min]<br />
Figure 8. Fricti<strong>on</strong> hysteresis for the test 1<br />
Cof 2<br />
96<br />
Copyright © 2010 by Labo Soete
Day of Research 2010 – February 10 – Labo Soete, Ghent University, Belgium<br />
Figure 9 shows the fricti<strong>on</strong> hysteresis curve for the test number 2, corresp<strong>on</strong>ding to the frequency 2 Hz.<br />
Comparing the slope of this curve to those from the test 1, not significant difference has been encountered.<br />
Coefficient of fricti<strong>on</strong> [-]<br />
0.215<br />
0.21<br />
0.205<br />
0.2<br />
Cof 1<br />
Slope=-0.0012<br />
Accelerati<strong>on</strong><br />
0.195 Decelerati<strong>on</strong><br />
Cof 2<br />
0.19<br />
0 2 4 6 8 10 12<br />
Rpm [1/min]<br />
Figure 9. Fricti<strong>on</strong> hysteresis for the test 2<br />
Figure 10 shows the fricti<strong>on</strong> hsyteresis curve for the test number 3, corresp<strong>on</strong>ding to the frequency 4 Hz.<br />
Unlike the previous results, a positive slope of +0.0011 has been encountered for this curve.<br />
Coefficient of fricti<strong>on</strong> [-]<br />
0.215<br />
0.21<br />
0.205<br />
0.2<br />
0.195<br />
0.19<br />
Accelerati<strong>on</strong><br />
Slope=+0.0004<br />
Cof 1<br />
Cof 2<br />
Decelerati<strong>on</strong><br />
0.185<br />
0 2 4 6 8 10 12<br />
Rpm [1/min]<br />
Figure 10. Fricti<strong>on</strong> hysteresis for the test 3<br />
All experimentally obtained curves (Figs. 10, 11 and 12) reveal an eliptical shape for the fricti<strong>on</strong> hysteresis.<br />
This behavior is similar to those found by [1], which were previously shown in the Fig. 2.<br />
Table 4 summarizes the experimental results for all tests. Notice that the curve slopes change the signal<br />
(negative to positive) <strong>on</strong>ly when the frequency is c<strong>on</strong>siderably increased, as in the test 3 (4 Hz). It seems<br />
that the influence of changes in accelerati<strong>on</strong>/decelerati<strong>on</strong> rates <strong>on</strong> the fricti<strong>on</strong> is str<strong>on</strong>gly n<strong>on</strong>-linear, since<br />
no significative differences in the curve slopes have been observed for the frequencies 1 Hz and 2 Hz, as<br />
during the tests 1 and 2, respectively.<br />
Table 4. Experimental results<br />
Test<br />
Number<br />
Cof 1 Cof 2 Slope<br />
1 0.206 0.193 -0.0012<br />
2 0.207 0.194 -0.0012<br />
3 0.195 0.199 0.0004<br />
A lower coefficient of fricti<strong>on</strong> has been encountered in the beginning of the sliding process (parameter Cof 1 )<br />
for the test 3. A possible explanati<strong>on</strong> for this phenomen<strong>on</strong> is found in the n<strong>on</strong>-uniform surface c<strong>on</strong>diti<strong>on</strong>s<br />
(mainly the surface roughness) of the cast ir<strong>on</strong> disc and also variati<strong>on</strong>s in local chemical compositi<strong>on</strong>,<br />
causing the fricti<strong>on</strong> to change during disc rotati<strong>on</strong>. In depth analysis of these effects will need further<br />
research effort that is bey<strong>on</strong>d the scope of the present study.<br />
6 CONCLUSIONS<br />
A fricti<strong>on</strong> hysteresis has been observed for all experimental curves, which exhibit loops in elliptical shape. A<br />
negative slope has been encountered for the curves when the imposed frequency is 1 Hz and 2 Hz. On the<br />
97<br />
Copyright © 2010 by Labo Soete
Day of Research 2010 – February 10 – Labo Soete, Ghent University, Belgium<br />
other hand, for the highest frequency (4 Hz) the slope is positive. This general behavior is similar to those<br />
published by [1].<br />
The laboratory-scale tribometer allow us to test a wide range of accelerati<strong>on</strong> and decelerati<strong>on</strong> rates. For<br />
this reas<strong>on</strong>, this equipment associated with the post-processing script currently developed, is capable to<br />
successfully be used to characterize fricti<strong>on</strong> hysteresis effect.<br />
7 NOMENCLATURE<br />
Cof 1 average of coefficient of fricti<strong>on</strong> in the minimum rotati<strong>on</strong> (1 rpm) -<br />
Cof 2 average of coefficient of fricti<strong>on</strong> in the maximum rotati<strong>on</strong> (12 rpm) -<br />
8 ACKNOWLEDGEMENTS<br />
Authors are grateful to Financial support of FWO project G022506 and Erasmus exchange program - Euro<br />
Brazilian Windows II.<br />
Special thanks also to J<strong>on</strong>as Giacomeli by the technical support supplied.<br />
9 REFERENCES<br />
[1] F. Al Bender; J. Swevers, Characterizati<strong>on</strong> of Fricti<strong>on</strong> Force Dynamics, IEE C<strong>on</strong>trol Systems Magazine,<br />
2008.<br />
[2] F. Van de Velde, P. De Baets, Comparis<strong>on</strong> of Two Stick-Slip Tester and Recommendati<strong>on</strong>s for<br />
Repeatable And Significant Stick-Slip Testing, Tribotest Journal 3-4, 1997.<br />
[3] F. Al-Bender, H. Van Brussel, T. Janssens, K. De Moerlooze, Experimental Characterizati<strong>on</strong> of Fricti<strong>on</strong>,<br />
Brochure about the facilities in the Faculty of Engineering in Katholieke Univesiteit Leuven, Belgium.<br />
[4] ASTM G133 - 05(2010), Standard Test Method for Linearly Reciprocating Ball-<strong>on</strong>-Flat Sliding Wear,<br />
2010<br />
[5] Nanovea tribometers, Company website. Available in : ,<br />
Access at 1<str<strong>on</strong>g>5th</str<strong>on</strong>g> of Dez 2010.<br />
[6] B.N.J. Pers<strong>on</strong>, Sliding fricti<strong>on</strong>: physical principles and applicati<strong>on</strong>s, Springer, Berlin. ISBN(1998) 3-540-<br />
63296-4.<br />
[7] M. B. Infantini, Variáveis de desempenho dos sistemas de freios. Master dissertati<strong>on</strong>, 96 pages.<br />
Federal University of Rio Grande do Sul, Brazil, 2008.<br />
98<br />
Copyright © 2010 by Labo Soete
Sustainable C<strong>on</strong>structi<strong>on</strong> and Design <str<strong>on</strong>g>2011</str<strong>on</strong>g><br />
DEVELOPING SMALL-AIRCRAFT SERVICE AND RE-CONSTRUCTION<br />
OF LANDING-GEAR LEG SUPPORT<br />
R. Lefánti, G. Kalácska, I. Oldal, K. Petróczki<br />
Faculty of Mechanical Engineering, Szent István University, Gödöllő, Hungary<br />
www.geti.gek.szie.hu<br />
Abstract<br />
The programs of air-operati<strong>on</strong> and service in the aviati<strong>on</strong> engineering - within this at light-aircraft too - take<br />
place according to rigorous regulati<strong>on</strong>s [6, 7]. There are such machine units and parts which regulati<strong>on</strong> are<br />
incomplete, for instance such is the landing-shaft seating. We have developed a new maintenance model<br />
based <strong>on</strong> the traditi<strong>on</strong>al <strong>on</strong>es, which offers new informati<strong>on</strong> exchange modul for e.g. weak point rec<strong>on</strong>structi<strong>on</strong><br />
and uses paper based documentati<strong>on</strong> and modern remote maintenance as well. Beside the<br />
new model we have worked out a renewing soluti<strong>on</strong> of the often failed landing-gear leg support applying<br />
field and laboratory test and FEM modelling to fill up as an engineering example for the informati<strong>on</strong> modul<br />
of the new maintenance model.<br />
Keywords: small-aircraft, re-c<strong>on</strong>structi<strong>on</strong>, FEM model<br />
1 INTRODUCTION<br />
The programs of air-operati<strong>on</strong> and service in the aviati<strong>on</strong> engineering - within this at light- aircraft too - take<br />
place according to rigorous regulati<strong>on</strong>s [6, 7]. Its reas<strong>on</strong> is to increase the safety of aviati<strong>on</strong> and the aircraft<br />
reliability. For the sake of these such operating and service programs have been worked out by both the<br />
manufacturer and the aviati<strong>on</strong> authority, and nevertheless the maintenance pers<strong>on</strong>nel of airworthiness that<br />
those programs to be suitable for the technical requirements and regulati<strong>on</strong>s alike. There are such machine<br />
units and parts which regulati<strong>on</strong> are incomplete, for instance such is the landing-shaft seating.<br />
This paper written from our research work reviews briefly the problem and analyses of the landing-shaft and<br />
its development.<br />
2 REPEATED BREAKDOWN<br />
As a practical problem the silent-bloc (elastic l<strong>on</strong>gitudinal-seating support) at the attachment of landingshaft<br />
in a Cessna 172-type aircraft manufactured in the years of 1970 broke down repeatedly, many times.<br />
The characteristically repeated breakdown allows to come to c<strong>on</strong>clusi<strong>on</strong> that this is <strong>on</strong>e blot (weak-point) of<br />
the aircraft. This aircraft is often used to train learner pilots generally taking place <strong>on</strong> grassy runway (the<br />
landings and take offs, however the quality of the grassy runway is not ideal in every event). These facts<br />
menti<strong>on</strong>ed c<strong>on</strong>tribute <strong>on</strong> a large scale to the breakdown of silent-bloc. The Cessna 172-type is put into<br />
circulati<strong>on</strong> with two c<strong>on</strong>structi<strong>on</strong> landing-shafts [1]. One type has got rectangular cross-secti<strong>on</strong>, of uniform<br />
strength part reminding of solid arched plate-spring. The other type has got circular ring cross-secti<strong>on</strong><br />
uniform strength part (tubular shaft). The breakdown menti<strong>on</strong>ed is characteristic to the latter type.<br />
In case of breakdown metallic c<strong>on</strong>tact can take place between the landing-shaft and the support (inasmuch<br />
the elastic element totally got ruined). In this case the depth of damage <strong>on</strong> the landing-shaft (for example<br />
scratch, knockout) can be at most 0.01 inch. If this happens the loading-shaft has to be replaced.<br />
The c<strong>on</strong>diti<strong>on</strong> menti<strong>on</strong>ed is very dangerous c<strong>on</strong>sidering the aviati<strong>on</strong> safety because the silent-bloc serving<br />
to support the landing-shaft and to elastic damping, does not perform its task so the degree amount of<br />
damping and support is not appropriate. It can happen such event that the breakdown is not recognized in<br />
time, so the stress in the material increases at certain parts of the landing gear and in the framework as the<br />
effect of operati<strong>on</strong> load changes. This situati<strong>on</strong> is extremely accidental.<br />
The deteriorati<strong>on</strong> of PUR-seating at Cessna 172-type means the blot (weak-point) to be repaired by<br />
rec<strong>on</strong>structi<strong>on</strong>. Signs referring to breakdown could be observed in the setting - in place, too (Figure 1.). The<br />
plastic between the outer steel-bush of silent-bloc and the landing-shaft almost crumbled away because of<br />
repeated load. Figure 2. shows the damaged part in disassembled positi<strong>on</strong>. It can be seen in the Figure 2.<br />
that the original PUR-seating totally deteriorated. The inner part of the PUR bush extenuated, cracked and<br />
the material protruded towards the outer flange of the silent-bloc, surely here it could freely deformed.<br />
99<br />
Copyright © <str<strong>on</strong>g>2011</str<strong>on</strong>g> by Laboratory Soete
Sustainable C<strong>on</strong>structi<strong>on</strong> and Design <str<strong>on</strong>g>2011</str<strong>on</strong>g><br />
Figure 1. The damaged machine element<br />
installed positi<strong>on</strong><br />
3 THE SERVICE INSTRUCTION AND ITS LACK, OBJECTS.<br />
Figure 2. The damaged machine element in<br />
disassembled positi<strong>on</strong><br />
The outer support has to be checked at Cessna 150-type after each 1000 hour or every 3 year, at 172-<br />
types after each 1000 hour but <strong>on</strong>ly at plate spring c<strong>on</strong>structi<strong>on</strong>s c<strong>on</strong>cerning the landing-shaft. The<br />
manufacturer doesn’t take measures in no kind of instructi<strong>on</strong>s c<strong>on</strong>cerning the service of elastic support<br />
(seating) in case of pipe cross-secti<strong>on</strong> landing-shaft [1]. The landing-shaft seating susceptible to breakdown<br />
means risk from aviati<strong>on</strong> safety standpoint. The questi<strong>on</strong> can be raised with good reas<strong>on</strong> whether the blot<br />
(weak point) can be replaced with soluti<strong>on</strong> c<strong>on</strong>taining new, up-to-date materials, where the operati<strong>on</strong> load<br />
doesn’t result returning breakdown.<br />
Objects:<br />
- To propose replacing the original PUR material with elastic seating by other plastic or by plastic<br />
mating.<br />
- Further aim is to determine that characteristic load and limit based <strong>on</strong> which it is necessary<br />
checking the machine-element given, independently that just in which period is the aircraft service.<br />
It reaching the value determined it is proposed to supervise the machine-element, maybe its<br />
replacement. By this characteristic parameter the incomplete service instructi<strong>on</strong> can be completed.<br />
4 RECONSTRUCTION EXAMINATION OF LANDING-GEAR LEG SEATING<br />
Figure 3. shows the process of the complex testing and evaluating of the machine-element deteriorated.<br />
We have marked the main activity points in the Figure. These are:<br />
- Determining the material models;<br />
- Measuring the load in real c<strong>on</strong>diti<strong>on</strong>s;<br />
- Preparing the mechanical finite-element analysis;<br />
- To carry out rapid fatigue-wear tests in laboratory c<strong>on</strong>diti<strong>on</strong>s;<br />
- Preparing the mechanical finite-element analysis;<br />
- Evaluating the results.<br />
Figure 3. Complex testing, evaluating system<br />
100<br />
Copyright © <str<strong>on</strong>g>2011</str<strong>on</strong>g> by Laboratory Soete
Sustainable C<strong>on</strong>structi<strong>on</strong> and Design <str<strong>on</strong>g>2011</str<strong>on</strong>g><br />
4.1 Determining original material and material desired for tests.<br />
The elastic seating material resulting manifold breakdowns corresp<strong>on</strong>ds in mechanical properties to the<br />
cast polyurethane basic material presently into circulati<strong>on</strong> as PUM 70A symbol.<br />
C<strong>on</strong>sidering that the PUM 70A-type basic material characteristic breakdown is the fatigue and the wear<br />
because of this the PUM 60A and PUA 90A basic materials have been chosen as replacing materials<br />
having near similar elastic but better fatigue and wear and tribological properties.<br />
To determine the mechanical and strength properties of the materials tested are needed to carry out further<br />
tests. Because of these hardness, tensile - and compressi<strong>on</strong> tests were carried out <strong>on</strong> these basic<br />
materials. The results and evaluati<strong>on</strong> of the tests gave the input parameter of the FE - analysis.<br />
4.2 System suitable for measuring the real load.<br />
It is very complex task to measure the loads befalling to the aircraft to the landing-shaft and from this to the<br />
silent-bloc. Several procedures are widely used in practice to measure the stresses and strains in a<br />
c<strong>on</strong>structi<strong>on</strong> [2, 4].<br />
We have developed and made a measuring-system capable to measure accelerati<strong>on</strong>/vibrati<strong>on</strong>-accelerati<strong>on</strong><br />
determining the load befalling to the certain machine-element (Figure 4.).<br />
Electric source<br />
12 V<br />
12 V / 230 V<br />
c<strong>on</strong>verter<br />
Spider 8-type measuring amplifier<br />
Computer<br />
Accelerati<strong>on</strong> sensor fixed <strong>on</strong> the<br />
left landing-shaft<br />
Accelerati<strong>on</strong> sensor fixed <strong>on</strong> the<br />
right landing-shaft<br />
Accelerati<strong>on</strong> sensor fixed in the<br />
cabin<br />
Figure 4. Sketch of the measuring-system suitable measuring accelerati<strong>on</strong>s arising in the<br />
light-aircraft<br />
We have got permissi<strong>on</strong> and technical assistance after c<strong>on</strong>sulting with the operator to fix the accelerati<strong>on</strong><br />
sensors <strong>on</strong> the aircraft as well as the appliances needed to carry out the measurings.<br />
On the spot of measurings the airport has got c<strong>on</strong>crete cover and grassy fields can be found. Five-five<br />
landings and take offs were made <strong>on</strong> the c<strong>on</strong>crete cover and grassy fields. The flights took place according<br />
to the regulati<strong>on</strong>s required by aviati<strong>on</strong> authority and by the operati<strong>on</strong>al instructi<strong>on</strong>s of the light aircraft.<br />
4.2.1 Evaluating the accelerati<strong>on</strong> results<br />
From the accelerati<strong>on</strong> results measured in the framework and in the landing-shafts the results measured in<br />
the framework were used in further examinati<strong>on</strong>s and use for mechanical modelling. The reas<strong>on</strong> of this is<br />
that to complete the mechanical model later the c<strong>on</strong>necti<strong>on</strong> between the landing-shaft and the silent-bloc is<br />
not rigid surely the landing-shaft has got elasticity/damping by which the model to be prepared should be<br />
enlarged. This would make more difficult to complete the model as the elasticity/damping of the landingshaft<br />
is unknown. Because of this we disregarded the results measured <strong>on</strong> the landing-shaft. The<br />
c<strong>on</strong>necti<strong>on</strong> between the framework and the outer bush of the silent-bloc is rigid and the sensor in the cabin<br />
was fixed at such place (real seat frame) which has got proper rigid c<strong>on</strong>tact with the framework.<br />
Am<strong>on</strong>g the measuring directi<strong>on</strong>s at the vertical „z” directi<strong>on</strong> it could be unambiguously separated the<br />
various characteristic aer<strong>on</strong>autic c<strong>on</strong>diti<strong>on</strong>s.<br />
That six secti<strong>on</strong>s can be seen in Figure 5. which can be separated during measuring and flight.<br />
The names of certain secti<strong>on</strong>s:<br />
I. Landing process, in the air;<br />
II. Moment of landing;<br />
III. Secti<strong>on</strong> of decelerating taxiing <strong>on</strong> the field;<br />
IV. Secti<strong>on</strong> of accelerating taxiing <strong>on</strong> the field;<br />
101<br />
Copyright © <str<strong>on</strong>g>2011</str<strong>on</strong>g> by Laboratory Soete
Sustainable C<strong>on</strong>structi<strong>on</strong> and Design <str<strong>on</strong>g>2011</str<strong>on</strong>g><br />
V. Secti<strong>on</strong> after the moment of take off;<br />
VI. Take off process in the air.<br />
The examinati<strong>on</strong> of secti<strong>on</strong>s after these happened separately. We used Fourier transformati<strong>on</strong> (FFT)<br />
examining the secti<strong>on</strong>s. Is a results of FFT we got vibrati<strong>on</strong> accelerati<strong>on</strong>-frequency values from the<br />
vibrati<strong>on</strong> accelerati<strong>on</strong>-time functi<strong>on</strong>s [5].<br />
This guaranteed for us that we could determined the repetiti<strong>on</strong> member (frequency) of load bel<strong>on</strong>ging to the<br />
characteristic accelerati<strong>on</strong> values. An example pricked out of Fourier transformati<strong>on</strong> can be seen in Figure<br />
6. The characteristic accelerati<strong>on</strong> values are marked in the Figure so, as an exposed value (A), as well as a<br />
characteristic secti<strong>on</strong> (B).<br />
14<br />
12<br />
10<br />
8<br />
Vibrati<strong>on</strong>-accelerati<strong>on</strong> in „z” directi<strong>on</strong> measured in the cabin<br />
Belső z irányítottságú gyorsulás<br />
d<br />
I. II. III. IV. V. VI.<br />
a [gyorsulás] [m/s 2 ]<br />
6<br />
4<br />
2<br />
0<br />
0<br />
-2<br />
5 10 15 20 25 30<br />
-4<br />
-6<br />
-8<br />
Time, t [idő] [s] t [s]<br />
Figure 5. Characteristic secti<strong>on</strong>s of vibrati<strong>on</strong>-accelerati<strong>on</strong> in „z” directi<strong>on</strong> in the functi<strong>on</strong> of<br />
time measured in the cabin<br />
Vibrati<strong>on</strong>-accelerati<strong>on</strong>, Rezgésgyorsulás, a a [m/s 2 ]<br />
2 ] Rezgésgyorsulás, Vibrati<strong>on</strong>-accelerati<strong>on</strong>, a [m/s a 2 [m/s ]<br />
2 ]<br />
10<br />
0<br />
-10<br />
0 2 4 6 8 10<br />
Idő, t [s]<br />
1.5<br />
1<br />
0.5<br />
0<br />
0 5 10 15 20 25 30 35 40 45 50<br />
Frekvencia, f [Hz]<br />
Figure 6. Time-functi<strong>on</strong> of accelerati<strong>on</strong> measured in the aircraft and FFT frequency<br />
spectrum, in the secti<strong>on</strong> of decelerating taxiing <strong>on</strong> the field, „z” directi<strong>on</strong><br />
It can be stated by knowing the results that the breakdown of the silent-bloc then happens so<strong>on</strong>er if the<br />
load is accompanied with much higher repetiti<strong>on</strong> number.<br />
Knowing this it can be established that fact the critical secti<strong>on</strong>s c<strong>on</strong>sidering the silent-bloc are the<br />
decelerating/accelerating taxiing <strong>on</strong> the ground (III., IV. secti<strong>on</strong>) and not the moments of landing as well as<br />
take off. The characteristic values of accelerati<strong>on</strong> and frequency of decelerating/accelerating taxiing <strong>on</strong> the<br />
ground had to be applied for the further examinati<strong>on</strong>s.<br />
102<br />
Copyright © <str<strong>on</strong>g>2011</str<strong>on</strong>g> by Laboratory Soete
Sustainable C<strong>on</strong>structi<strong>on</strong> and Design <str<strong>on</strong>g>2011</str<strong>on</strong>g><br />
4.3 Mechanical examinati<strong>on</strong> of the landing-shaft with simulati<strong>on</strong><br />
The measurings with real time carried out <strong>on</strong> the aircraft and their results as well as the results of material<br />
testing give due base to carry out mechanical simulati<strong>on</strong> examinati<strong>on</strong>s (Finite-element method, FEM) <strong>on</strong><br />
the landing-shaft silent-block unit. The aircraft industry is am<strong>on</strong>g those domains applying FEM in practice<br />
[3]. We have used the Ansys Workbench 11 program for the FEM simulati<strong>on</strong>. Some steps of using the<br />
program are shown in Figure 7. and 8.<br />
Figure 7. The geometric model<br />
Figure 8. Making the mesh for the model<br />
During the program we have completed the real model of the landing-shaft and silent-bloc. Am<strong>on</strong>g the<br />
parameters to be set for the run of the simulati<strong>on</strong> the various material properties and the accelerati<strong>on</strong><br />
values in different directi<strong>on</strong>s measured occurred.<br />
By executing the simulati<strong>on</strong> we determined the reduced stress arisen in the plastic bush of the silent-bloc<br />
as well as the magnitude of deformati<strong>on</strong>s.<br />
The characteristics determined appeared as input parameters at the laboratory rapid fatigue test.<br />
4.4 Laboratory fatigue test<br />
We have made an equipment for laboratory fatigue test capable to clamp a small- scale specimen to model<br />
the ruin of the silent-block. The c<strong>on</strong>structi<strong>on</strong> and form of the equipment had to be capable carrying out rapid<br />
fatigue tests with c<strong>on</strong>structi<strong>on</strong> materials in a reproducing system that the load should be suit the<br />
experiences at real measurings respectively with the FET calculati<strong>on</strong>s.<br />
The DIN 50322 standard gave the basis of the test, within we took the 6. testing category into<br />
c<strong>on</strong>siderati<strong>on</strong>, namely the model test with specimens having simple shape.<br />
The directi<strong>on</strong>s of strain and load agrees with each other at real c<strong>on</strong>structi<strong>on</strong>. The directi<strong>on</strong> of strain and<br />
load however is perpendicular at the laboratory fatigue-test equipment. This doesn’t disturb the laboratory<br />
comparing tests, the reproducing capability - as a characteristic of 6. category -. The amount of the fatigue<br />
work introduced into the specimens and the other load parameters can be c<strong>on</strong>trolled.<br />
The theory of fatigue test was given by the “Locati” rapid fatigue test applied for steels. During the test the<br />
material to be fatigued is exposed to 10 5 repeated load at each increasing load level. During these loads<br />
the material tested is ruined [8].<br />
The fatigue test applied by us differs from the previously menti<strong>on</strong>ed that we adapted the test theory to high<br />
elasticity elastomer.<br />
The fatigue of the specimen to be tested is carried out with a carriage making straight line reciprocating<br />
moti<strong>on</strong>, <strong>on</strong> the other hand the specimen is pressed by a load vertically to steel base plate (Figure 9.). This<br />
is a complex mechanical and tribological fatigue where the c<strong>on</strong>tact surfaces also deform and also rub<br />
(stick) as in the real landing-shaft seating.<br />
Figure 9. The specimen loads<br />
The equipment built and its parts can be seen in Figure 10. The equipment was suitable to carry out the<br />
needed rapid fatigue tests.<br />
103<br />
Copyright © <str<strong>on</strong>g>2011</str<strong>on</strong>g> by Laboratory Soete
Sustainable C<strong>on</strong>structi<strong>on</strong> and Design <str<strong>on</strong>g>2011</str<strong>on</strong>g><br />
Figure 10. Equipment for fatigue-tribological tests<br />
The results got form real time measurings carried out <strong>on</strong> the aircraft as well as got from FET-simulati<strong>on</strong><br />
gave the parameters to be set during fatigue tests <strong>on</strong> the equipment for fatigue test These are:<br />
- The amplitude of the counterpart (10) movement with the help of eccentric (3);<br />
- The frequency of the counterpart (10) movement with the help of the electric motor (1) and with the<br />
frequency c<strong>on</strong>verter (2);<br />
- Vertical load with the help of loading weights (13);<br />
- The length of unloaded overhang of the specimen from the specimen clamping fixture (11).<br />
It could be established form the evaluati<strong>on</strong> after carrying out laboratory measurings that in case of materials<br />
tested the functi<strong>on</strong>al reliability is the most favourable at PUA 90A. This is followed by PUM 70A then by<br />
PUM 60A.<br />
4.5 C<strong>on</strong>necti<strong>on</strong> of the measuring results and of the real load repetiti<strong>on</strong> number (cycle- number)<br />
During laboratory fatigue tests also bending and shear stress develop <strong>on</strong> the specimen beside vertical<br />
directi<strong>on</strong> normal force because of this reduced stress has to be taken into c<strong>on</strong>siderati<strong>on</strong> as a defined<br />
characteristic. It has to be determined the reduced stress in the specimen at load level given to decide the<br />
fatigue characteristic from measuring results of the silent-block elastic seating manufactured from the<br />
material tested. To determine this we have carried out mechanical modelling (FET).<br />
After finishing the mechanical model we have determined fundamentally that:<br />
- Bending and shear develop in the specimen beside compressi<strong>on</strong>.<br />
- The σ red value is multiple of the value calculated from compressi<strong>on</strong> at given load level and<br />
overhang length because of complex stress of the specimen. The fatigue test took place thus<br />
substantially at higher stress level comparing to operati<strong>on</strong> c<strong>on</strong>diti<strong>on</strong>.<br />
We have obtained the following result using the results of real time aircraft measurings, the results of<br />
laboratory rapid fatigue tests furthermore the results of mechanical modelling (FET) of laboratory fatigue<br />
test:<br />
- The elastic seating made of PUM 60A type plastic will be ruined probably at 2980 landings and<br />
take offs calculating with 20% factor of safety expecting 3727 take offs. The suspensi<strong>on</strong> of the<br />
landing-shaft and itself the silent-bloc have to be examined at reaching the limit number determined<br />
whether the breakdown started or ensued.<br />
- The machine part original material corresp<strong>on</strong>ds to the PUM 70A commercial product. During our<br />
tests we established that with PUM 70A material higher service life and fatigue number of cycles<br />
can be reached than with PUM 60A- material. The basic material according to our tests is further<br />
suitable fulfilling its task, too. The results of fatigue-abrasi<strong>on</strong> tests however come to the c<strong>on</strong>clusi<strong>on</strong><br />
104<br />
Copyright © <str<strong>on</strong>g>2011</str<strong>on</strong>g> by Laboratory Soete
Sustainable C<strong>on</strong>structi<strong>on</strong> and Design <str<strong>on</strong>g>2011</str<strong>on</strong>g><br />
that the elastic secti<strong>on</strong> of bed endures undoubtedly 2980 landings and take offs. At reaching the<br />
silent-bloc has to be checked whether the breakdown ensued or began. By this proposal such<br />
aggravati<strong>on</strong> comes to the new service system which increases the safety. Further more the<br />
deficiency of the plant service instructi<strong>on</strong> can be supplied with this informati<strong>on</strong>.<br />
- The PUA 90A material is also suitable for the part as basic material. The results come to the<br />
c<strong>on</strong>clusi<strong>on</strong> that still greater improvement (higher service-life) can be reached than with PUM 70A<br />
material.<br />
5 CONCLUSIONS<br />
Summing up it can be established that we have created a complex measuring and evaluating system<br />
destined for executing rec<strong>on</strong>structi<strong>on</strong> planning of a real c<strong>on</strong>structi<strong>on</strong>. As a result of our research work we<br />
have determined a limit number suitable to give a reliability limit c<strong>on</strong>cerning the elastic seating of the<br />
landing-shaft (at a certain c<strong>on</strong>structi<strong>on</strong>al c<strong>on</strong>diti<strong>on</strong>) of the aircraft-type. We have hopes of helping the more<br />
safety aircraft operati<strong>on</strong> with this completed rec<strong>on</strong>structi<strong>on</strong>al planning and with the complex evaluating<br />
process.<br />
6 REFERENCES<br />
[1] Cessna 172 Series Service Manuals & Parts Catalogs: DVD kiadvány, 2010.<br />
[2] Dömötör F.: A rezgésdiagnosztika elemei. Budaörs: SKF Svéd Golyóscsapágy Rt., 1996.<br />
[3] Fodor T. - Orbán F. - Sajtos I.: Végeselem - módszer. Elmélet és alkalmazás. Budapest: Szaktudás<br />
Kiadó Ház, 2005.<br />
[4] Janik J.: Gépüzemfenntartás. Dunaújváros: Dunaújvárosi Főiskolai Kiadó, 2001.<br />
[5] Nagy I.: Állapotfüggő Karbantartás, Műszaki Diagnosztika I., Rezgésdiagnosztika. Paks: Delta-3N Kft.,<br />
2006.<br />
[6] Decree (2003): 2042/2003/EK.<br />
[7] Decree (2008): 859/2008/EK.<br />
[8] Veress E.: Technológiai anyagvizsgálati módszerek. Magyar nyelvű szakelőadások a 2000 - 2001-es<br />
tanévben, Babeş-Bolyai Tudományegyetem Vegyészmérnöki Kar. Románia, Kolozsvár: Erdélyi Magyar<br />
Műszaki Tudományos Társaság, 2001.<br />
105<br />
Copyright © <str<strong>on</strong>g>2011</str<strong>on</strong>g> by Laboratory Soete
Sustainable C<strong>on</strong>structi<strong>on</strong> and Design <str<strong>on</strong>g>2011</str<strong>on</strong>g><br />
MACHINABILITY OF ENGINEERING POLYMERS<br />
R. Keresztes, G. Kalácska, L. Zsidai, Z. Dobrocsi<br />
Institute for Mechanical Engineering Technology,<br />
Faculty of Mechanical Engineering, Szent István University, Gödöllő, Hungary<br />
www.geti.gek.szie.hu<br />
Abstract Nowadays parts made of up-to-date engineering plastics are used more and more in mechanical<br />
engineering practice. These machine-elements are produced most frequently by injecti<strong>on</strong> molding or by <strong>on</strong>e<br />
cutting process. The injecti<strong>on</strong> molding technology are used generally for great number of pieces, in case of<br />
serial producti<strong>on</strong> while cutting processes are preferred to piece (unit) or smaller number producti<strong>on</strong>.<br />
We used lathe and measured the main- and feeding-directi<strong>on</strong>al cutting force at different engineering<br />
polymers (cast PA6, POM C and UHMW PE, HD 1000). We compared these results with the tensile<br />
properties of the materials. The analysis made can be well used in practice.<br />
Keywords: turning force comp<strong>on</strong>ents, lathe, force measuring, main cutting force, tensile stress,<br />
1 INTRODUCTION<br />
Am<strong>on</strong>g cutting processes the turning takes place often. During turning engineering plastics many problems<br />
can arise. Am<strong>on</strong>g these <strong>on</strong>e is the splint (c<strong>on</strong>tinuous chip) forming which can cause accident and can<br />
cause failure maybe the total ruin, fracture of the cutting tool. Because of this it is important to set the<br />
proper cutting parameters by which it is possible forming elemental or transiti<strong>on</strong>al (easily fracture) chip, too.<br />
It is also important to know during cutting the amount of the main cutting force. Knowing this the load of<br />
cutting tool can be made more c<strong>on</strong>stant as well as the remnant stress in the material chipped can be<br />
reduced to minimum in case of proper cutting parameters. The tensile properties of the materials is also<br />
important and we analysed the tensile stress – strain curves of the polymers. We plotted the quotient of the<br />
specific cutting resistance and the yield stress in the functi<strong>on</strong> of the chip cross secti<strong>on</strong> with the all<br />
machining parameter groups.<br />
2 TESTING METHODS, INSTRUMENTS<br />
The cutting is a machining method during which the required shape of the workpiece is formed by removing<br />
the surplus material layer in smaller – bigger particles (chip) with a suitable tool. Relative displacement is<br />
needed between the tool and workpiece for chip removal, for cutting movement. We measured the tensile<br />
properties of the materials.<br />
2.1 Equipment used for tests<br />
The CNC-lathe, type EMCO COMPACT 5, was used for tests. The equipment can be found in the<br />
laboratory of Institute for Mechanical Engineering Technology its programming takes place of G-codes. The<br />
photograph of the workpiece clamped as well as the shank with strain-gauges clamped into tool-box and<br />
the turning tool can be seen in Figure 1.<br />
Figure 1. The lathe and the workpiece clamped<br />
106<br />
Copyright © <str<strong>on</strong>g>2011</str<strong>on</strong>g> by Laboratory Soete
Sustainable C<strong>on</strong>structi<strong>on</strong> and Design <str<strong>on</strong>g>2011</str<strong>on</strong>g><br />
The tool clamping structure used for measuring the forces can be seen in Figure 2. The first secti<strong>on</strong> of the<br />
Figure shows the 3D-model.<br />
Figure 2. The force measuring shank model and its real picture<br />
2-2 pcs. strain gauges are fixed at every side. Coupling the strain gauges into total (full) – bridge those is a<br />
possibility measuring the forces arising in two directi<strong>on</strong>s. To measure the main cutting force F v (tangential)<br />
arising from the movement in vertical plane of the tool and F f feeding (axial) force arising from the<br />
movement in horiz<strong>on</strong>tal plane. A sec<strong>on</strong>d tool-box is fixed to 4 pcs. threaded holes <strong>on</strong> the measuring-shank<br />
into which the real cutting tool is fixed. The strain gauges measure the tangential (lower – upper) and the<br />
feeding (right side – left side) forces c<strong>on</strong>nect to a Spider-8 type measuring amplifier though wires, which<br />
amplifier c<strong>on</strong>vert the analogous signals into digital than transmits to the computer. With the help of Catman<br />
3.1 program data measured can be seen. The frequency of measuring and data collecting is 25 Hz.<br />
We measured the tensile properties of the materials according to MSZ EN ISO 527 standard with a type of<br />
INSTRON 5581 tensile machine and we prepared the tensile stress – deformati<strong>on</strong> curves of the polymers.<br />
From these diagrams we determined the yield stresses of the materials.<br />
The figure (Fig. 3) shows the tensile machine.<br />
2.2 Materials tested<br />
Figure 3. The tensile machine and the workpiece clamped<br />
The materials tested are those polymer basic types that are often used in engineering practice to<br />
manufacture machine-elements. Table 1 shows the name of product, the whole name and the marks<br />
accruing <strong>on</strong> lather diagrams. The specimens prepared for cutting are shown the first part of Figure 4 and<br />
the tensile specimens are shown the sec<strong>on</strong>d part.<br />
Table 1. Name and mark of plastics<br />
Serial Product name [6] Whole name Own mark<br />
number<br />
1. DOCAMID 6G H<br />
Cast polyamide 6,<br />
(Magnesium)<br />
PA 6G Mg<br />
2. DOCAMID 6G Cast polyamide 6, (Natrium) PA 6G Na<br />
3. DOCACETAL C Polyoximethylene / Polyacetal POM C<br />
4. DOCALENE UHMW – Polyethylene HD 1000<br />
107<br />
Copyright © <str<strong>on</strong>g>2011</str<strong>on</strong>g> by Laboratory Soete
Sustainable C<strong>on</strong>structi<strong>on</strong> and Design <str<strong>on</strong>g>2011</str<strong>on</strong>g><br />
1 2 3 4<br />
1 2 3 4<br />
Figure 4. Specimens prepared for machinig and for tensile tests<br />
In the Table 2. the more important properties of polymers tested can be seen summarized.<br />
Polyme<br />
r<br />
PA 6G<br />
Na<br />
PA 6G<br />
Mg<br />
Strength<br />
[MPa]<br />
Toughnes<br />
s<br />
(Charpy)<br />
[kJ/m 2 ]<br />
Table 2. More important properties of plastics<br />
Sliding<br />
characteristi<br />
c<br />
(μ)<br />
Thermoduricity<br />
[°C]<br />
77 - 110 112 0,15 - 0,5 -40 - 140<br />
77 - 110 112 0,15 - 0,5 -40 - 140<br />
POM C 70 – 80 8 0,25 – 0,45 5 – 120<br />
HD<br />
1000<br />
20 – 24 no fracture 0,2 – 0,3 -80 – 110<br />
Cutting parameters<br />
Feeding/rev.: f = 0.025, 0.05, 0.1, 0.2 mm/rev.<br />
Depth of cut: a = 0.1, 0.25, 0.5, 1, 2 mm<br />
Cutting speed: v = 50, 100, 200<br />
m/min<br />
Tensiling parameters<br />
Speed: v = 50 mm/min<br />
Humidity: RH = 50 %<br />
Temperature: T = 23 °C<br />
Hardness<br />
Rockwell<br />
85 – 98<br />
HRC<br />
Rockwell<br />
85 – 98<br />
HRC<br />
Rockwell<br />
86 – 90<br />
HRC<br />
Shore<br />
60 – 65 D<br />
Density<br />
[kg/dm 3 ]<br />
1,15 – 1,6<br />
1,15 – 1,6<br />
1,4<br />
0,96<br />
2.3 Forming of the cutting tool<br />
The cutting angles of high-speed steel (HSS Co5) turning tool have been determined <strong>on</strong> the basis of<br />
technical tables. The relief angle: α 0 = 10˚, the rake angle: γ 0 = 5˚. The grinding of turning tool was carried<br />
out <strong>on</strong> profile-grinding machine using diam<strong>on</strong>d grinding wheel. The ready made turning tool can be seen in<br />
Figure 5.<br />
108<br />
Copyright © <str<strong>on</strong>g>2011</str<strong>on</strong>g> by Laboratory Soete
Sustainable C<strong>on</strong>structi<strong>on</strong> and Design <str<strong>on</strong>g>2011</str<strong>on</strong>g><br />
rake angle (γ)<br />
relief angle (α)<br />
3 TEST RESULTS AND THEIR EVALUATIONS<br />
Figure 5. The bit of turning tool used.<br />
We have measured two-way forces during tests. The tangential-directi<strong>on</strong>al main cutting force and the axial<br />
feeding-directi<strong>on</strong>al force. We have grouped the materials by depth of cut, by feeding within <strong>on</strong> these by<br />
cutting speed. Unite these in <strong>on</strong>e file we have got four series main cutting force and the same series<br />
feeding-directi<strong>on</strong>al cutting force diagrams. We have made <strong>on</strong>e-<strong>on</strong>e diagram by parameter from these.<br />
Figure 6. and 7. show <strong>on</strong>e-<strong>on</strong>e sample diagram. The cutting force given (main or feeding directi<strong>on</strong>al) as<br />
well as the feeding (f[mm/rev.]), depth of cut (a[mm]) and the cutting speed (v[m/min.]) appear in the<br />
diagram title. The force values [N] given appear <strong>on</strong> the vertical axis, the cutting time [s] appears <strong>on</strong> the<br />
horiz<strong>on</strong>tal axis. We have presented all four materials in <strong>on</strong>e diagram, so it can be well comparing that at<br />
same cutting parameters how great force befalls <strong>on</strong>to the cutting tool at various materials. Each colour<br />
marks <strong>on</strong>e material according to mark explanati<strong>on</strong> under the diagram. C<strong>on</strong>tinuous line shows the test<br />
results. The dotted line shows the average during measuring time given. Its value can be seen beside the<br />
line.<br />
8<br />
Main cutting force diagrams measured<br />
( f = 0,1 mm/rev; a = 0,1 mm; v = 50 m/min )<br />
Main cutting force [N]<br />
7<br />
6<br />
5<br />
4<br />
3<br />
2<br />
PA 6G Mg average;<br />
5,38<br />
PA 6G Na average;<br />
4,26<br />
POM C average;<br />
3,02<br />
1<br />
0<br />
HD 1000 average;<br />
1,46<br />
0 1 2 3 4 5 6 7<br />
cutting time [s]<br />
PA 6G Na POM C HD 1000 PA 6G M g<br />
Figure 6. Main cutting force value at materials tested at cutting parameters given.<br />
109<br />
Copyright © <str<strong>on</strong>g>2011</str<strong>on</strong>g> by Laboratory Soete
Sustainable C<strong>on</strong>structi<strong>on</strong> and Design <str<strong>on</strong>g>2011</str<strong>on</strong>g><br />
4<br />
Feeding-directi<strong>on</strong>al cutting force diagrams measured<br />
( f = 0,1 mm/rev; a = 0,1 mm; v = 50 m/min )<br />
Feeding-directi<strong>on</strong>al cutting force<br />
[N]<br />
3<br />
2<br />
1<br />
PA 6G Na average;<br />
2,98<br />
PA 6G Mg average;<br />
1,75<br />
POM C average;<br />
0,76<br />
HD 1000 average;<br />
0,19<br />
0<br />
0 1 2 3 4 5 6 7<br />
cutting time [s]<br />
PA 6G Na POM C HD 1000 PA 6G M g<br />
Figure 7. Feeding-directi<strong>on</strong>al cutting force at materials tested at parameters given.<br />
As each workpiece tested had the same directi<strong>on</strong>s the measuring time period was c<strong>on</strong>tinuously changing<br />
because of various feeding and cutting speed values. Therefore we have 7 s –time taken into account at<br />
most measuring. In case of certain cutting parameters this value could not be reached, therefore at these<br />
parameters the cutting time was reduced to 4 at <strong>on</strong>e case 2 s respectively. The next diagram we have<br />
presented the main –and feeding- directi<strong>on</strong>al cutting forces in the functi<strong>on</strong> of depth of cut and of feeding<br />
from average values bel<strong>on</strong>ging to parameters given according to the following sample (Figure 8). Similar<br />
evaluati<strong>on</strong>s were d<strong>on</strong>e for each material types.<br />
Main<br />
cutting<br />
force [N]<br />
PA 6G Mg v = 50 m/min<br />
Main<br />
cutting<br />
force [N]<br />
PA 6G Mg v = 200 m/min<br />
80,00<br />
70,00<br />
60,00<br />
50,00<br />
40,00<br />
30,00<br />
20,00<br />
10,00<br />
0,00<br />
0,1<br />
0,1<br />
0,2<br />
70,00<br />
60,00<br />
50,00<br />
40,00<br />
30,00<br />
20,00<br />
10,00<br />
0,00<br />
0,1<br />
0,1<br />
0,2<br />
0,25<br />
0,5<br />
1<br />
Depth of cut [mm]<br />
2<br />
0,025<br />
0,05<br />
Feeding<br />
[mm/rev]<br />
0,25<br />
0,5<br />
1<br />
0,025<br />
Depth of cut [mm]<br />
2<br />
0,05<br />
Feeding<br />
[mm/rev]<br />
Figure 8. The value of main cutting force in the functi<strong>on</strong> of depth of cut and of feeding, PA 6G Mg<br />
3.1 Specific cutting resistance<br />
Cutting materials the specific cutting resistance (k s ) is an important factor. The following sample shows its<br />
change in the functi<strong>on</strong> of depth of cut and of feeding (Figure 9).<br />
Figure 9. The value of specific cutting resistance in the functi<strong>on</strong> of depth of cut and of feeding, HD PE 1000<br />
110<br />
Copyright © <str<strong>on</strong>g>2011</str<strong>on</strong>g> by Laboratory Soete
Sustainable C<strong>on</strong>structi<strong>on</strong> and Design <str<strong>on</strong>g>2011</str<strong>on</strong>g><br />
According to the relati<strong>on</strong> to be found in the literature the main cutting force is the functi<strong>on</strong> of the specific<br />
cutting force (or resistance) and of the chip area. As during measuring we have also measured the main<br />
cutting force, the chip area was given because of parameters set, so the value of the specific cutting force<br />
can be got by transposing the original relati<strong>on</strong>.<br />
F<br />
Fv<br />
⎡ N<br />
= k<br />
s<br />
⋅ A = k<br />
s<br />
⋅ a ⋅ s ⇒ k<br />
s<br />
= →<br />
⋅ ⎢ 2<br />
a s ⎣mm<br />
⎤<br />
⎥<br />
⎦<br />
v<br />
(1)<br />
The material tested and the cutting speed used occur in the title of sample diagram. Beside the depth of cut<br />
and feeding the specific cutting resistance (y-axis) in N/mm 2 unit can be found <strong>on</strong> the datum lines.<br />
3.2 Chip pictures (photographs)<br />
The chip removed during machining have been collected and photographs have been made. Based <strong>on</strong><br />
these the types of chips formed can be examined. Figure 10. shows the chip pictures (splint, c<strong>on</strong>tinuous<br />
chip, transiti<strong>on</strong>al platelike, elemental) in the functi<strong>on</strong> of feeding and depth of cut at 50 m/min cutting speed<br />
at POM C material. It can be established those parameters at materials in case of which chip type meets<br />
well the practical requirements.<br />
Elemental<br />
chip<br />
Transiti<strong>on</strong>al<br />
platelike<br />
chip<br />
Splint,<br />
c<strong>on</strong>tinuous<br />
chip<br />
Figure 10. The forming of chip picture in the functi<strong>on</strong> of depth of cut and of feeding,<br />
POM C<br />
3.3 Tensile strength and specific strain<br />
During the test the pulling force (F) and strain (ΔL) is registered. From these data we have determined the<br />
tensile strength values and specific strain.<br />
F ⎡ N<br />
→<br />
A ⎢<br />
⎣mm<br />
∆L<br />
% = 100 ⋅<br />
L<br />
=<br />
2<br />
⎤<br />
⎥<br />
⎦<br />
σ (2)<br />
( ) 0<br />
→ [%]<br />
ε (3)<br />
0<br />
As an example Figure 11 shows the tensile diagram of POM C, where tensile strength is plotted against<br />
specific strain. While the different colors bel<strong>on</strong>g to different test samples the black dashed line expresses<br />
the average of six measured samples. Later the averaged curves were taken into account for further<br />
evaluati<strong>on</strong>s.<br />
111<br />
Copyright © <str<strong>on</strong>g>2011</str<strong>on</strong>g> by Laboratory Soete
Sustainable C<strong>on</strong>structi<strong>on</strong> and Design <str<strong>on</strong>g>2011</str<strong>on</strong>g><br />
Figure 11. Tensile curves of POM C<br />
Figure 12. shows the yield stress values determined from tensile tests. We found that PA 6G Mg material<br />
had the highest yield strength.<br />
Figure 12. Yield strength of the different samples<br />
3.4 Quotient of specific cutting resistance and yield strength<br />
We devided the specific cutting resistance (N/mm 2 ) (according to the set parameters - a, f, v -) with the yield<br />
tress values:<br />
k s<br />
σ<br />
→ [ −]<br />
These quotient values were plotted against the product of “a”- cutting depth and “f”- feed, namely the chip’s<br />
cross secti<strong>on</strong> (A c, mm 2 ). Figure 13. shows as an example the UHMW-PE HD 1000 material. The quotient is<br />
dimensi<strong>on</strong>less number. All of those graphs were c<strong>on</strong>structed for each materials.<br />
(4)<br />
112<br />
Copyright © <str<strong>on</strong>g>2011</str<strong>on</strong>g> by Laboratory Soete
Sustainable C<strong>on</strong>structi<strong>on</strong> and Design <str<strong>on</strong>g>2011</str<strong>on</strong>g><br />
Figure 13. The quotient of the cpecific cutting resistance and yield strength against the chip’s secti<strong>on</strong> for HD<br />
PE 1000<br />
4 CONCLUSIONS<br />
• It can be established from the test results that PA 6G Mg –material proved to be the toughest from<br />
both the cutting force and the specific cutting resistance point of view. The specific cutting force<br />
decreases substantially by increasing the cutting parameters (feeding, depth of cut). Taking into<br />
account the chip type formed it can be said that it is a hardly machineable material. Using the lower<br />
feeding (0.025 mm/rev) is suggested.<br />
• The PA 6G Na polymer shows a little lower toughness from the cutting force point of view, <strong>on</strong> the<br />
other hand in case of the specific cutting force it shows already more important change,<br />
approximately it reduces into third. Its value with the increasing of feed and depth of cut does not<br />
decrease such amount as in case of Mg-c<strong>on</strong>taining material. At cutting the small feeding (0.025<br />
mm/rev) and the greater depth of cut (1-2 mm) is suggested.<br />
• At POM C –material could be observed the further decrease of cutting – and specific cutting force.<br />
Both decreased into half approximately, but in case of latter, similarly finding PA 6G Na –material,<br />
neither here decreased such amount with increasing the feeding and depth of cut as at Mg –<br />
c<strong>on</strong>taining material. From the standpoint POM C had got the most favourable chip picture am<strong>on</strong>g<br />
the engineering plastics taking part in tests. Comparing to PA 6G –materials here is suggested the<br />
use of greater feeding with increasing depth of cut which results more favourable chip type forming,<br />
too.<br />
• The smallest cutting forces can be measured at HD 1000 –polymer. It can be well observed at the<br />
value of the specific cutting resistance that this material has got the lowest toughness. From the<br />
standpoint of turning this is not a favourable material as regarding the chip type formed is split<br />
(c<strong>on</strong>tinuous chip) in great part of cases tested. The analysis made can be well used in practice. The<br />
favourable values of feeding, of depth of cut and of cutting speed, within the ranges tested, can be<br />
set for cutting materials tested and for the favourable chip picture.<br />
• We measured the tensile properties of the materials according to MSZ EN ISO 527 standard with a<br />
type of INSTRON 5581 tensile machine and we prepared the tensile stress – deformati<strong>on</strong> curves of<br />
the polymers. From these diagrams we determined the yield stresses of the materials. We plotted<br />
the quotient of the specific cutting resistance and the yield stress in the functi<strong>on</strong> of the chip cross<br />
secti<strong>on</strong> with the all machining parameter groups.<br />
• The specific cutting resistance values of the engineering polymers practically are not available.<br />
Only the mechanical properties are highlighted in producers’ data sheets. Based <strong>on</strong> my research<br />
work knowing the tensile values of the material the specific cutting resistance can be estimated in<br />
case of a given machining settings. These can ease significantly the cutting calculati<strong>on</strong>s and the<br />
proper technological setup and determine the type of chip produced with a given setup. In the<br />
engineering practice the obtained new informati<strong>on</strong> formerly were not available, but now the<br />
comm<strong>on</strong>ly used engineering polymers have special machining database c<strong>on</strong>necting the cutting<br />
forces, tensile values, chip formati<strong>on</strong>s and removal into <strong>on</strong>e technological datasheet.<br />
113<br />
Copyright © <str<strong>on</strong>g>2011</str<strong>on</strong>g> by Laboratory Soete
Sustainable C<strong>on</strong>structi<strong>on</strong> and Design <str<strong>on</strong>g>2011</str<strong>on</strong>g><br />
5 REFERENCES<br />
[1] Antal – Fledrich – Kalácska – Kozma: Műszaki műanyagok gépészeti alapjai, Műszaki műanyagok<br />
gépészeti alapjai, Minerva-Sop Bt. Sopr<strong>on</strong>, 1997<br />
[2] Angyal B., Dobor Lné., Palásti K. B., Sipos S. – A Forgácsolás és Szerszámai – Műszaki<br />
Könyvkiadó, Budapest, 1988<br />
[3] Frischerz, Dax, Gundelfinger, Häffher, Itschner, Kotsch, Staniczek – Fémtechnológiai Táblázatok –<br />
B+V Lap- és Könyvkiadó Kft., 1997<br />
[4] Dr. Kalácska Gábor - Műszaki Műanyag Féltermékek Forgácsolása - Quattroplast Kft., Gödöllő,<br />
2005.<br />
[5] Nagy P. S. – Szerszámgépek, gyártórendszerek – BDMF jegyzet, Budapest, 1997<br />
[6] www.quattroplast.hu<br />
114<br />
Copyright © <str<strong>on</strong>g>2011</str<strong>on</strong>g> by Laboratory Soete
Sustainable C<strong>on</strong>structi<strong>on</strong> and Design <str<strong>on</strong>g>2011</str<strong>on</strong>g><br />
ROUGHNESS MEASUREMENT PROBLEMS IN TRIBOLOGICAL<br />
TESTING<br />
V. Rodriguez 1 , J. Sukumaran 1 , M. Ando 2 , P. De Baets 1<br />
1<br />
Ghent University, Laboratory Soete, Belgium<br />
2<br />
Szent István University, GÉTI, Hungary<br />
Abstract In tribological measurement of thermoplastics against steel the surface roughness has a potential<br />
effect in dictating the fricti<strong>on</strong>al behavior of the material. In most cases the roughness of the specimen is<br />
measured before and after the test, where it affects the fricti<strong>on</strong> force and influences the mechanism<br />
involved. The roughness of the material is not the exact value and it has a deviance which depends up<strong>on</strong><br />
the machining process used in preparing the surface. Generally, the directi<strong>on</strong> of machining has an influence<br />
<strong>on</strong> the topography of the surface in case of turning, milling and drilling but in case of pressed comp<strong>on</strong>ents<br />
the directi<strong>on</strong> has no effects. In order to maintain ideal test c<strong>on</strong>diti<strong>on</strong> the surface roughness of the test<br />
materials has to be c<strong>on</strong>sistent for the given number of samples. Even though the test specimens are<br />
machined in the same machine with same parameters there are number of parameters involved in deciding<br />
the c<strong>on</strong>sistency of the surface roughness. The roughness of the surface are defined by number of<br />
parameters such as Ra, Rz and few 3D parameters in such a case narrowing down to a specific c<strong>on</strong>stant is<br />
vital. The results from the roughness is not made from <strong>on</strong>e measurement were an average and deviance<br />
from several measurement decides that if two ideal samples has same or different roughness.<br />
Keywords : roughness comparable, machined surface, Ra, Rz.<br />
1 INTRODUCTION<br />
The influence of surface roughness has an important role in tribology, because most off the time the fricti<strong>on</strong><br />
and wear in two solids sliding against each other are encountered in several day-to-day activities [1].<br />
Usually the surface descripti<strong>on</strong> in the scientific articles is not appropriate and thus an overview is made <strong>on</strong><br />
identifying the suitable basic surface parameters.<br />
Surface texture is the repetitive or random deviati<strong>on</strong> from the nominal surface which forms the three<br />
dimensi<strong>on</strong>al topography of the surface. Fig. 1. Show different representati<strong>on</strong>s of surface roughness having<br />
the same Ra- value (Ra~0.64)[2].<br />
Figure 1. Various surface profiles having the same Ra value [Ra~ 0.64].<br />
115<br />
Copyright © <str<strong>on</strong>g>2011</str<strong>on</strong>g> by Laboratory Soete
Sustainable C<strong>on</strong>structi<strong>on</strong> and Design <str<strong>on</strong>g>2011</str<strong>on</strong>g><br />
Roughness (nano-and microroughness) are formed by surface irregularities of short wavelength,<br />
characterized by peaks (asperities) (local maximum) and valleys (local minimum) or varying amplitude and<br />
spacing that are larger than molecular dimensi<strong>on</strong>s. These create the predominant surface pattern, which<br />
exhibits those surfaces features intrinsic to the manufacturing process.<br />
Numerous techniques are used to quantitatively measure surface roughness which includes optical<br />
methods like optical interference and light scattering and mechanical methods, such as oblique secti<strong>on</strong>ing<br />
and stylus profilometry.<br />
Surface roughness most comm<strong>on</strong>ly refers to the variati<strong>on</strong>s in the height of the surface relative to a<br />
reference plane. It is measured either al<strong>on</strong>g a single line profile or al<strong>on</strong>g a set parallel line profiles (surface<br />
maps). It is usually characterized by <strong>on</strong>e of the two statistical height descriptors advocated by the American<br />
Nati<strong>on</strong>al Standards Intitute (ANSI) and the <str<strong>on</strong>g>Internati<strong>on</strong>al</str<strong>on</strong>g> Standardizati<strong>on</strong> Organizati<strong>on</strong> (ISO). According with<br />
those statistical height descriptors they defined this parameters like, five extreme-value height descriptors<br />
are defined as follows: Ra is defined as the distance between the highest asperity and the mean line: Rv is<br />
defined as the distance between the mean line and the lowest valley: Rz is defined as the distance between<br />
the averages of five highest asperities and the five lowest valleys; and Rpm is defined as the distance<br />
between the averages of the five highest asperities and the mean line. The reas<strong>on</strong> for taking and average<br />
value of asperities and valleys is to minimize the effect of unrepresentative asperities or valleys which<br />
occasi<strong>on</strong>ally occur and can give an err<strong>on</strong>eous value if taken singly. Rz and Rpm are more reproducible and<br />
are advocated by ISO. In many tribological applicati<strong>on</strong>s, height of the highest asperities above the mean<br />
line is an important parameter because damage may be d<strong>on</strong>e to the interface by the few high asperities<br />
present <strong>on</strong> <strong>on</strong>e of two surfaces; <strong>on</strong> the other hand, valleys may affect lubricati<strong>on</strong> retenti<strong>on</strong> and flow.<br />
The selecti<strong>on</strong> guide lines for the roughness value in respect to the functi<strong>on</strong> and manufacturing process is<br />
certainly not complete nevertheless the basics can serve as a reference (Fig. 2., the surface roughness is<br />
Ra in this case) . The overview shows that sliding surfaces with very low roughness value (Ra
Sustainable C<strong>on</strong>structi<strong>on</strong> and Design <str<strong>on</strong>g>2011</str<strong>on</strong>g><br />
In tribological applicati<strong>on</strong> the surface roughness has significant effect <strong>on</strong> the fricti<strong>on</strong> force and wear. The<br />
aim of the article is to illustrate the appropriate values and methods from the surface measurements and <strong>on</strong><br />
deciding the usage of parameters like Ra to Rz.<br />
2 SURFACE ROUGHNESS OF SPECIFIC SURFACE AND STATISTICAL DISTRIBUTION<br />
In the surface roughness measurement it is very difficult to measure at the same place every time and thus<br />
different values produced as a result of measurement. The working c<strong>on</strong>diti<strong>on</strong>s in the machining process<br />
changes from time to time due to tool wear, dynamic phenomen<strong>on</strong> of chip formati<strong>on</strong>, res<strong>on</strong>ance of the<br />
machine and possible thermal shock. Describing roughness parameter of a specific surface <strong>on</strong>e has to<br />
accept that a deviance exist all the time. Usually there are several independent parameters which has an<br />
effect <strong>on</strong> the surface roughness, so the Gaussian (normal) distributi<strong>on</strong> can be used to resolve the deviance.<br />
When somebody use for example Ra=3.2 necessary to use an interval also (Ra=3.2±0.2). The size of the<br />
interval for the deviance basically depend <strong>on</strong> the machining process (c<strong>on</strong>diti<strong>on</strong> of the tool, parameters of<br />
the machining) and the material (steel, polymer, aluminium).<br />
A steel plate (S355) was ground and measured for the roughness <strong>on</strong> 24 different points (Table 1.), and the<br />
Fig. 3. shows the group of different values from the measurement in the whole group. The distributi<strong>on</strong> of the<br />
values shows normal shape, because the peak is in the middle, and no other peaks can be found at the left<br />
or right side, and there is <strong>on</strong>ly <strong>on</strong>e peak in the whole roughness group.<br />
Table 1. Ra values of the grinded S355 plates<br />
0,441 0,533 0,615 0,631 0,653 0,699 0,716 0,792<br />
0,515 0,602 0,616 0,633 0,658 0,704 0,737 0,792<br />
0,524 0,607 0,628 0,636 0,669 0,712 0,749 0,819<br />
14<br />
Number of measurement<br />
12<br />
10<br />
8<br />
6<br />
4<br />
2<br />
0<br />
Figure 3. Roughness values of grinded plate.<br />
Fig. 4. Shows the calculated Gauss-curve based <strong>on</strong> the 24 measurement. The average point (Ra = 0.653)<br />
and the ± 2σ points (Ra = 0.467 and Ra = 0.840) is also marked in the figure.<br />
Gauss distributi<strong>on</strong><br />
5.0<br />
4.5<br />
4.0<br />
3.5<br />
3.0<br />
2.5<br />
2.0<br />
1.5<br />
1.0<br />
0.5<br />
0.0<br />
0.3-0.4 0.4-0.5 0.5-0.6 0.6-0.7 0.7-0.8 0.8-0.9 0.9-1.0<br />
Roughness - Ra (µm)<br />
0.3 0.4 0.5 0.6 0.7 0.8 0.9 1<br />
Roughness - Ra (µm)<br />
Figure 4. Gauss distributi<strong>on</strong> base <strong>on</strong> 24 measurements.<br />
117<br />
Copyright © <str<strong>on</strong>g>2011</str<strong>on</strong>g> by Laboratory Soete
Sustainable C<strong>on</strong>structi<strong>on</strong> and Design <str<strong>on</strong>g>2011</str<strong>on</strong>g><br />
The ± 2σ points show the limit, which 95% of the test results falls between the two points. In our case <strong>on</strong>ly<br />
<strong>on</strong>e value is out of this range, which represents 4.2%. Table 2. c<strong>on</strong>tains the values which bel<strong>on</strong>g to different<br />
sigma criteria to explicitly show the values which are present outside the range.<br />
Table 2. Effect of the sigma limits.<br />
Sigma Level Ra interval (µm) Average ± % Result out of the range<br />
±1σ 68% 0.560-0.746 0.653± 14.2% 8 ps 33.3%<br />
±2σ 95% 0.467-0.840 0.653± 28.4% 1 ps 4.2%<br />
±3σ 99.7% 0.374-0.933 0.653± 42.6% 0 ps 0%<br />
In normal technical practice an error of 5% is acceptable, which is accommodated inside the ±2σ range.<br />
Some specific fields ±3σ is also used, however, the applicati<strong>on</strong> of ±1σ (also from the diagrams) are<br />
incorrect and leading to misunderstanding.<br />
3 EFFECT OF THE MACHINING DIRECTION<br />
Most of the machining process creates the roughness profile with respect to the directi<strong>on</strong> of machining and<br />
the type of machining process itself has a directi<strong>on</strong> factor <strong>on</strong> the surface profile. For example in case of<br />
turning or grinding the measured value dramatically changes when the measurements are made parallel or<br />
perpendicular to the feed directi<strong>on</strong>. Milling has also this effect, but the differences of the values are<br />
relatively less. Some machining process exist which has minimal effect <strong>on</strong> the directi<strong>on</strong> such as finishing<br />
sander or fine polishing. In case of polymers the pressing also has no directi<strong>on</strong>al effects of the roughness.<br />
Fig. 5. Shows the surface roughness in case of grinding (different feed rates). Even though the samples are<br />
machined with same machining parameters a clear difference is seen between the parallel and<br />
perpendicular measurements seen from the Ra and Rz values which are not close to each other. In case of<br />
milling (Fig. 6.) both the group from parallel and perpendicular measurements are also seems separated<br />
but the differences are relatively less. The values in case of milling ten times bigger then the grinding, for<br />
this, the nominal values cannot be used to describe the parameter.<br />
R oughness - R z (µm) a<br />
3<br />
2.5<br />
2<br />
1.5<br />
1<br />
0.5<br />
Perpendicular of feed<br />
Parallel of feed<br />
R oughness - R z (µm) a<br />
35<br />
30<br />
25<br />
20<br />
15<br />
10<br />
5<br />
Perpendicular of feed<br />
Parallel of feed<br />
0<br />
0 0.05 0.1 0.15 0.2 0.25 0.3<br />
Roughness - Ra (µm)<br />
Figure 5. Effect of the measuring<br />
directi<strong>on</strong> in case of grinding.<br />
0<br />
0 1 2 3 4 5 6<br />
Roughness - Ra (µm)<br />
Figure 6. Effect of the measuring<br />
directi<strong>on</strong> in case of milling.<br />
The Fig.7. Shows the measurements from a pressed polymer sheet where is no difference in the sample<br />
surface <strong>on</strong> both the directi<strong>on</strong>s (the grey and the black dots are in <strong>on</strong>e cluster). The two groups in fig is<br />
because of the different material of the two samples. It is also interesting that pressed surface has ten times<br />
smoother surface than the grinding. In tribology it is well known that in polymer-steel c<strong>on</strong>tacts, smoother<br />
surface helps to the adhesi<strong>on</strong> characteristics. Using finishing sander also produces smooth surface without<br />
directi<strong>on</strong>al effect. On the Fig. 8 the dots are in the same group.<br />
118<br />
Copyright © <str<strong>on</strong>g>2011</str<strong>on</strong>g> by Laboratory Soete
Sustainable C<strong>on</strong>structi<strong>on</strong> and Design <str<strong>on</strong>g>2011</str<strong>on</strong>g><br />
4 RELATIONSHIPS BETWEEN RA AND RZ NOMENCLATURE<br />
From the previous figures it is seen that Ra and Rz parameters are not dependant <strong>on</strong> each other but <strong>on</strong> the<br />
other hand they are not completely independent as well, because they are calculated values from the same<br />
primary profile. In most cases it is necessary to c<strong>on</strong>vert the two values, for this some approximate method<br />
are exist.<br />
R oughness - R z (µm) a<br />
1.4<br />
1.2<br />
1<br />
0.8<br />
0.6<br />
0.4<br />
0.2<br />
0<br />
Vertical<br />
Horiz<strong>on</strong>tal<br />
sample 1<br />
sample 2<br />
0 0.02 0.04 0.06 0.08 0.1 0.12<br />
Roughness - Ra (µm)<br />
Figure 7. Effect of the measuring<br />
Figure 8. Effect of the measuring<br />
directi<strong>on</strong> in case of polymer pressing.directi<strong>on</strong> in case of using finishing sander.<br />
R oughness - R z (µm) a<br />
1.6<br />
1.4<br />
1.2<br />
1<br />
0.8<br />
0.6<br />
0.4<br />
0.2<br />
0<br />
Vertical<br />
Horiz<strong>on</strong>tal<br />
0 0.05 0.1 0.15<br />
Roughness - Ra (µm)<br />
One well known factor is Rz=4·Ra which cannot be used all the time. The basic problems is that this<br />
equati<strong>on</strong> is not sensitive to the Gaussian distributi<strong>on</strong>. In the real applicati<strong>on</strong> if the engineer choose Rz=15<br />
(from the drawing) but from the machined part we can measure just Ra, we should use an other equati<strong>on</strong><br />
(Ra=Rz/7.5) to get Ra=2 which means the machining process produces values between Ra
Sustainable C<strong>on</strong>structi<strong>on</strong> and Design <str<strong>on</strong>g>2011</str<strong>on</strong>g><br />
These calculati<strong>on</strong>s does already exist but the aim is to sort out the correct <strong>on</strong>e between several parameters<br />
(Ra, Rz…) and directi<strong>on</strong>s effects. From the different values of Ra and Rz correlati<strong>on</strong> cannot be made to<br />
make a certain surface. Fig 10. and Fig 11. show the results of different grinded steel plates in parallel and<br />
perpendicular directi<strong>on</strong>s. As you can see there is difference in the values of Ra and Rz between the<br />
perpendicular and the parallel measurements. Measurements parallel of the machining has less influence<br />
so the difference rather bel<strong>on</strong>gs to the results from the measurements in the perpendicular directi<strong>on</strong> (Fig.<br />
12).<br />
Table 3. Relati<strong>on</strong>ships between the surface parameters.<br />
Unknown<br />
parameters<br />
R a<br />
R a<br />
R z<br />
Measured<br />
parameters<br />
R z<br />
R q<br />
R q<br />
Border<br />
Rz<br />
R<br />
a<br />
=<br />
7,5<br />
Rq<br />
R<br />
a<br />
=<br />
1,4<br />
Rq<br />
R<br />
z<br />
=<br />
0,3<br />
= 4 ⋅ R<br />
R z R a z a<br />
R q R a q a<br />
R<br />
R<br />
= 1 ⋅ R<br />
= 0 , 15 ⋅ R<br />
R q R z q<br />
z<br />
R<br />
R oughness - R z (µm) a<br />
7<br />
6<br />
5<br />
4<br />
3<br />
2<br />
1<br />
0<br />
1st sample<br />
3rd sample<br />
2nd sample<br />
4th sample<br />
0 0.2 0.4 0.6 0.8 1<br />
Roughness - Ra (µm)<br />
Fig. 10. Different grinding samples<br />
(perpendicular of feed).<br />
R oughness - R z (µm) a<br />
4<br />
3.5<br />
3<br />
2.5<br />
2<br />
1.5<br />
1<br />
0.5<br />
0<br />
1st sample<br />
3rd sample<br />
2nd sample<br />
4th sample<br />
0 0.1 0.2 0.3 0.4 0.5 0.6<br />
Roughness - Ra (µm)<br />
Fig. 11. Different grinding samples<br />
(parallel of feed).<br />
120<br />
Copyright © <str<strong>on</strong>g>2011</str<strong>on</strong>g> by Laboratory Soete
Sustainable C<strong>on</strong>structi<strong>on</strong> and Design <str<strong>on</strong>g>2011</str<strong>on</strong>g><br />
R oughness - R a (µm) a<br />
1<br />
0.9<br />
0.8<br />
0.7<br />
0.6<br />
0.5<br />
0.4<br />
0.3<br />
0.2<br />
0.1<br />
0<br />
Perpendicular of feed<br />
Parallel of feed<br />
1 2 3 4<br />
Samples<br />
Figure 12. Roughness of different samples and directi<strong>on</strong>s.<br />
At first the t-test shows that the deviances of the plate are the same (usually this is true, because of the<br />
same machining process). If the t-test is good, f-test show the results are different or same. In our case the<br />
sec<strong>on</strong>d sample is different from the others, the other three are same. From the experiments it is clear that<br />
using the values of Ra or Rz are almost same to compare different surfaces. The parallel values are much<br />
closer then the perpendicular. In case of parallel the difference is just between sec<strong>on</strong>d and fourth samples.<br />
It is important to know the two surface are same and better to use the statistical method for identifying the<br />
parameters (Ra, Rz..) which can be used as a reference in the further experiments. In our case the sec<strong>on</strong>d<br />
sample was regrinding to achieve the same surface.<br />
6 CONCLUSION<br />
In tribological experiment surface roughness is <strong>on</strong>e of the important parameter. Because of that a<br />
comparable a specific surface roughness is needed. Unfortunately, sometimes even with the same<br />
machine and tool results in different surfaces. In the roughness measurement it is possible to calculate the<br />
average but it is also important to calculate the standard deviati<strong>on</strong>. Directi<strong>on</strong> effect is vital c<strong>on</strong>sidering the<br />
roughness measurement. In case of turning and grinding the parallel and the perpendicular values are<br />
completely different. In case of milling also has directi<strong>on</strong> effect but relatively less because the values are<br />
closer to each others. Some machining techniques have no directi<strong>on</strong>al effect (finishing sander, pressing).<br />
Between the surface roughness parameters (example Ra and Rz) exist some approximate method to<br />
change each other, but this methods are sensitive to the directi<strong>on</strong>s. To compare two surface the f-test and<br />
t-test should be used. Easy way is to not compare all the parameters, but just the <strong>on</strong>e perpendicular to the<br />
feed. Result of the statistical method practically are the same in case of the different surface roughness<br />
parameters (Ra, Rz…). If the samples surfaces are not the same it is worth to remac hine the different<br />
sample.<br />
7 REFERENCES<br />
[1] Van Beek Ant<strong>on</strong>i. “Advanced engineering design”. Delft University of technology mechanical<br />
engineering. Editi<strong>on</strong> 2006. Pg 138-141.<br />
[2] Bhushan Bharat. “Modern Tribology Handbook”. <str<strong>on</strong>g>Volume</str<strong>on</strong>g>n One. September 2000. Pg 49-50.<br />
[3] Quaglini Virginio. “Influence of counterface roughness <strong>on</strong> fricti<strong>on</strong> properties of engineering plastics for<br />
bearings applicati<strong>on</strong>s”. Materials and design. Italy 2009. Pg 1650-1658.<br />
[4] Yamaguchi. Y, “Tribology of plastics materials” Tribology series. <str<strong>on</strong>g>Volume</str<strong>on</strong>g>n 16. 1990 Elseiver.<br />
121<br />
Copyright © <str<strong>on</strong>g>2011</str<strong>on</strong>g> by Laboratory Soete
Sustainable C<strong>on</strong>structi<strong>on</strong> and Design <str<strong>on</strong>g>2011</str<strong>on</strong>g><br />
EFFECT OF VELOCITY ON ROLL/SLIP FOR LOW AND HIGH LOAD<br />
CONDITIONS IN POLYMER COMPOSITE<br />
J. Sukumaran 1 , M. Ando 2 , V. Rodriguez 1 , P. De Baets 1<br />
1 University of Gent, Department of Mechanical C<strong>on</strong>structi<strong>on</strong> and Producti<strong>on</strong>, Sint-Pietersnieuwstraat, 41,<br />
9000 Gent, Belgium<br />
2<br />
Szent István University, GÉTI, Páter Károly utca 1. 2100 Göldöllő, Hungary<br />
Abstract In the last decade polymer composites are often used without lubricati<strong>on</strong> <strong>on</strong> both low and high<br />
speed applicati<strong>on</strong>s. Some of the applicati<strong>on</strong> areas are marine, automotive and agriculture used as bearings<br />
and cams where roll-slip is the dominant mechanism. Limited studies are made for composites relating<br />
such applicati<strong>on</strong>s where rolling/sliding c<strong>on</strong>diti<strong>on</strong> influences the tribological behavior of the material.<br />
Investigating the roll-slip phenomen<strong>on</strong> for identifying the influence of velocity <strong>on</strong> fricti<strong>on</strong>al behavior can<br />
mark a boundary to map the use of composites with respect to its applicati<strong>on</strong>. Moreover, the design of the<br />
material can be optimized to match the operating c<strong>on</strong>diti<strong>on</strong>s. In the current research the polymer composite<br />
(with polyester matrix) has been tested under rolling-sliding c<strong>on</strong>diti<strong>on</strong> for two different loads with 61N and<br />
210N and with different speeds ranging from 10 rpm to 700 rpm. Ideal c<strong>on</strong>diti<strong>on</strong>s in terms of roughness, slip<br />
ratio, surface temperature and ambient temperature were maintained to reduce the fricti<strong>on</strong>al heating. Using<br />
a 20% slip ratio the behavior of the material was observed for the tribological characteristics where the rate<br />
of increase of fricti<strong>on</strong> force follows a exp<strong>on</strong>ential pattern with increasing speeds. Nevertheless, <strong>on</strong> testing<br />
with high speeds a steady rate of increase in the fricti<strong>on</strong> curve was observed. Fricti<strong>on</strong> behavior of<br />
composites under different speeds is briefed with the microstructural characteristics for low and high loads.<br />
Keywords Rolling/sliding, polyester composites, fricti<strong>on</strong> force, effect of velocity<br />
1 INTRODUCTION<br />
Composite are adopted as a soluti<strong>on</strong> to new materials in the bearing industry for dry running applicati<strong>on</strong>s<br />
in-order to avoid complex lubricating system [1]. Fiber composites are the preferred materials in such<br />
applicati<strong>on</strong>s for the versatility in fibre orientati<strong>on</strong>, fibre usage and volume fracti<strong>on</strong> of the composite which<br />
can be altered according to the requirement [2]. The fiber composites are preferred for their relatively high<br />
young’s modulus. Apart from the fibbers and resins, fillers are added as a lubricant to have better fricti<strong>on</strong>al<br />
behaviour [3- 5]. Internal lubricant such as PTFE is generally used as fricti<strong>on</strong> modifiers. Low coefficient of<br />
fricti<strong>on</strong>, resistance to stick-slip and high anti-adhesive property of PTFE makes it a suitable material as<br />
fricti<strong>on</strong> modifiers in bearings [6, 7]. It was also found that the fiber orientati<strong>on</strong> normal to the sliding direct<br />
has produced favourable fricti<strong>on</strong> c<strong>on</strong>diti<strong>on</strong>s [8].<br />
The influential parameters mostly investigated in a tribological system of polymer composites are the<br />
velocity and the load governed by the visco-elastic property of the material[8]. Even though standard rules<br />
dictate the tribological behaviour, the system as a whole does not permits to have the same results for the<br />
similar materials at same test c<strong>on</strong>diti<strong>on</strong> [3]. Previous research by El Syed et al [1] with fiber reinforced<br />
polymer composites has produced high coefficient of fricti<strong>on</strong> for low pv ratio which is explained by the<br />
softening behaviour of the composite. C<strong>on</strong>tradicting behaviour <strong>on</strong> the tendency of the fricti<strong>on</strong> co-efficient<br />
was observed by Su et al <strong>on</strong> investigati<strong>on</strong> PTFE composites [6]. The fricti<strong>on</strong> coefficient varies inevitably<br />
independent to the applied load where materials tested at high speeds have low coefficient of fricti<strong>on</strong> due to<br />
the polishing effect. Apart from the load and the velocity the fricti<strong>on</strong>al heating plays a vital role by having a<br />
deposit of transfer layer in the counterface material and thus reducing the coefficient of fricti<strong>on</strong>.<br />
The deposit of transfer layer is a system and the material dependant, early research by El-Tayeba et al <strong>on</strong><br />
polyester composites with sugarcane fibre and glass fibre has dissimilar results due to the back transfer of<br />
polymers in <strong>on</strong>e of the materials by adhesi<strong>on</strong> process [9]. Since a clear boundary has not been<br />
characterized between the presence of transfer layer and the back transfer, the material interacti<strong>on</strong> rather<br />
seem to be uncertain. The current research has the underlying principle of interacti<strong>on</strong> between compositemetal<br />
pairs rather than composite-composite pairs. And this is maintained by avoiding the phenomen<strong>on</strong> of<br />
transfer film and isolating the temperature variable (By having approximately a c<strong>on</strong>stant c<strong>on</strong>tact<br />
temperature al<strong>on</strong>g the test).<br />
In the tribological system the most comm<strong>on</strong>ly occurring phenomen<strong>on</strong> is sliding and most of the researches<br />
corresp<strong>on</strong>d to pure sliding c<strong>on</strong>diti<strong>on</strong> where adhesi<strong>on</strong> plays a vital role. Apart from sliding the rolling<br />
122<br />
Copyright © <str<strong>on</strong>g>2011</str<strong>on</strong>g> by Laboratory Soete
Sustainable C<strong>on</strong>structi<strong>on</strong> and Design <str<strong>on</strong>g>2011</str<strong>on</strong>g><br />
phenomen<strong>on</strong> exhibits in certain engineering comp<strong>on</strong>ents like gear, cams and rollers which tend to have rollslip.<br />
This rolling to sliding at the same time has deformati<strong>on</strong> as the additi<strong>on</strong>al mechanism to complicate the<br />
investigati<strong>on</strong>. Only few researches have been c<strong>on</strong>ducted <strong>on</strong> polymer-metal and polymer-polymer c<strong>on</strong>tacts<br />
[10-13] thus leading to a situati<strong>on</strong> of testing the interacti<strong>on</strong> between composite-metal pair <strong>on</strong> rolling/sliding<br />
c<strong>on</strong>diti<strong>on</strong>s.<br />
2 EXPERIMENTAL<br />
2.1 Materials<br />
A combinati<strong>on</strong> of thermoset composite against steel is used for the current investigati<strong>on</strong>. Commercially<br />
available polyester fiber reinforced polyester (Orkot) is used in place of the thermoset composite and<br />
40CrMn tool steel is used as a counterface material. Orkot (Trelleborg AB) is a specially designed material<br />
used for bearings, the composite comprises polyester fabric with thermoset resin and PTFE as a internal<br />
lubricant. The material properties for the thermoset composite and the counterface material are given in<br />
Table 1. The used composite samples are in the form of a ring where a holder is used under press fit to fix<br />
the test material to the setup <strong>on</strong> running against solid counterface material. The composite ring has 8mm<br />
width and 5mm thickness. The diameter of the c<strong>on</strong>tacting surface for the composite and the counterface<br />
material is 90.12 & 74.93mm.<br />
Table 1. Properties of the used materials.<br />
Properties 40CrMn Orkot<br />
Yield strength [MPa] 415 55<br />
Young’s modulus [GPa] 205 3.3<br />
Impact Strength (Charpy) [kJ/m 2 ] 590<br />
122<br />
Hardness 220 HB 100 Rockwell M<br />
Maximum allowable service temp. [˚C] - 130<br />
2.2 Test device<br />
Although standards are available to study the fricti<strong>on</strong>al behaviour of materials for sliding phenomen<strong>on</strong>, the<br />
involvement of rolling in some cases urges the materials to be tested for roll-slip. A twin-disc is the apt<br />
model to investigate the c<strong>on</strong>tact between composite-metal pairs during rolling/sliding c<strong>on</strong>diti<strong>on</strong>. For the<br />
current investigati<strong>on</strong> the modified twin-disc setup at Laboratory Soete is used to test composite against tool<br />
steel for a specific slip ratio which is achieved by the difference in the diameter of the test disc and the<br />
counterface material disc. The required slip ratio is obtained by having different diameter of steel disc (d 1 )<br />
and composite disc (d 2 ), which can be calculated with (1):<br />
⎛ d2 − d1<br />
⎞<br />
s = ⎜ ⋅100<br />
d<br />
⎟<br />
(1)<br />
⎝ 1 ⎠<br />
Torque meter attached to the shaft of the steel disc is used to measure the fricti<strong>on</strong> torque. Moreover, the<br />
temperature of the c<strong>on</strong>tact surface is measured using an infrared sensor and the normal load is induced by<br />
loading dead weights to the pivoted arm. Figure 1. shows the twin-disc setup used for testing the<br />
composite-metal pair.<br />
All the measurements were recorded using <strong>on</strong>line data acquisiti<strong>on</strong> system. Materials are tested with 20%<br />
slip ratio for five different speeds ranging from 10 rpm to 700 rpm for low load and high loading c<strong>on</strong>diti<strong>on</strong>. A<br />
special program is developed (using labview) to test the material for different speeds. Initially a running-in is<br />
made for 16 minutes preceded by the measuring cycles where a specific time for c<strong>on</strong>diti<strong>on</strong>ing is introduced<br />
for changing the speeds. C<strong>on</strong>diti<strong>on</strong>ing is d<strong>on</strong>e in order to avoid the transiti<strong>on</strong> during change in speed. In<br />
regards to the temperature measurement, the infra red sensor is located 180˚ C away from the instant of<br />
c<strong>on</strong>tact.<br />
The fricti<strong>on</strong> from the bearings and seals of the machine has an influence <strong>on</strong> the measured fricti<strong>on</strong> torque<br />
and hence to have precise results a reference torque under no load c<strong>on</strong>diti<strong>on</strong> is suplimented from the<br />
fricti<strong>on</strong>-torque obtained during loading. Moreover, the fricti<strong>on</strong> force is calculated from the fricti<strong>on</strong> torque and<br />
the diameter of the test disc (2).<br />
Fricti<strong>on</strong><br />
T ( Nm)<br />
" Measurments"<br />
−Average<br />
of " reference Torque"<br />
force ( N)<br />
= =<br />
(2)<br />
r(<br />
m)<br />
radius of the steel wheel<br />
123<br />
Copyright © <str<strong>on</strong>g>2011</str<strong>on</strong>g> by Laboratory Soete
Sustainable C<strong>on</strong>structi<strong>on</strong> and Design <str<strong>on</strong>g>2011</str<strong>on</strong>g><br />
Figure 1. Shows the twin disc FZG test setup<br />
Both the metal and composite samples were cleaned before and after the measurements. The c<strong>on</strong>tact<br />
surface of the counterface material is cleaned with metal sp<strong>on</strong>ge, acet<strong>on</strong>e and alcohol (Loctite 7061), the<br />
same is used for the composite material except for the metal sp<strong>on</strong>ge which could change the surface<br />
parameter of the composite. Micrograph of the c<strong>on</strong>tact surface is taken at all intervals using a SFX<br />
microscope (Olympus) and a video camera (QICAM). Change is roughness of the c<strong>on</strong>tact surface is<br />
measured after every interval using a roughness tester (Homel).<br />
3 RESULT AND DISCUSSION<br />
Material behaviour <strong>on</strong> Hertzian n<strong>on</strong>-c<strong>on</strong>formal c<strong>on</strong>tacts plays a vital role in deciding the material behaviour<br />
for specific applicati<strong>on</strong>s. Polyester composites were run against tool steel countersurface to test the<br />
tribological behaviour <strong>on</strong> rolling/sliding c<strong>on</strong>diti<strong>on</strong>. Obtained results are the average of five measurements at<br />
every point in the curve. A deviati<strong>on</strong> approximately 10% was observed which is very good in case of<br />
tribological testing. Five different speeds with 10, 100, 200, 450 and 700 rpm are used together with 61N<br />
(maximum pressure is 77.23 MPa) and 210N (maximum pressure is 143.30 MPa) loads to study the<br />
tendency of fricti<strong>on</strong> force. The fricti<strong>on</strong> force increases as the load is increased likewise the increase in<br />
speed tends to increase the fricti<strong>on</strong> force. Figure 2. illustrates the fricti<strong>on</strong> force as a functi<strong>on</strong> of speed for<br />
both low and high load c<strong>on</strong>diti<strong>on</strong>.<br />
25<br />
20<br />
Fricti<strong>on</strong> force [N]<br />
15<br />
10<br />
5<br />
0<br />
61N calculated<br />
61N measured<br />
210N calculated<br />
210N measured<br />
0 100 200 300 400 500 600 700 800<br />
Rotati<strong>on</strong> [1/min]<br />
Figure 2. Fricti<strong>on</strong> force as a functi<strong>on</strong> of speed<br />
The points in the plotted graph represents the experimental values and the curves are from the calculated<br />
functi<strong>on</strong>s. It is seen that the fricti<strong>on</strong> force is relatively less <strong>on</strong> low speeds and found to be rapidly increasing<br />
until a critical value (approximately 100-150 rpm) and saturates further to follow a linear increase to the<br />
corresp<strong>on</strong>ding speed. The rapid increase in fricti<strong>on</strong> force <strong>on</strong> low speeds is effective in high load c<strong>on</strong>diti<strong>on</strong><br />
relative to low load. The rapid increase in low speed can be explained with the time dependant strain<br />
124<br />
Copyright © <str<strong>on</strong>g>2011</str<strong>on</strong>g> by Laboratory Soete
Sustainable C<strong>on</strong>structi<strong>on</strong> and Design <str<strong>on</strong>g>2011</str<strong>on</strong>g><br />
resp<strong>on</strong>se of the polymer in the reinforced composite. The overall tendency of the curve shows exp<strong>on</strong>ential<br />
behaviour of the materials <strong>on</strong> testing against steel. It is interesting that the fricti<strong>on</strong> force increases by<br />
approximately 51% from 10 to 100 rpm <strong>on</strong> low and high load c<strong>on</strong>diti<strong>on</strong>. In case of high speeds between 100<br />
to 700 rpm the fricti<strong>on</strong> force increases just 26% at high loads and 42% in low load. This tendency might<br />
have been produced by having large rolling resistance, and there is also some effect due to the str<strong>on</strong>ger<br />
adhesi<strong>on</strong> during high loads.<br />
Table 2. illustrates the functi<strong>on</strong>s for the curves and their R 2 values where a linear increase in case of high<br />
load is seen and simultaneously the rate of increase in fricti<strong>on</strong> force is relatively more. But the high nominal<br />
values <strong>on</strong> changing to high speed since 100-700 rpm is 26% which means, the material <strong>on</strong> high load is less<br />
sensitive to the speed relative to the low load.<br />
Table 2. illustrates the functi<strong>on</strong>s for the curves and their R<br />
2<br />
values<br />
M238 and PA6 Equati<strong>on</strong> R 2 value<br />
61 N (77.23 MPa)<br />
-0.0897⋅n<br />
F = 3.367 ⋅(1- e ) + 0.004 ⋅ n + 1.718 0.8602<br />
210 N (143.30 MPa) -0.0256⋅n<br />
F = 6.895⋅(1- e ) + 0.007 ⋅ n + 9. 082 0.9656<br />
3.1 Effect of the temperature<br />
Most of the studies <strong>on</strong> fricti<strong>on</strong> force are evaluated based <strong>on</strong> the temperature effects but in fundamental<br />
research isolating a variable gives much more valuable informati<strong>on</strong> to design the system and the material<br />
accordingly. In the current research the effect of temperature has been eliminated by using limited time of<br />
c<strong>on</strong>tact. Figure 3. (a) & (b) shows the measured temperature as a functi<strong>on</strong> of speed where an increase in<br />
temperature of 2˚C is observed in both low and high load c<strong>on</strong>diti<strong>on</strong>. In previous research <strong>on</strong> rolling/sliding<br />
c<strong>on</strong>tacts of polymers the temperature increases over 80˚C which has potent effect <strong>on</strong> the fricti<strong>on</strong> force but<br />
in our case the maximum attained temperature was 26 ˚C which has relatively less effect to c<strong>on</strong>sider fricti<strong>on</strong><br />
heating to decide the tendency of the fricti<strong>on</strong>al curve. In most of the cases the tendency of the temperature<br />
curve is linear to the increasing speed but within a very limited range so to c<strong>on</strong>sider it as a major change in<br />
the temperature is not viable. Within the two degree increase in temperature higher temperature was<br />
observed in low loading c<strong>on</strong>diti<strong>on</strong>. Temperature also has an effect <strong>on</strong> forming transfer layers in the<br />
counterface material, which was not observed in our case due to less fricti<strong>on</strong> heating and limited c<strong>on</strong>tact<br />
period. The transfer layer tends to have a c<strong>on</strong>diti<strong>on</strong> where composite is tested against composite but in our<br />
case by avoiding such a phenomen<strong>on</strong> a real interacti<strong>on</strong> between composite and metal are studied.<br />
27<br />
27<br />
25<br />
25<br />
Temperature [°C]<br />
23<br />
21<br />
19<br />
Temperature [°C]<br />
23<br />
21<br />
19<br />
17<br />
17<br />
15<br />
0 100 200 300 400 500 600 700<br />
Rotati<strong>on</strong> [1/min]<br />
Figure 3. Measurements <strong>on</strong> temperature Vs speed (a) low loading c<strong>on</strong>diti<strong>on</strong> (b) high loading c<strong>on</strong>diti<strong>on</strong><br />
15<br />
0 100 200 300 400 500 600 700<br />
Rotati<strong>on</strong> [1/min]<br />
The depositi<strong>on</strong> of transfer material <strong>on</strong> the counter face is critical which relies <strong>on</strong> the parameters like load<br />
and velocity activated by thermal effects. In most cases the transfer layers are very well present and in few<br />
cases the transfer layer cannot be seen due possible melting from the counterface material and transferred<br />
back to the polymer surface by adhesi<strong>on</strong>. In the current research such complicati<strong>on</strong>s were avoided and the<br />
result deliberates the influence of velocity without the aid of composite. Studies have proven that a deposit<br />
of atomic layer of plastic occurs during the first c<strong>on</strong>tact [14]. Nevertheless, even with an atomic layer of<br />
polymer <strong>on</strong> the counterface material the influencing factor affecting the fricti<strong>on</strong> force should be negligible.<br />
3.2 Micrograph<br />
Images were made <strong>on</strong> the c<strong>on</strong>tact surface using Olympus SRZ microscope before and after the testing. It is<br />
seen in Figure 4. (a) that a clean surface of the composite is seen before testing without any pits or<br />
125<br />
Copyright © <str<strong>on</strong>g>2011</str<strong>on</strong>g> by Laboratory Soete
Sustainable C<strong>on</strong>structi<strong>on</strong> and Design <str<strong>on</strong>g>2011</str<strong>on</strong>g><br />
damages. But, <strong>on</strong> the other hand images shown in Figure 4. (b) & (c) from the tested surface displays pits<br />
and abraded surface.<br />
(a) (b) (c)<br />
Figure 4. shows the c<strong>on</strong>tact surface of the composite (a) before c<strong>on</strong>tact (b) low load (c) high load<br />
The scale like appearance <strong>on</strong> the c<strong>on</strong>tact surface is due to the aberrati<strong>on</strong> of thermoset leaving the matrix to<br />
expose and the pits are the places where the fibers tends to break leaving craters <strong>on</strong> the c<strong>on</strong>tact surface.<br />
Composite being the less hard material than the tool steel is expected to have c<strong>on</strong>siderable change in<br />
surface topography relative to the steel surface and hence the imaging is d<strong>on</strong>e <strong>on</strong>ly <strong>on</strong> composite surface.<br />
It is also seen from the image that the machine mark from the steel is impregnated in the composite.<br />
Comparing the image from both the loads not much difference is seen in the surface topography.<br />
4 CONCLUSIONS<br />
Composite – metal pair which has recently captured the bearing industry for dry running applicati<strong>on</strong> has<br />
complex mechanism involved in briefing the fricti<strong>on</strong> behaviour of these materials. Results from previous<br />
researches focuses <strong>on</strong> sliding but roll-slip does occur in such composite-metal pairs in applicati<strong>on</strong>s like<br />
bearings, gears and cams. Experiments for roll-slip phenomen<strong>on</strong> under different velocities in low and high<br />
load c<strong>on</strong>diti<strong>on</strong> produce similar results with a change in the tendency of the fricti<strong>on</strong> curve al<strong>on</strong>g the test<br />
period. The fricti<strong>on</strong> force increases rapidly under low speed until 100rpm and above that until 700 rpm the<br />
fricti<strong>on</strong> force increases linearly with increasing speed. Al<strong>on</strong>g the test cycle a combinati<strong>on</strong> of exp<strong>on</strong>ential and<br />
a linear behaviour of the fricti<strong>on</strong> curve was produced. Moreover, for the observed tendency the material is<br />
less sensitive to the changing speed in case high load. For this result there is a minimal effect of the c<strong>on</strong>tact<br />
temperature (less than 2°C changing) because of the special test method and the envir<strong>on</strong>ment. There was<br />
no goal to examined the wear but from the beginning the are some craters <strong>on</strong> the composite surface.<br />
5 NOMENCLATURE<br />
F - fricti<strong>on</strong> force<br />
T - fricti<strong>on</strong> torque<br />
Fn - normal load<br />
R - radius of the steel wheel<br />
d 1<br />
d<br />
2<br />
- diameter of the steel wheel<br />
- diameter of the composite wheel<br />
PTFE – polytetrafluorethylene<br />
6 REFERENCES<br />
[1] El-Sayed A.A., El-Sherbiny M.G., Abo-El-Ezz A.S., Aggag G.A., Fricti<strong>on</strong> and wear properties of<br />
polymeric composite materials for bearing applicati<strong>on</strong>s, Wear, 184(1), 45–53, 1995.<br />
[2] Srivastava V.K., Pathak J.P., Fricti<strong>on</strong> and wear properties of bushing bearing of graphite filled short<br />
glass fibre composites in dry sliding, Wear 197(1-2), 145–150, 1996.<br />
[3] Quintelier J., Online wear m<strong>on</strong>itoring of polymer matrix composites with advanced measurement<br />
techniques, Ph.D Thesis, Gent University, 2007.<br />
[4] Kishore, Sampathkumaran P., Seetharamu S., Thomas P., Janardhana M., A study <strong>on</strong> the effect of the<br />
type and c<strong>on</strong>tent of filler in epoxy–glass composite system <strong>on</strong> the fricti<strong>on</strong> and slide wear characteristics,<br />
Wear, 259(1-6), 634–641, 2005.<br />
126<br />
Copyright © <str<strong>on</strong>g>2011</str<strong>on</strong>g> by Laboratory Soete
Sustainable C<strong>on</strong>structi<strong>on</strong> and Design <str<strong>on</strong>g>2011</str<strong>on</strong>g><br />
[5] Zhang X, Pei X, Wang Q. Fricti<strong>on</strong> and wear properties of combined surface modified carb<strong>on</strong> fabric<br />
reinforced phenolic composites. European Polymer Journal 44, 2551–2557, 2008.<br />
[6] Su F., Zhang Z.Z., Guo F., Men X.H., Liu W.M., Fricti<strong>on</strong> and wear properties of fabric/phenolic<br />
composites with plasma treated-hybrid glass/PTFE fabric, Composites Science and Technology, 67(6),<br />
981–988, 2007<br />
[7] Burris DL, Sawyer WG. A low fricti<strong>on</strong> and ultra low wear rate PEEK/PTFE composite, ,Wear 261, 410–<br />
418, 2006.<br />
[8] Suresh B, ShivaKumar K, Seetharamu S, SampathKumaran P. Fricti<strong>on</strong> and dry sliding wear behavior of<br />
carb<strong>on</strong> and glass fabric reinforced vinylester composites. Tribology <str<strong>on</strong>g>Internati<strong>on</strong>al</str<strong>on</strong>g> 43, 602–609, 2010.<br />
[9] El-Tayeba N.S.M., A study <strong>on</strong> the potential of sugarcane fibers/polyester composite for tribological<br />
applicati<strong>on</strong>s. Wear, <str<strong>on</strong>g>Volume</str<strong>on</strong>g> 265(1-2) 25, 223-235, 2008<br />
[10] Hooke C.J., Kukureka S.N., Liao P., Rao M., Chen Y.K., The fricti<strong>on</strong> and wear of polymers in n<strong>on</strong>c<strong>on</strong>formal<br />
c<strong>on</strong>tacts, Wear, 200(1-2), 83–94, 1996.<br />
[11] Kukureka S.N., Chen Y.K., Hooke C.J., Liao P., The wear mechanisms of acetal in unlubricated rolling<br />
– sliding c<strong>on</strong>tact, Wear, 185(1-2), 1–8, 1995.<br />
[12] Gord<strong>on</strong>a D.H., Kukureka S.N., The wear and fricti<strong>on</strong> of polyamide 46 and polyamide 46/aramid-fibre,<br />
composites in sliding–rolling c<strong>on</strong>tact, Wear, 267(1-4), 669–678, 2009.<br />
[13] Chena Y.K., Modib O.P., Mhaya A.S., Chrysanthou A., O’Sullivan J.M., The effect of different metallic<br />
counterface materials and different surface treatments <strong>on</strong> the wear and fricti<strong>on</strong> of polyamide 66 and its<br />
composite in rolling–sliding c<strong>on</strong>tact, Wear, 255(1-6), 714–721, 2003.<br />
[14] S Bahadur. The development of transfer layers and their role in polymer Tribology. Wear 245 (1-2), 92-<br />
99, 2000.<br />
127<br />
Copyright © <str<strong>on</strong>g>2011</str<strong>on</strong>g> by Laboratory Soete
Sustainable C<strong>on</strong>structi<strong>on</strong> and Design <str<strong>on</strong>g>2011</str<strong>on</strong>g><br />
THE SYMMETRICAL BEHAVIOUR OF CARBON NANOTUBES<br />
JUNCTIONS<br />
T. I. Pataki; Z. Szakál<br />
Institute for Mechanical Engineering Technology, Faculty of Mechanical Engineering,<br />
Szent István University, Gödöllő, Hungary<br />
www.geti.gek.szie.hu<br />
Abstract We have been developing a mathematical model to predict the mechanical behaviour of carb<strong>on</strong><br />
nanotubes under loads having different types of structures. In this paper we would like to introduce the<br />
behaviour of carb<strong>on</strong> nanotubes juncti<strong>on</strong>s under tensile strain. With an example we display that in a<br />
structure the juncti<strong>on</strong>s are very important intensifier comp<strong>on</strong>ent. We show the difference between the<br />
symmetrical and n<strong>on</strong>-symmetrical juncti<strong>on</strong>s. We give an answer, which juncti<strong>on</strong>s are symmetrical and<br />
which <strong>on</strong>es are not symmetrical. Under tensile strain the “Y” juncti<strong>on</strong>s have different behaviour, if they are<br />
symmetric, or not.<br />
Keywords nanotube, mechanical strain, symmetrical, simulati<strong>on</strong><br />
1 INTRODUCTION<br />
We have found two kinds of examples to the tensile tests of carb<strong>on</strong> nanotubes in the technical literature. In<br />
both cases samples fixed between the needles of microscopes were pulled by atomic force, in <strong>on</strong>e case<br />
nanotube bunches [1], in another case multiwall carb<strong>on</strong> nanotube [2-3]. Beside of test difficulties problem<br />
was also the unknown exact structure of the samples tested, it couldn’t be known that the measuring<br />
c<strong>on</strong>cerned for what exactly.<br />
Several research fellows tried to determine the stress-strain diagrams by theoretical way [4-8]. The basic of<br />
the methods are always that the atomic forces can be determined as a derivatum of the potential functi<strong>on</strong><br />
determining the energy of chemical bounding. The empirical Brenner-potential is used [9] for this now days<br />
nearly every-where. The reseats got however differed fairly from time to time there were also differences<br />
withes more scales for example in the values of tensile strength calculated [4-8]. The differences derived<br />
from the different applicati<strong>on</strong>s of the Brenner-formulas. Several research fellows noticed namely that as<br />
l<strong>on</strong>g as the Brenner-formulas can be applied excellently to determine the state of equilibrium at the<br />
calculati<strong>on</strong> of atomic forces there are already problems as <strong>on</strong> the derivate functi<strong>on</strong> there are break point<br />
and sudden incline changes which can not be explained with the behaviour of chemical b<strong>on</strong>dings. First of<br />
all eluding by different ways of this problem caused the great differences at between strength calculated<br />
with the Brenner-potential. The best soluti<strong>on</strong> to this problem was given by eliminating mathematically the<br />
break point the sudden incline changes <strong>on</strong> the derivate formulas so that in the meantime it remained<br />
unchanged the possibility of looking for the equilibrium too. [10]<br />
We have produced a computer program for the simulati<strong>on</strong> algorithm of carb<strong>on</strong> nanotube structures tensile<br />
test in this paper to be able to run in case of great numbers of atoms. We made possible to determine the<br />
basic strength properties first of all for nanotube juncti<strong>on</strong>s [11-15] and networks [16-18] recommended as<br />
never carb<strong>on</strong> nanostructures by according to newest researches. That is important because in case of<br />
carb<strong>on</strong> nanostructures <strong>on</strong>e of the most interesting characteristic is the high strength and the similarly<br />
unusual interesting electric behaviour [19-20].<br />
2 SIMULATION ALGORITHM OF TENSILE TEST<br />
As we calculate also the b<strong>on</strong>ding forces between atoms as derivate of energetic potential functi<strong>on</strong> of<br />
chemical b<strong>on</strong>dings we think necessary to make known the Brenner- formulas [9]. In this way the energetic<br />
potential is described with a rejecting (V R ) and an attractive (V A ) member between i-atom and j-atom to be<br />
in r ij -distance from each other:<br />
V<br />
( r ) V ( r ) − B V ( r )<br />
ij<br />
= (1)<br />
R<br />
ij<br />
ij<br />
A<br />
ij<br />
128<br />
Copyright © <str<strong>on</strong>g>2011</str<strong>on</strong>g> by Laboratory Soete
Sustainable C<strong>on</strong>structi<strong>on</strong> and Design <str<strong>on</strong>g>2011</str<strong>on</strong>g><br />
where the members are given with the help of D e S, and R material factors.<br />
V<br />
R<br />
De<br />
= e<br />
S −1<br />
− 2S<br />
β ( r−R)<br />
f<br />
ij<br />
( r )<br />
ij<br />
β<br />
DeS<br />
− 2 / S β ( r−R)<br />
és V = e f ( r )<br />
A<br />
S −1<br />
The f ij correcti<strong>on</strong> functi<strong>on</strong> is a formula given by mathematic polynomes. It has got twofold role: partly cuts<br />
the attractive and rejecting effects outside a range (rather l<strong>on</strong>g) given partly because of its parametric<br />
shape the formulas can be matched to measuring results, both functi<strong>on</strong>s show their effects at departing<br />
from the equilibrium. [10] it was solved by introducing this that there are no break points and sudden incline<br />
changes <strong>on</strong> the derivative of the Brenner-formulas.<br />
It is taken into account the effect of local surroundings of atoms (first and sec<strong>on</strong>d coordinati<strong>on</strong> sphere) and<br />
the different angles of b<strong>on</strong>dings with the help of Bij -factor:<br />
ij<br />
ij<br />
(2)<br />
where<br />
−δ<br />
⎡ ⎤<br />
B<br />
ij = ⎢1<br />
+ ∑G(<br />
θ<br />
ijk<br />
) fik<br />
( rik<br />
) ⎥<br />
(3)<br />
⎣ k ( ≠i,<br />
j)<br />
⎦<br />
Θ<br />
ijk<br />
is the angle of i-j and k-b<strong>on</strong>dings, G given with a0 , c0<br />
, d<br />
0<br />
material factors respectively:<br />
2<br />
2<br />
⎡ c<br />
⎤<br />
0<br />
c0<br />
Θ = a0<br />
⎢1<br />
+ −<br />
2 2<br />
2<br />
⎣ d0<br />
d0<br />
+<br />
( )<br />
The factor in (1) formula:<br />
G (4)<br />
ij<br />
( B B )/<br />
2<br />
B +<br />
ij<br />
( 1+<br />
cosΘ) ⎥ ⎦<br />
= (5)<br />
ji<br />
The steps of simulati<strong>on</strong> algorithm of tensile test:<br />
We have developed a computer program for the algorithm:<br />
1. Giving the carb<strong>on</strong> nano-structure with the Table of appropriate point coordinates of atoms, unloaded,<br />
static c<strong>on</strong>diti<strong>on</strong>.<br />
2. Moving the atoms to be in the place of load in the load directi<strong>on</strong> with small distance. (The displacement<br />
degree is so small it doesn’t disturb the equilibrium calculati<strong>on</strong>s of the next step.)<br />
3. Calculati<strong>on</strong> of the new equilibrium (minimizing the Brenner-formula): c<strong>on</strong>firming the atoms to be in the<br />
place of fixati<strong>on</strong> and displaced in the previous step, the atoms between them are relaxed until to be<br />
calculated the equilibrium.<br />
4. Calculati<strong>on</strong> of b<strong>on</strong>ding forces.<br />
5. Repeating the previous three steps until the structure is damaged or niptures (if certain b<strong>on</strong>ding in the<br />
structure reaches critical b<strong>on</strong>d length, which is 1.7 Å).<br />
6. Naturally it is sufficient to calculate the b<strong>on</strong>ding forces at the weakest place (cross secti<strong>on</strong>) as this place<br />
however will be knows <strong>on</strong>ly during pulling because the forces can be expediently calculated from the<br />
tables put down after the steps, too. Finally we represent the resultant of b<strong>on</strong>ding forces added<br />
vectorial at the weakest cross secti<strong>on</strong> in the functi<strong>on</strong> of el<strong>on</strong>gati<strong>on</strong> and this will be the tensile-test<br />
diagram.<br />
After carrying out the chechings needed we started out research work by running the algorithm <strong>on</strong> a<br />
nanotube-structure. The aim of the research work is to carry out tensile-tests of carb<strong>on</strong> nano-structures with<br />
a lot of atoms menti<strong>on</strong>ed in the introducti<strong>on</strong> by the new simulati<strong>on</strong> means. This structure is a Y-juncti<strong>on</strong><br />
which branches are built up from zig-zag type nano-tubes in this case. Here we could determine that the<br />
angular arragement between branches is 120 0 . We show the snaps of pulling-simulati<strong>on</strong> in Figure 1. On the<br />
left Figure we show a basic starting structure. In the middle already the axial pulled structure can be seen.<br />
On the right Figure we displayed the moment before damage. The most loaded b<strong>on</strong>ding in this structure<br />
reaches the critical b<strong>on</strong>d-length at this moment (1,7A). (Figure 2.)<br />
129<br />
Copyright © <str<strong>on</strong>g>2011</str<strong>on</strong>g> by Laboratory Soete
Sustainable C<strong>on</strong>structi<strong>on</strong> and Design <str<strong>on</strong>g>2011</str<strong>on</strong>g><br />
Figure 1. Snaps from the symmetric Y-juncti<strong>on</strong> pulling<br />
Figure 2. Critical b<strong>on</strong>d-length (1.7 Å) inside of node<br />
We show the results of runs carried out <strong>on</strong> asymmetric structure in Figure 3 and 4, where the tensile-test<br />
snaps of carb<strong>on</strong> nanotube Y-juncti<strong>on</strong> can be seen. The pulling takes place in the axial directi<strong>on</strong> of tubes.<br />
According to the first appreciati<strong>on</strong> still <strong>on</strong>ly can be decided that this structure will not rupture inside of node<br />
the b<strong>on</strong>ding nomely here start to el<strong>on</strong>gate in the greatest amount.<br />
Figure 3. The critical b<strong>on</strong>d-length and the damage <strong>on</strong> an asymmetric juncti<strong>on</strong> respectively<br />
Figure 4. The critical b<strong>on</strong>d-length and the damage <strong>on</strong> an another asymmetric juncti<strong>on</strong> respectively<br />
130<br />
Copyright © <str<strong>on</strong>g>2011</str<strong>on</strong>g> by Laboratory Soete
Sustainable C<strong>on</strong>structi<strong>on</strong> and Design <str<strong>on</strong>g>2011</str<strong>on</strong>g><br />
2.2 Symmetric calculating method<br />
During examining nanotube juncti<strong>on</strong>s lights was thrown that the symmetry has got a great effect to its<br />
strength properties<br />
This paper sums up the results reached in the theme c<strong>on</strong>cerning the searching of axial symmetries of<br />
planar c<strong>on</strong>figurati<strong>on</strong>s and examining the similarity of 2D-al<br />
c<strong>on</strong>figurati<strong>on</strong>s.<br />
2.2.1. Method<br />
We search the symmetric axis of the c<strong>on</strong>figurati<strong>on</strong> examined that we<br />
are scanning the plane with the hot direct lines passing through of the<br />
centre of gravity.<br />
During scanning we set out from that theses whereas all symmetrical<br />
axes have to pass through <strong>on</strong> the centre of gravity. We carry out a<br />
calculati<strong>on</strong> method for all direct line passing the centre of gravity which<br />
results we put down. By evaluating of data got this way we select the<br />
spot of approximating and exact symmetry. We display the results<br />
presenting in diagram. During evaluating the diagram we examine the<br />
local maximum values.<br />
During our research work we have drawn up a symmetry searching<br />
algorithm, (Figure 5.) which by it is known in technical literature and can<br />
be applied in case of c<strong>on</strong>figurati<strong>on</strong>s with multiple complex outline, too.<br />
Figure 5. The algorithm<br />
2.2.2. Calculating the symmetry-parameter<br />
The Z symmetry-parameter shows the approximati<strong>on</strong> to the axial symmetry in numerical form. This is a<br />
number between 0 and 1, it can be a certain grade of the symmetry characteristic. We introduce the<br />
following Z parameter for the definiti<strong>on</strong> referring to the k. scanning level:<br />
k<br />
The calculati<strong>on</strong> of Z<br />
k<br />
is simple in that case when <strong>on</strong> <strong>on</strong>e scanning <strong>on</strong>e-<strong>on</strong>e intersecti<strong>on</strong> derives <strong>on</strong> the both<br />
sides of the axis. With the Figure Z. symbols:<br />
abs(<br />
b − j)<br />
Z k<br />
= −<br />
b + j<br />
1 (6)<br />
Where:<br />
b: marks the left-hand side distance measured from symmetry axis of the<br />
perimeter secti<strong>on</strong>.<br />
j: marks the right-hand side distance measured from the symmetry axis<br />
of the perimeter secti<strong>on</strong>.<br />
The Z<br />
k<br />
is designed so if the secti<strong>on</strong> of c<strong>on</strong>figurati<strong>on</strong> with the measuring direct line given is exatly<br />
symmetrical to the axis supposed, then b=j, this Z<br />
k<br />
=1. The better the c<strong>on</strong>figurati<strong>on</strong> approximate to the<br />
symmetric the move it will be nearer the Z<br />
k<br />
to 1 (figure 6).<br />
131<br />
Copyright © <str<strong>on</strong>g>2011</str<strong>on</strong>g> by Laboratory Soete
Sustainable C<strong>on</strong>structi<strong>on</strong> and Design <str<strong>on</strong>g>2011</str<strong>on</strong>g><br />
Figure 6. Explanati<strong>on</strong> of measuring secti<strong>on</strong><br />
The more unfavourable situati<strong>on</strong> is regarding to symmetry when the measuring secti<strong>on</strong> hasn’t got a match<br />
<strong>on</strong> the opposite side of the axis, that is b>0 and j=0, or b=0 and j>0, then Z =0, the smallest value.<br />
As in the (6) c<strong>on</strong>necti<strong>on</strong> the quotient of geometric dimensi<strong>on</strong> occurs,<br />
value does not depend <strong>on</strong> geometrical size.<br />
k<br />
Z<br />
k<br />
is a n<strong>on</strong>dimensi<strong>on</strong>al number, its<br />
If <strong>on</strong> a scanning level there are more than two intersecti<strong>on</strong>s (with Figure 7. markings b 1<br />
, b<br />
2<br />
…. b<br />
n<br />
; j<br />
1<br />
,<br />
j<br />
2<br />
…. j m<br />
) then we place the b<br />
1<br />
and j<br />
1<br />
values into pairs and we form the Z<br />
k<br />
value with (6) c<strong>on</strong>necti<strong>on</strong><br />
from this. If I suppose that more intersecti<strong>on</strong>s are <strong>on</strong> the left-hand side: n>m. then the planning into pairs<br />
has to be made so, that beginning from b<br />
m+ 1<br />
the b<br />
i<br />
(i= m+1,… n) pair should be always j<br />
i<br />
=o (i=m+1,…n).<br />
The Z value in general case is the average of expressi<strong>on</strong>s formed of pairs calculated according to (6).<br />
k<br />
Z<br />
k<br />
n ⎛ abs(<br />
bi<br />
−<br />
= ∑<br />
⎜1−<br />
n i=<br />
1⎝<br />
bi<br />
+ ji<br />
1<br />
1<br />
j ) ⎞<br />
⎟<br />
⎠<br />
(7)<br />
The Z parameter formed, from the<br />
Z<br />
k<br />
average of symmetry parameter<br />
where:<br />
Z<br />
n<br />
∑ Z<br />
k<br />
k = 1<br />
= (8)<br />
N<br />
N: marks the number of scanning levels from timely Y max<br />
to Y<br />
min<br />
. As we form Z value by averaging<br />
according to (z), (8), Z keeps the original characteristic of Z<br />
k<br />
values:<br />
- Z can take up values in (0,1) interval ,<br />
- Z = 1 is the most favourable (exact) case of symmetry,<br />
- Z=0 is the most unfavourable case regarding to symmetry,<br />
- The values between 0 and 1 corresp<strong>on</strong>d to the approximate symmetry all the better the nearer<br />
is Z value to 1.<br />
- Z is a n<strong>on</strong>dimensi<strong>on</strong>al number and its value does not depend <strong>on</strong> the dimensi<strong>on</strong> of plane figure<br />
<strong>on</strong>ly it depends <strong>on</strong> its shape.<br />
132<br />
Copyright © <str<strong>on</strong>g>2011</str<strong>on</strong>g> by Laboratory Soete
Sustainable C<strong>on</strong>structi<strong>on</strong> and Design <str<strong>on</strong>g>2011</str<strong>on</strong>g><br />
Figure 7. The explanati<strong>on</strong> of<br />
Z<br />
k<br />
parameter in case of opti<strong>on</strong>al complicati<strong>on</strong>.<br />
3 CONCLUSIONS<br />
We have developed a method to examine nanotube juncti<strong>on</strong>s.<br />
Based <strong>on</strong> this method the nanotubes can be divided into two groups based <strong>on</strong> the symmetry theory, into<br />
symmetric and asymmetric c<strong>on</strong>figurati<strong>on</strong>s. It is possible to search the symmetry axis of the juncti<strong>on</strong> by a<br />
<strong>on</strong>e axial symmetry rearching method. We search for such c<strong>on</strong>figurati<strong>on</strong>s with theoretical tensile-test of<br />
nanotubes that are optimized against pulling load. The structure of nanotube juncti<strong>on</strong>s have got near such<br />
strength properties than the tubes c<strong>on</strong>nected to it.<br />
We have established that the symmetric and asymmetric juncti<strong>on</strong>s behave differently to the effect of<br />
mechanical loads. The symmetric juncti<strong>on</strong>s get damaged inside of node while the asymmetric juncti<strong>on</strong>s get<br />
damaged at the node and of the nanotube border. We have determined a quick and exact calculating<br />
method to distinguish at these nanotube structures. This program determines exatly whether the nanotube<br />
structure is symmetrical or arymmetrical.<br />
4 REFERENCES<br />
[1] Yu MF, Files BS, Arepalli S, Ruoff R. Tensile loading of ropes of single nanotubes and their mechanical<br />
properties. Phys. Rev. Lett. 2000; 84:5552-5555.<br />
[2] Demczyk BG, Wang YM, et. al. Direct mechanical measurement of the tensile strength and elastic<br />
modulus of multiwalled carb<strong>on</strong> nanotubes. Mater. Sci. and Eng. A 2002; 334:173-178.<br />
[3] Yu MF, Lourie O, Dyer MJ, Mol<strong>on</strong>i K, Kelly TE, Ruoff RS. Strength and breaking mechanism of<br />
multiwalled carb<strong>on</strong> nanotubes under tensile load. Science 2000; 287:637-640.<br />
[4] Fu CX, Chen YF, Jiao JW. Molecular dynamics simulati<strong>on</strong> of the test of single-walled carb<strong>on</strong> nanotubes<br />
under tensile loading. Sci. in China E 2008; 50:7-17.<br />
[5] Mylvaganam K, Zhang LC. Important issues in a molecular dynamics simulati<strong>on</strong> for characterising the<br />
mechanical properties of carb<strong>on</strong> nanotubes. Carb<strong>on</strong> 2004; 42:2025-2032.<br />
[6] Agrawal PM, Sudalayandi BS, et. al. Molacular dynamic simulati<strong>on</strong>s of the dependence of C-C b<strong>on</strong>d<br />
lengths and b<strong>on</strong>d angles <strong>on</strong> the tensile strain in single-wall carb<strong>on</strong> nanotubes, Comput. Mater. Sci<br />
2008;41:450-456.<br />
[7] Duan WH, Wang Q, Liew KM, He XQ. Molecular mechanics modelling of carb<strong>on</strong> nanotube fracture.<br />
Carb<strong>on</strong> 2007; 45:1769-1776.<br />
[8] Belytschko T, et.al. Atomistic simulati<strong>on</strong>s of nanotube fracture. Phys. Rev. B 2002; 65:235430-1-8.<br />
[9] Brenner DW. Empirical potential for hydrocarb<strong>on</strong>s for use in simulating the chemical vapor depositi<strong>on</strong> of<br />
diam<strong>on</strong>d films. Phys. Rev. B 1990; 42:9458-9471.<br />
[10] Zsoldos I., László I.: Computati<strong>on</strong> of the loading diagram and the tensile strength of carb<strong>on</strong> nanotube<br />
networks, Carb<strong>on</strong> 2009; 4:1327–1334<br />
133<br />
Copyright © <str<strong>on</strong>g>2011</str<strong>on</strong>g> by Laboratory Soete
Sustainable C<strong>on</strong>structi<strong>on</strong> and Design <str<strong>on</strong>g>2011</str<strong>on</strong>g><br />
COMPARING STRENGTH PROPERTIES OF NATURAL AND SYNTHETIC<br />
RUBBER MIXTURES<br />
T. Renner, L. Pék<br />
Institute for Mechanical Engineering Technology, Faculty of Mechanical Engineering,<br />
Szent István University, Gödöllő, Hungary<br />
www.geti.gek.szie.hu<br />
Abstract: During in our research work we examine the c<strong>on</strong>diti<strong>on</strong> of developing elastomer – metal<br />
c<strong>on</strong>necti<strong>on</strong> at manufacturing machine – and car industry hybrid parts. As a first step we have carried out<br />
comparis<strong>on</strong> tests relating to the strength properties of synthetic – and natural rubber mixtures. During tests<br />
we have compared four mixtures used often in the practice (NR, NBR, EPDM, CR) in three characteric<br />
hardnesses (43 Sh 0 , 57Sh 0 , 72Sh 0 ). In additi<strong>on</strong> to hardness we have measured the el<strong>on</strong>gati<strong>on</strong> at rupture<br />
and the density, too. As a c<strong>on</strong>tinuati<strong>on</strong> of our tests we researched what c<strong>on</strong>necti<strong>on</strong> is between the surface<br />
roughness of metal plate and the elastomer – metal b<strong>on</strong>ding formed.<br />
Keywords: rubber mixtures, latex, hybrid parts, strength properties<br />
1 INTRODUCTION: CHARACTERIZING THE MIXTURES EXAMINED<br />
The natural rubber is the most often used type of mixture of the rubber industry nowadays which is<br />
produced from the milk-like fluid (from latex) of certain tropical trees. The latex is a colloid state dispersi<strong>on</strong>,<br />
the rubber is precipipated (killed) by acetic – or formic acid from it then is washed, pressed, dried or<br />
smoked [2]. After these the quality classificati<strong>on</strong> takes place then it is packed in to bales and according to<br />
the so called „green book” it is put into commercial circulati<strong>on</strong>. This handbook was accepted by the<br />
<str<strong>on</strong>g>Internati<strong>on</strong>al</str<strong>on</strong>g> Federati<strong>on</strong> of Rubber Producting Nati<strong>on</strong>s in 1960 which is a standard publicati<strong>on</strong> in classifying<br />
rubbers up to present days. The introducti<strong>on</strong> of SMR-system (Standard Malaysian Rubber) in 1965 meant<br />
further development which standardized the mass, packing, etc. of rubber bales. By this possibility arose to<br />
classify the SMR-type based <strong>on</strong> two important characteristics.<br />
a./ according to starting basic material:<br />
- latex basis,<br />
- waste coagulum basis,<br />
- latex + waste coagulum basis,<br />
b./ according to viscosity:<br />
- stabilized viscosity,<br />
- n<strong>on</strong>-stabilized viscosity<br />
So the bulk processing of rubbers according to exact receipt was possible. [1]<br />
The properties of natural rubber mixtures are the followings:<br />
- high static tensile strength (15-22 MPa),<br />
- high el<strong>on</strong>gati<strong>on</strong> (600-900%),<br />
- excellent elasticity at low temperature (up to – 10 0 C doesn’t change substantially)<br />
- poor oz<strong>on</strong>e and degradati<strong>on</strong> stability,<br />
- good c<strong>on</strong>fecti<strong>on</strong>ability because of excellent crude adhesi<strong>on</strong>.<br />
The degradati<strong>on</strong> causes cracks <strong>on</strong> the rubber products however by receipt soluti<strong>on</strong>s and up – to – date<br />
auxiliary products they can be repaired c<strong>on</strong>siderably, so mixtures can be produced to be best suitable for<br />
the applicati<strong>on</strong> required.<br />
Example to the compositi<strong>on</strong> of a natural rubber based mixture. (Table1) [3.].<br />
Table 1.<br />
Naming Mass-rate [%]<br />
Natural rubber 75,1<br />
Wood-tar 1,5<br />
Resin oil 0,8<br />
Stearine acid 1,1<br />
Zinc-oxide 18,8<br />
Sulfur 2,3<br />
Other accelerators 0,5<br />
134<br />
Copyright © <str<strong>on</strong>g>2011</str<strong>on</strong>g> by Laboratory Soete
Sustainable C<strong>on</strong>structi<strong>on</strong> and Design <str<strong>on</strong>g>2011</str<strong>on</strong>g><br />
The butadiene-acrylic-nitril (NBR) rubbers are also often applied types, their greatest advantage is they<br />
have got good resistance against mineral oils and aliphatic solvents, because of this various sealings,<br />
pipes, oil-resisting technical products are made of them. Their technical properties depend <strong>on</strong> the acrylicnitril<br />
c<strong>on</strong>tent substantially thus by increasing this their heat resistance increases but their cold-resistance,<br />
elasticity decreases [1].<br />
The ethylene-propylene (EPDM) rubber is a low density synthetic elastomer (850-900 kg/m 3 ), its hardness<br />
can be changed between wide limits (20-99Sh 0 ). Their producti<strong>on</strong> is complicated, their mixing needs great<br />
attenti<strong>on</strong> whether it is made <strong>on</strong> bowl or in closed mixer. Their c<strong>on</strong>fecti<strong>on</strong> is difficult in c<strong>on</strong>sequence of poor<br />
cold-adhesi<strong>on</strong>, to form appropriate metal binding needs special materials [5]. Their vulcanizing is slower<br />
whether it is made with peroxides or with sulfur + accelarator vulcanizing system, than the natural rubber.<br />
Despite a lot of difficulties they are very widely used materials, rubber boots, pipes, profile straps are made<br />
of them.<br />
Characteristic properties:<br />
- very good heat-resistance (up to 150 0 C),<br />
- oz<strong>on</strong>e – proof,<br />
- excellent electric insulating capability (average volumetric resistance about 10 10 Ohmcm).<br />
One of the most important characteristic is the insulating resistance of the electric insulators and of rubber<br />
mixtures. The ratio of the D.C. voltage c<strong>on</strong>nected to the material and the current value read after 1 min. of<br />
the c<strong>on</strong>necti<strong>on</strong> means the insulating resistance. The 1 min. value is an agreement it serves the<br />
simplificati<strong>on</strong> of measurings and the comparability.<br />
However it has to be kept in <strong>on</strong>e’s mind that the value got is not identical with the real insulating resistance<br />
of the material, which is the ratio of the voltage and of the leakage current.<br />
The chloroprene (CR) rubber has got high density (1300-1350 kg/m 3 ), it is widely used synthetic rubber in<br />
the practice. Their cost price is high, in exchange for this it has got several favourable characteristics:<br />
- weather – and oz<strong>on</strong>e – proof,<br />
- medium heat-resistance (90-100 0 C),<br />
- self-extinguish effect, its oxygen index is 40-50,<br />
- resists mineral oils.<br />
The so called oxygen index gives a very good picture from a mixture burning characteristic, which shows<br />
that what is the smallest amount oxygen in a nitrogen – oxygen mixture at room temperature at which the<br />
burning remains after setting <strong>on</strong> fire. [1].<br />
Its applicati<strong>on</strong> field is mainly pipes, belt c<strong>on</strong>veyor slings.<br />
2 PRESENTING THE RESULTS OF STRENGTH TESTS.<br />
In order to compare the strength characteristics we have made mixture samples from all four materials,<br />
then we decided the vulcanizing optimum. The aim of deciding the optimum was that the values got during<br />
measurings should be the best results to be produced from the mixture given. It is not all the same that a<br />
mixture given in which vulcanizing state is examined and as the vulcanizing speed of the mixture compared<br />
is different for this examinati<strong>on</strong> was needed by all means. We have carried out examinati<strong>on</strong>s with S100<br />
M<strong>on</strong>santo Rheometer for this aim which results c<strong>on</strong>tains the No 1. diagram. The principle of the measuring<br />
is that a standardized rotor with 1,67 Hz frequency, oscillates with 3 0 amplitude in a heated chamber with<br />
determined geometry. The equipment measures the moment needed to drive the rotor in the functi<strong>on</strong> of<br />
time [1]. Figure 1. shows the graphs made with the equipment.<br />
Key words: blue:43 Sh 0 , red: 57Sh 0 , green:72Sh 0 , 170 0 C, 6 min.<br />
135<br />
Copyright © <str<strong>on</strong>g>2011</str<strong>on</strong>g> by Laboratory Soete
Sustainable C<strong>on</strong>structi<strong>on</strong> and Design <str<strong>on</strong>g>2011</str<strong>on</strong>g><br />
136<br />
Copyright © <str<strong>on</strong>g>2011</str<strong>on</strong>g> by Laboratory Soete
Sustainable C<strong>on</strong>structi<strong>on</strong> and Design <str<strong>on</strong>g>2011</str<strong>on</strong>g><br />
Figure 1. Rheological graphs<br />
The O spatial-mesh point is ordered to moment curve minimum, the maximum to the moment curve<br />
maximum. As the maximum point can be defined with difficulty because of this according to the accepted<br />
practice the vulcanizing time of the material is c<strong>on</strong>sidered that time (t g0 ) bel<strong>on</strong>ging to the 90% rising<br />
calculated from the moment curve minimum (according to measurings the tensile strength maximum is<br />
here, too). The time got t 02 bel<strong>on</strong>ging to the 20% rising calculated from the minimum mark.<br />
We summed up the corner – numbers in the No. 2 table from which the vulcanizing time can be determined<br />
to be read from the graphs.<br />
Table 2<br />
Mixture S min S max t 02 t 90<br />
NR 43 Sh 5,98 33,7 0,95 1,96<br />
NR 57 Sh 7,41 37,14 0,9 1,77<br />
NR 72 Sh 8,63 41,36 0,81 1,62<br />
NBR 43 Sh 2,88 24,63 1,00 1,82<br />
NBR 57 Sh 2,87 31,44 0,89 1,58<br />
NBR 72 Sh 8,38 43,4 0,71 1,4<br />
EPDM 43 Sh 3,15 16 1,12 4,17<br />
EPDM 57 Sh 5,1 24,4 1,07 4,46<br />
EPDM 72 Sh 7,26 37,36 1,27 4,67<br />
CR 43 Sh 1,98 27,91 1,61 4,79<br />
CR 57 Sh 2,78 32,52 1,4 4,59<br />
CR 72 Sh 5,96 49,74 1,3 4,7<br />
We have vulcanized specimens for hardness tests for various times from the materials made and we have<br />
carried out hardness tests (No.3 table). The table shows the Sh 0 A hardnesses in the functi<strong>on</strong> of vulcanizing<br />
time.<br />
It can be seen well from the results of No.3 table that the materials change their hardness differently in the<br />
functi<strong>on</strong> of vulcanizing time. The NBR mixtures vulcanize similarly as the NR mixtures, but the last two<br />
elastomer-groups are “slower” substantially. The specimen for tensile test had to be manufactured to l<strong>on</strong>ger<br />
time at latters.<br />
We have vulcanized sheet-specimens before tensile test from all materials for the times marked in table<br />
No.3. After this we carried out the tensile test according to the DIN53504 standard, and we display the<br />
results in the Figure.2. and Figure 3. series [4].<br />
The tensile test parameters:<br />
Type of tensile test machine: LLOYD LR 300<br />
Breaking rate [mm/min]: 500<br />
137<br />
Copyright © <str<strong>on</strong>g>2011</str<strong>on</strong>g> by Laboratory Soete
Sustainable C<strong>on</strong>structi<strong>on</strong> and Design <str<strong>on</strong>g>2011</str<strong>on</strong>g><br />
Cross secti<strong>on</strong> of sheet-specimen [mm 2 ]: 12 (2x6mm)<br />
Ambient temperature [ 0 C]: 23<br />
Relative humidity [%]: 40<br />
Table 3<br />
6 min 8 min 10 min 12 min 14 min<br />
NR 43 42 42 42 42 41<br />
NR 57 56 56 56 55 55<br />
NR 72 72 72 72 72 71<br />
NBR 43 44 44 44 44 43<br />
NBR 57 58 58 58 58 57<br />
NBR 72 70 71 71 71 71<br />
EPDM 43 40 42 44 45 45<br />
EPDM 57 50 52 54 55 55<br />
EPDM 72 70 72 72 72 72<br />
CR 43 40 42 44 45 45<br />
CR 57 50 53 54 57 57<br />
CR 72 70 71 72 72 73<br />
3 THE SURFACE ROUGHNESS EFFECT ONTO ULTIMATE TENSILE LOAD.<br />
The forming of elastomer – metal b<strong>on</strong>ding in industrial scale nowadays is realized by glue produced <strong>on</strong>ly in<br />
industrial circumstances. The general rules of b<strong>on</strong>ding has to be kept at applicati<strong>on</strong> of these materials that<br />
is after chemical cleaning mechanical metal preparati<strong>on</strong> follows, then the glue spraying and finally the<br />
vulcanizing. As a c<strong>on</strong>tinuati<strong>on</strong> of our research work we have examined the effect of surface roughness <strong>on</strong>to<br />
the ultimate tensile load in the sec<strong>on</strong>d phase. We carried out the measurings with metal plate fitted with 23<br />
mm diameter M6x18 mm threaded shank, which we treated steel shot spraying material with different<br />
times. After this we carried out trial vulcanizing and we measured the ultimate tensile load. We show the<br />
results with the help of diagrams. The Figure 3 shows the formati<strong>on</strong> the ultimate tensile load and the R a<br />
average surface roughness in the functi<strong>on</strong> of spraying time in case of steel shot spraying material, while the<br />
No.4 diagram shows the same using corundum.<br />
138<br />
Copyright © <str<strong>on</strong>g>2011</str<strong>on</strong>g> by Laboratory Soete
Sustainable C<strong>on</strong>structi<strong>on</strong> and Design <str<strong>on</strong>g>2011</str<strong>on</strong>g><br />
139<br />
Copyright © <str<strong>on</strong>g>2011</str<strong>on</strong>g> by Laboratory Soete
Sustainable C<strong>on</strong>structi<strong>on</strong> and Design <str<strong>on</strong>g>2011</str<strong>on</strong>g><br />
Figure. 2. Mechanical properties<br />
140<br />
Copyright © <str<strong>on</strong>g>2011</str<strong>on</strong>g> by Laboratory Soete
Sustainable C<strong>on</strong>structi<strong>on</strong> and Design <str<strong>on</strong>g>2011</str<strong>on</strong>g><br />
Figure 3. Effect of the steel shot spraying time<br />
Figure 4. Effect of the corundum spraying time<br />
4 CONCLUSIONS<br />
- It can be seen at the representati<strong>on</strong> in diagram form of the strength results that the strength values<br />
increase with the growth of hardness however the el<strong>on</strong>gati<strong>on</strong> decreases.<br />
- It can be established characteristically that the up-to-date synthetic elastomers strength values are<br />
similar to the natural rubber mixtures, thus the most important deciding standpoint is the<br />
manufacturing capability, taking into account the resistance of products.<br />
- The EPDM rubber mixtures have got visibly very high el<strong>on</strong>gati<strong>on</strong>, at softer mixtures surpass the<br />
natural mixture from time to time, too.<br />
- It is evident from the results of surface roughness examinati<strong>on</strong>s that the R a average surface<br />
roughness is not suitable to characterize unambiguously the preparati<strong>on</strong> of metal plates because of<br />
this as a further development we are going to carry out 3D –al examinati<strong>on</strong>s <strong>on</strong> the metal surfaces<br />
prepared and chemical examinati<strong>on</strong>s <strong>on</strong> the specimens cut into half and <strong>on</strong> the b<strong>on</strong>ding boundary<br />
surfaces respectively.<br />
5 REFERENCES<br />
[1] Dr. Bartha Zoltán: Gumiipari kézikönyv. TAURUS-OMIKK, Budapest, 1988<br />
[2] Dr. Pék Lajos: Anyagszerkezettan és anyagismeret. Dinasztia Kiadó, Budapest, 2000<br />
[3] A. Springer: Gumi technológia. Műszaki Könyvkiadó, 1957.<br />
[4] www.gak.de<br />
[5] www.plastverarbeiter.de<br />
[6] Műanyag és Gumi. 44. évfolyam 6.szám 260p.<br />
141<br />
Copyright © <str<strong>on</strong>g>2011</str<strong>on</strong>g> by Laboratory Soete
Sustainable C<strong>on</strong>structi<strong>on</strong> and Design <str<strong>on</strong>g>2011</str<strong>on</strong>g><br />
NOVEL CYLINDER POSITIONING SYSTEM REALISED BY USING<br />
SOLENOID VALVES<br />
L. Földi, Z. Béres, E. Sárközi<br />
Institute for Mechanical Engineering Technology, Faculty of Mechanical Engineering<br />
Szent István University, Gödöllő, Hungary, www.geti.gek.szie.hu<br />
Abstract This paper presents a novel c<strong>on</strong>trol design, developed to realise fast and accurate positi<strong>on</strong><br />
c<strong>on</strong>trol of a pneumatic actuator using inexpensive <strong>on</strong>/off solenoid valves. In c<strong>on</strong>trast to c<strong>on</strong>venti<strong>on</strong>al c<strong>on</strong>trol<br />
methods, the proposed c<strong>on</strong>trol method operates chatter free, based <strong>on</strong> air compressi<strong>on</strong>. The c<strong>on</strong>trol<br />
principle was developed by investigating the dynamics of a pneumatic actuator with an identified<br />
mathematical model. This new approach is applied to a pneumatic double acting cylinder, c<strong>on</strong>trolled by a<br />
pair of 5/3 way directi<strong>on</strong>al single solenoid valves. The described closed-loop circuit copes with the<br />
disc<strong>on</strong>tinuities associated with the valve’s switching dynamics, and relatively l<strong>on</strong>g resp<strong>on</strong>se time. The<br />
experimental apparatus uses an analogue displacement encoder for metering the pist<strong>on</strong>’s positi<strong>on</strong> and<br />
velocity, and doesn’t incorporate pressure sensors thus ensuring a low cost system design. The results of<br />
experiments with various step resp<strong>on</strong>ses show that the proposed c<strong>on</strong>trol method performs well. The<br />
measured steady-state positi<strong>on</strong> errors are equal to the used potentiometer’s travel resoluti<strong>on</strong>, which is 0,01<br />
mm. Therefore this novel c<strong>on</strong>trol and the related pneumatic system design could be a cost effective<br />
alternative to the servo-pneumatic positi<strong>on</strong>ing systems.<br />
Keywords: Positi<strong>on</strong> C<strong>on</strong>trol, Solenoid Valve, Pneumatic Cylinder, C<strong>on</strong>trol Method, Actuator<br />
1. INTRODUCTION<br />
In order to achieve linear moti<strong>on</strong>, pneumatic, electromagnetic<br />
and hydraulic actuators are typically used. Due to their<br />
advantageous characteristics in positi<strong>on</strong> c<strong>on</strong>trol applicati<strong>on</strong>s<br />
the latter two are more widespread. Though using hydraulic<br />
actuators high velocity and great force is achievable, and their<br />
positi<strong>on</strong> c<strong>on</strong>trol can also be relatively easily solved, a handicap<br />
is that the leaking of hydraulic fluids might c<strong>on</strong>taminate the<br />
workpiece. Electromagnetic actuators <strong>on</strong> the other hand are<br />
clean and reliable in their operati<strong>on</strong> but often require a<br />
mechanical transmissi<strong>on</strong>, both to c<strong>on</strong>vert high speed and low<br />
torque to a more useful combinati<strong>on</strong> and to c<strong>on</strong>vert rotary<br />
moti<strong>on</strong> to linear moti<strong>on</strong>. While linear motors overcome the<br />
need for transmissi<strong>on</strong>, they can be expensive [9].<br />
Pneumatic actuators have several advantages: they are fast, Figure 1. The experiment apparatus<br />
cheap, have an outstanding power-to-weight ratio, are easily<br />
maintainable and they d<strong>on</strong>’t c<strong>on</strong>taminate the work piece. The challenge to the use of pneumatic drives is<br />
that due to pist<strong>on</strong> fricti<strong>on</strong> and the characteristics of compressed gas flow their behaviour is n<strong>on</strong>-linear. As a<br />
result their industrial use is <strong>on</strong>ly widespread in applicati<strong>on</strong>s which require linear moti<strong>on</strong>s between end<br />
positi<strong>on</strong>s.<br />
In the last decade such industrial c<strong>on</strong>trollers became available which have adequate computing capacity for<br />
real-time usage. Thus there is now opportunity to develop pneumatic systems which d<strong>on</strong>’t require costly<br />
proporti<strong>on</strong>al valves for positi<strong>on</strong>ing and hence the usage of the more cost-efficient solenoid valves became<br />
possible (Figure 1.). These simple <strong>on</strong>/off valves are cheap and easily maintainable. Their drawback<br />
however is that as yet the required c<strong>on</strong>trol method is not appropriately elaborate: the soluti<strong>on</strong>s offered in<br />
the scarce publicati<strong>on</strong>s <strong>on</strong> the topic c<strong>on</strong>sist of applying c<strong>on</strong>venti<strong>on</strong>al c<strong>on</strong>trol methods (PID, sliding mode,<br />
fuzzy logic) or their hybrid versi<strong>on</strong>s, with varying success.<br />
A review of the papers <strong>on</strong> the topic is given in Table 1, where the applied c<strong>on</strong>trol methods, the number of<br />
required valves and the highest positi<strong>on</strong>ing accuracy is shown. Even though it is not indicated in the table,<br />
in some cases certain speed or force decreasing soluti<strong>on</strong>s (eg. throttle valve, reduced pressure) were used,<br />
which naturally may have an effect <strong>on</strong> the operating range of the positi<strong>on</strong>ing system and the steady-state<br />
error. The employed valve’s switching time is also omitted from the table.<br />
142<br />
Copyright © <str<strong>on</strong>g>2011</str<strong>on</strong>g> by Laboratory Soete
Sustainable C<strong>on</strong>structi<strong>on</strong> and Design <str<strong>on</strong>g>2011</str<strong>on</strong>g><br />
Number in<br />
References<br />
[9]<br />
Authors<br />
Thomas, M.B.; Maul, G.P.;<br />
Jayawiyanto, E.<br />
[1] Ahn, K.; Yokota, S.<br />
[7]<br />
[6]<br />
Parnichkun, M.;<br />
Ngaecharoenkul, C.<br />
Nguyen, T.; Leavitt, J.;<br />
Jabbari, F.; Bobrow, J.E.<br />
[8] Shih, M.-C.; Ma, M.-A.<br />
C<strong>on</strong>trol method<br />
Modified PD + PWM<br />
c<strong>on</strong>trol<br />
MPWM + neural<br />
network (LVQNN)<br />
hybrid of fuzzy and<br />
PID + PWM c<strong>on</strong>trol<br />
Number of<br />
required<br />
valves<br />
Positi<strong>on</strong>ing<br />
accuracy<br />
3 ±0,1 mm<br />
8 ±0,2 mm<br />
1 ±3,5 mm<br />
Sliding mode c<strong>on</strong>trol 4 ±0,1 mm<br />
Fuzzy + modified<br />
differential PWM<br />
c<strong>on</strong>trol<br />
Individual c<strong>on</strong>trol +<br />
PWM<br />
Individual linear<br />
c<strong>on</strong>tinuous + PWM<br />
2 +<br />
Proporti<strong>on</strong>al<br />
pressure valve<br />
±0,075 mm<br />
[5]<br />
Messina, A.; Giannoccaro,<br />
N.I.; Gentile, A.<br />
2 ±0,1 mm<br />
[3]<br />
Barth, E.J.; Zhang, J.;<br />
Goldfarb M.<br />
2 N/A<br />
[2] Akdağ, F.N.; Kuzucu, A. Sliding mode c<strong>on</strong>trol 2 ±0,05 mm<br />
[10]<br />
van Varseveld, R.B.; B<strong>on</strong>e, PID with fricti<strong>on</strong><br />
G.M.<br />
compensati<strong>on</strong> + PWM<br />
2 ±0,21 mm<br />
2. MATHEMATICAL AND SIMULATION MODEL<br />
Table 1. A review of the papers <strong>on</strong> the topic<br />
We carried out the design work of our proposed c<strong>on</strong>trol strategy based <strong>on</strong> an identified simulati<strong>on</strong> model [4]<br />
of the actual apparatus. In order to develop this system we applied equati<strong>on</strong>s number (1) and (2); using<br />
these we can express the mass flow filling the chambers of the cylinder as follows:<br />
<br />
2<br />
m = A ⋅p<br />
⋅ ⋅ψ<br />
R⋅T<br />
1 1 sup ( p1 / psup<br />
)<br />
(1)<br />
<br />
2<br />
m = A ⋅p<br />
⋅ ⋅ψ<br />
R⋅T<br />
2 2 2 ( patm<br />
/ p2<br />
)<br />
The outflow functi<strong>on</strong>s (ψ) in the equati<strong>on</strong>s are <strong>on</strong>e of the major causes of the n<strong>on</strong>linear behaviour of the<br />
pist<strong>on</strong>s. Knowing the mass flows, the pressures in the cylinder’s chambers can be expressed through the<br />
gas law’s derivative with respect to time:<br />
<br />
1<br />
p = ⋅( ⋅ ⋅ − ⋅ <br />
1<br />
m1 R T p1 V1)<br />
(3)<br />
V<br />
1<br />
(<br />
)<br />
<br />
1<br />
p2 = ⋅ p2 ⋅V2 −m2<br />
⋅R⋅T<br />
V<br />
2<br />
Using the pressures and knowing the physical parameters of the pist<strong>on</strong> the mechanical equati<strong>on</strong><br />
complemented with the mass loads is as follows. Again, a term causing n<strong>on</strong>-linearity appears: fricti<strong>on</strong> (Ff).<br />
2<br />
m ⋅ x = p ⋅ − ⋅ − ⋅ − ⋅ ⋅ α − ⋅ ⋅ <br />
1<br />
A1 p2 A2 F sign( x) m g sn i j ( x) sign( x )<br />
(5)<br />
f<br />
The last term in the equati<strong>on</strong> is the pipe fricti<strong>on</strong> loss which, according to our observati<strong>on</strong>s is a significant<br />
factor in practice but is ignored in the specialised literature we made use of. This fricti<strong>on</strong> loss was taken into<br />
c<strong>on</strong>siderati<strong>on</strong> with a fricti<strong>on</strong> factor (j) multiplied by the square of velocity.<br />
Using the presented equati<strong>on</strong>s we were able to c<strong>on</strong>struct the proposed c<strong>on</strong>trol system’s simulati<strong>on</strong> model in<br />
Matlab/Simulink software. After completing the identificati<strong>on</strong> process of the model’s parameters, we were<br />
able to effectively analyse some of the c<strong>on</strong>venti<strong>on</strong>al c<strong>on</strong>trol methods. As a result we decided to elaborate a<br />
novel c<strong>on</strong>trol strategy, which copes with the disc<strong>on</strong>tinuities associated with the valve’s switching dynamics,<br />
and relatively l<strong>on</strong>g resp<strong>on</strong>se time.<br />
(2)<br />
(4)<br />
143<br />
Copyright © <str<strong>on</strong>g>2011</str<strong>on</strong>g> by Laboratory Soete
Sustainable C<strong>on</strong>structi<strong>on</strong> and Design <str<strong>on</strong>g>2011</str<strong>on</strong>g><br />
3. CONTROL METHOD<br />
Designing the c<strong>on</strong>trol method we determined to apply two solenoid valves (<strong>on</strong>e for each chamber), the<br />
biggest benefit of which is that the number of c<strong>on</strong>trol signals is thus raised to the sec<strong>on</strong>d power.<br />
Number of<br />
variati<strong>on</strong><br />
Signal of<br />
solenoid<br />
valve 1<br />
Signal of<br />
solenoid<br />
valve 2<br />
Movement of the cylinder pist<strong>on</strong><br />
1 fill empty positive directi<strong>on</strong>, fast<br />
2 fill close positive directi<strong>on</strong>, slow<br />
3 fill fill immobile<br />
4 close empty positive directi<strong>on</strong>, unc<strong>on</strong>trolled<br />
5 close close first immobile, then unc<strong>on</strong>trolled<br />
6 close fill negative directi<strong>on</strong>, slow<br />
7 empty empty accidental directi<strong>on</strong>, unc<strong>on</strong>trolled<br />
8 empty close negative directi<strong>on</strong>, unc<strong>on</strong>trolled<br />
9 empty fill negative directi<strong>on</strong>, fast<br />
Table 2. Available variati<strong>on</strong>s using two solenoid valves<br />
Out of the variati<strong>on</strong>s presented in Table 2, we ignored the unc<strong>on</strong>trolled <strong>on</strong>es (where pressure in both<br />
chambers changes in an unc<strong>on</strong>trolled way) which thus leaves us with five useful solenoid valve variati<strong>on</strong>s.<br />
However, in order to stop the movement of the cylinder pist<strong>on</strong> in variati<strong>on</strong> number 3, a complementary<br />
element had to be introduced (due to the asymmetric c<strong>on</strong>structi<strong>on</strong> of the cylinder we used). Using a<br />
pressure regulator, the positive chamber was filled with supply pressure decreased in proporti<strong>on</strong> to the<br />
surfaces of the pist<strong>on</strong>. As a result a balance of force was reached based <strong>on</strong> equati<strong>on</strong> number (5).<br />
As a first step we started out from a graph representati<strong>on</strong>, where time and positi<strong>on</strong> were placed <strong>on</strong> the<br />
axes. This way the most important c<strong>on</strong>trol parameter, the error (difference between a measured process<br />
variable and a desired set-point) can be visualized easily if we represent both the ideal and the actual<br />
positi<strong>on</strong> values (reference signal and measured output respectively) plotted against the elapsed time.<br />
Based <strong>on</strong> the scale of the error we might form predicti<strong>on</strong>s as to which valve variati<strong>on</strong> has to be realized by<br />
the c<strong>on</strong>trol method in order to decrease the absolute value of the error.<br />
Number of c<strong>on</strong>trol<br />
signal<br />
Relati<strong>on</strong> between<br />
reference signal and<br />
measured output<br />
Desired pist<strong>on</strong><br />
movement<br />
Number of<br />
variati<strong>on</strong> in<br />
Table 2<br />
1 r >> y m positive directi<strong>on</strong>, fast 1<br />
2 r > y m positive directi<strong>on</strong>, slow 2<br />
3 r ≈ y m immobile 3<br />
4 r < y m negative directi<strong>on</strong>, slow 6<br />
5 r
Sustainable C<strong>on</strong>structi<strong>on</strong> and Design <str<strong>on</strong>g>2011</str<strong>on</strong>g><br />
Since the width of the tolerance band is a parameter given during utilizati<strong>on</strong>, the c<strong>on</strong>trol method <strong>on</strong>ly has to<br />
determine the width of bands number 2 and 4 in a given moment. By rendering the respective valve<br />
variati<strong>on</strong>s to the given bands, the solenoid valves can be c<strong>on</strong>trolled harm<strong>on</strong>iously and in an essentially<br />
discrete way, with few valve switches, i.e. chatter free.<br />
In order to determine the width of the bands we can set up the following equati<strong>on</strong> based <strong>on</strong> the work-energy<br />
theorem:<br />
1 2 pb<br />
⋅A⋅ ( q + z)<br />
pa<br />
0 − ⋅m⋅ v = −( ⋅R⋅T<br />
⋅ln )<br />
2<br />
R⋅T<br />
p<br />
Of the terms of the equati<strong>on</strong> pa and pb are the initial and final pressures of the closed chamber, q is the<br />
distance needed to stop the pist<strong>on</strong> while z is the remaining distance. Setting up the equati<strong>on</strong> we regarded<br />
the process to be isothermal, thus we overestimated the necessary distance to stop the pist<strong>on</strong>, this way<br />
compensating for the losses which appear in the positi<strong>on</strong>ing system.<br />
After reducing the values regarded as c<strong>on</strong>stants and expressing q from the equati<strong>on</strong>, we come to the<br />
following relati<strong>on</strong>:<br />
b<br />
2<br />
q = c ⋅v −z (7)<br />
2<br />
The equati<strong>on</strong> shows that the ideal decelerati<strong>on</strong> distance of the pist<strong>on</strong> (q) changes according to a sec<strong>on</strong>ddegree<br />
functi<strong>on</strong> of pist<strong>on</strong> speed. It follows that the widths of the decelerati<strong>on</strong> bands of the pist<strong>on</strong> have to be<br />
adjusted in a given moment proporti<strong>on</strong>al to the square of the measured output’s first derivative; at this point<br />
a proporti<strong>on</strong>al coefficient (c2) has to be introduced. Furthermore, it is also necessary to set a c<strong>on</strong>stant c1<br />
bandwidth which guarantees the slow movement near the ideal value.<br />
As the next step, we have to assign the adequate c<strong>on</strong>trol signs to the bands. This is d<strong>on</strong>e in a similar way<br />
to the operati<strong>on</strong> of a relay, by sign functi<strong>on</strong>s, which decide whether the pist<strong>on</strong>’s measured output is below<br />
or above the band limit set. Summing up the values of these sign functi<strong>on</strong>s we arrive at 4 discrete numeric<br />
values which unequivocally determine which band the measured output falls into (e.g. we get -3 if it is<br />
below all band limits, i.e. in band number 1). By assigning the adequate c<strong>on</strong>trol signs to these numeric<br />
values and to the tolerance band around the ideal positi<strong>on</strong> we achieve a c<strong>on</strong>trol method which satisfies the<br />
criteria set.<br />
In accordance with notati<strong>on</strong>s of c<strong>on</strong>trol engineering, the mathematical descripti<strong>on</strong> of the c<strong>on</strong>trol method is<br />
as follows: r stands for the reference signal, while ym is the measured output, t means tolerance and F;C;E<br />
are respectively the filling, closing and emptying switch states of the first and sec<strong>on</strong>d solenoid valves:<br />
{ }<br />
{ ( ) } ( <br />
m 1 2 m m m 3 4 m)<br />
2 2<br />
sign y −⎡r − ( c + c ⋅ y ) ⎤ + sign ( y − r ) + sign y − ⎡r + ( c + c ⋅ y ) ⎤ = k<br />
⎣ ⎦ ⎣ ⎦<br />
(6)<br />
[ ]<br />
[ ]<br />
[ ]<br />
[ ]<br />
[ ]<br />
if y − r < t, then ⇒ c<strong>on</strong>t = F;<br />
F<br />
m<br />
⎧ if k = −3 ⇒ c<strong>on</strong>t = F;<br />
E<br />
⎪<br />
⎪if k = −1 ⇒ c<strong>on</strong>t = F;<br />
C<br />
if ym<br />
− r > t,<br />
then ⎨<br />
⎪ if k = 1 ⇒ c<strong>on</strong>t = C ; F<br />
⎪<br />
⎩if k = 3 ⇒ c<strong>on</strong>t = E;<br />
F<br />
(8)<br />
The c<strong>on</strong>stants c3 and c4 figuring in the equati<strong>on</strong> have the same functi<strong>on</strong> as the already known c1 and c2<br />
c<strong>on</strong>stants; their introducti<strong>on</strong> into the equati<strong>on</strong> is necessary because of the asymmetric setting opti<strong>on</strong>s which<br />
reflect the asymmetry of the cylinder.<br />
The behaviour of the system is calculable and compared to the examples in the specialized literature the<br />
command signal operates at a lower frequency; thus, due to the smaller amount of gas let into the<br />
envir<strong>on</strong>ment the efficiency of the overall system is increased. It is worth noting that the system is capable of<br />
adjusting itself to the reference signal even if per chance we have chosen too high parameters at the<br />
c<strong>on</strong>trol settings. In this case the balance of force required to stop the cylinder pist<strong>on</strong> sets in earlier than<br />
necessary, but since we <strong>on</strong>ly fill <strong>on</strong>e of the chambers (see bands number 2 and 4) in the other chamber the<br />
pressure will slowly decrease, which is a c<strong>on</strong>sequence of the ever-present cylinder loss. The force arising<br />
from this pressure difference will always slowly move the pist<strong>on</strong> to its ideal positi<strong>on</strong>. This is advantageous<br />
because this way, as far as the positi<strong>on</strong>ing systems most significant quality factor, the steady-state error is<br />
145<br />
Copyright © <str<strong>on</strong>g>2011</str<strong>on</strong>g> by Laboratory Soete
Sustainable C<strong>on</strong>structi<strong>on</strong> and Design <str<strong>on</strong>g>2011</str<strong>on</strong>g><br />
c<strong>on</strong>cerned, we can say that our system operates without predefined working-positi<strong>on</strong>s. Another great<br />
advantage is that in spite of the low frequency and delays of the solenoid valves we are able to make the<br />
pist<strong>on</strong> stop with a high accuracy thanks to the slow movement around the reference signal.<br />
4. APPARATUS<br />
The circuit diagram of the pneumatic positi<strong>on</strong>ing system is presented <strong>on</strong> figure number 5. As an actuator<br />
we applied a Festo DSNU-20-100-PPV-A P606 cylinder of 100mm stroke length, to which we attached a<br />
Festo MLO-POT-225-LWG analogue displacement encoder, which has a 0,01 mm travel resoluti<strong>on</strong>. The<br />
applied encoder is a potentiometer which provides a voltage signal in proporti<strong>on</strong> to the displacement. In<br />
order to move the cylinder we applied two Festo VSVA-B-P53C-H-A2-1R2L 5/3 way solenoid valves, but<br />
we <strong>on</strong>ly used <strong>on</strong>e output c<strong>on</strong>necti<strong>on</strong> each and the remaining output ports were plugged. We measured the<br />
menti<strong>on</strong>ed solenoid valve’s ON and OFF switching time at 6 bar supply pressure; in case of switching <strong>on</strong> it<br />
was 14 ms (Figure 3.) while at switching off 36 ms (Figure 4.).<br />
Figure 3. Valve switching – On<br />
Figure 4. Valve switching - Off<br />
A further c<strong>on</strong>stituent is a Festo D:LR-1/8-0-MINI pressure regulator, and we also c<strong>on</strong>nected a Festo SDE1-<br />
D10-G2-H18-C-PU-M8 pressure sensor to both chambers to serve as feedback, which however we did not<br />
use in the c<strong>on</strong>trol process in order to minimize the number of sensors necessary for the operati<strong>on</strong> of the<br />
system. This system was c<strong>on</strong>structed to test the planned c<strong>on</strong>trol method but by changing the different<br />
elements of the scheme, it can be freely scaled to achieve a faster operati<strong>on</strong> or the movement of heavier<br />
loads.<br />
Figure 5. The circuit diagram of the pneumatic positi<strong>on</strong>ing system<br />
The major elements of the electr<strong>on</strong>ic system are a 0-24 V direct current power supply (NI PS-15), an<br />
electr<strong>on</strong>ic instrument board (Festo), a NI CompactRIO (cRIO 9073) programmable automati<strong>on</strong> c<strong>on</strong>troller<br />
and the already menti<strong>on</strong>ed electro-pneumatic elements (displacement encoder, pressure sensors and<br />
solenoid valves). The applied NI CompactRIO programmable automati<strong>on</strong> c<strong>on</strong>troller is a modular system;<br />
out of its modules we used the analogue-to-digital c<strong>on</strong>verter (NI 9201), for a dual purpose. On the <strong>on</strong>e hand<br />
we applied it in the c<strong>on</strong>trolling process to measure the voltage signal (which is in proporti<strong>on</strong> to the<br />
146<br />
Copyright © <str<strong>on</strong>g>2011</str<strong>on</strong>g> by Laboratory Soete
Sustainable C<strong>on</strong>structi<strong>on</strong> and Design <str<strong>on</strong>g>2011</str<strong>on</strong>g><br />
displacement) provided by the displacement encoder. On the other hand we used it in collecting data about<br />
the voltage signals corresp<strong>on</strong>ding to pressure values (expressed in bars) provided by the analogue<br />
pressure sensors. We c<strong>on</strong>trolled the two solenoid valves with the help of the digital output module (NI<br />
9472). The communicati<strong>on</strong> between the CompactRIO and the computer was ensured by an Ethernet<br />
c<strong>on</strong>necti<strong>on</strong>. We realised the real-time c<strong>on</strong>trol based <strong>on</strong> equati<strong>on</strong> number (8) by applying the FPGA module<br />
of CompactRIO programming it in the LabVIEW 2009 software.<br />
5. MEASUREMENT RESULTS<br />
The testing of the compiled system was d<strong>on</strong>e by determining the quality factors of the c<strong>on</strong>trol method.<br />
During this process we have determined the settling time for step resp<strong>on</strong>ses from end positi<strong>on</strong>s, overshoots<br />
and steady-state error graphically based <strong>on</strong> measurement results. Under settling time we c<strong>on</strong>venti<strong>on</strong>ally<br />
understand the time required for the measured output to finally reach the ± 5% vicinity of the reference<br />
signal.<br />
The moved load was m=0.542 kg, the value of supply pressure in the case of the negative chamber was<br />
p2=6·105 Pa, and accordingly the decreased supply pressure of the positive chamber was<br />
A2<br />
5<br />
p1 = ⋅ p2<br />
= 5,04 ⋅10<br />
Pa<br />
A1<br />
. The measurements were carried out at room temperature.<br />
The c<strong>on</strong>trol setting parameters were c1=18 [mm], c2=950 [-], c3=18 [mm], c4=250 [-]; based <strong>on</strong> previous<br />
experiences with the system the width of the tolerance band was set to be ± 0.025 mm, we regarded the<br />
positi<strong>on</strong> as adequate within this range.<br />
First we tested the dislocati<strong>on</strong>s of the cylinder pist<strong>on</strong> in the positive directi<strong>on</strong>, i.e. when the pist<strong>on</strong> was<br />
moving outwards of the cylinder.<br />
Figure 6. Step resp<strong>on</strong>se - 0-10 mm<br />
In Figure 6. we examined a settling <strong>on</strong>to the 10 mm reference signal from initial positi<strong>on</strong>, which is 10% of<br />
the stroke length of the cylinder. At such a small change of positi<strong>on</strong> the c<strong>on</strong>trol system works in the<br />
decelerati<strong>on</strong> z<strong>on</strong>e (2) all the way through, i.e. the speed of the displacement of the pist<strong>on</strong> is <strong>on</strong>ly dependent<br />
up<strong>on</strong> the cylinder loss. It is visible that the settling time is under 2 sec<strong>on</strong>ds, the overshoot can be<br />
c<strong>on</strong>sidered minor. The steady-state error is greater than the resoluti<strong>on</strong> of the displacement encoder, but it<br />
nevertheless remained within the tolerance band and is still better than most of the best values to be found<br />
in the specialised literature.<br />
147<br />
Copyright © <str<strong>on</strong>g>2011</str<strong>on</strong>g> by Laboratory Soete
Sustainable C<strong>on</strong>structi<strong>on</strong> and Design <str<strong>on</strong>g>2011</str<strong>on</strong>g><br />
Figure 7. Step resp<strong>on</strong>se - 0-50 mm<br />
The evaluati<strong>on</strong> of the sec<strong>on</strong>d test (Figure 7.) sheds light <strong>on</strong> the limits of our positi<strong>on</strong>ing system, given that in<br />
the case of the settling to the 50 mm reference signal a significant overshoot was observed. This is the<br />
c<strong>on</strong>sequence of the fact that the chamber filling at the adjusted supply pressure is fast and because of this<br />
the accelerati<strong>on</strong> of the low-fricti<strong>on</strong> cylinder pist<strong>on</strong> is too great to be followed by the c<strong>on</strong>trol system. This is<br />
the c<strong>on</strong>sequence of the operating limits of valves with l<strong>on</strong>g switching time. The decelerati<strong>on</strong> of the pist<strong>on</strong><br />
movement, i.e. the closing of the ventilated chamber begins later than would be ideal, which is why the<br />
significant overshoot and the same settling time appear. It is important to be noted though, that all these do<br />
not influence the positi<strong>on</strong>ing accuracy, i.e. the steady-state error is equivalent to the travel resoluti<strong>on</strong> of the<br />
displacement encoder.<br />
Figure 8. Step resp<strong>on</strong>se - 0-90 mm<br />
At the third measurement (Figure 8.) we have examined a displacement which is l<strong>on</strong>g compared to the<br />
stroke length of the cylinder by setting the reference signal at 90 mm. It is visible that in the case of large<br />
step size the c<strong>on</strong>trol method is able to follow the dynamics of the cylinder, the overshoot is minimal while<br />
the settling time is 1 sec<strong>on</strong>d. The steady-state error is again equivalent to the travel resoluti<strong>on</strong> of the<br />
displacement encoder.<br />
After this we examined the movement of the pist<strong>on</strong> in the negative directi<strong>on</strong>, namely when it moves<br />
backwards into the cylinder.<br />
148<br />
Copyright © <str<strong>on</strong>g>2011</str<strong>on</strong>g> by Laboratory Soete
Sustainable C<strong>on</strong>structi<strong>on</strong> and Design <str<strong>on</strong>g>2011</str<strong>on</strong>g><br />
Figure 9. Step resp<strong>on</strong>se - 100-10 mm<br />
In the course of the fourth test at Figure 9. we can see a displacement similarly great to the previous<br />
experiment, but in the negative directi<strong>on</strong>. The overshoot is minimal, and the settling time is still under 2<br />
sec<strong>on</strong>ds. The steady-state error is <strong>on</strong>ce again equivalent to the resoluti<strong>on</strong> of the displacement encoder.<br />
Figure 10. Step resp<strong>on</strong>se - 100-50 mm<br />
The fifth measurement (Figure 10.) examined a movement in the negative directi<strong>on</strong> the scale of which is<br />
50% of the stroke length of the pist<strong>on</strong>. It is visible that an overshoot similar to that of the sec<strong>on</strong>d testing<br />
appears. The steady-state error is minor, and in this case the settling time is excepti<strong>on</strong>ally good, which is<br />
partly due to the fact that the pist<strong>on</strong> moves faster in the negative directi<strong>on</strong> because of the asymmetric<br />
c<strong>on</strong>structi<strong>on</strong> of the cylinder.<br />
149<br />
Copyright © <str<strong>on</strong>g>2011</str<strong>on</strong>g> by Laboratory Soete
Sustainable C<strong>on</strong>structi<strong>on</strong> and Design <str<strong>on</strong>g>2011</str<strong>on</strong>g><br />
Figure 11. Step resp<strong>on</strong>se - 100-90 mm<br />
In the last, sixth testing (Figure 11.) we observed the small-scale negative movement with a displacement<br />
from 100 mm to 90 mm. The movement of the pist<strong>on</strong> remains in the decelerati<strong>on</strong> band (4) all the way<br />
through, thus the speed of displacement is <strong>on</strong>ly dependent up<strong>on</strong> the cylinder loss. As a result, the settling<br />
time is significant, but the overshoot is minimal and the steady-state error is almost equivalent to the travel<br />
resoluti<strong>on</strong> of the displacement encoder.<br />
6. SUMMARY<br />
A novel c<strong>on</strong>trol strategy and the according experimental apparatus to achieve accurate positi<strong>on</strong>ing of a<br />
pneumatic cylinder using solenoid valves is presented. The most significant features of this pneumatic<br />
positi<strong>on</strong>ing system are the following:<br />
• it substitutes the costly proporti<strong>on</strong>al valve with the c<strong>on</strong>venti<strong>on</strong>al solenoid valve<br />
• thanks to a novel c<strong>on</strong>trol design, the system operates in a chatter free way<br />
• the maximal operating velocity and force of the applied pneumatic actuator is not decreased<br />
• it c<strong>on</strong>tains the least amount of sensors and the least expensive electro-pneumatic elements possible<br />
Thanks to all these, the system can achieve an adequately high positi<strong>on</strong>ing accuracy and reach a<br />
favourable price/value ratio at the same time. The paper also sheds light <strong>on</strong> the fact that the system’s<br />
steady-sate error is highly dependent <strong>on</strong> the displacement encoder’s travel resoluti<strong>on</strong>. This holds out the<br />
promise that the applicati<strong>on</strong> of more advanced technology in the area (e.g. using digital sensor with higher<br />
travel resoluti<strong>on</strong>, or a fast-switching solenoid valve to reduce the overshoot) will further improve the<br />
system’s positi<strong>on</strong>ing accuracy.<br />
7. REFERENCES<br />
[1] Ahn, K., Yokota, S., Intelligent switching c<strong>on</strong>trol of pneumatic actuator using <strong>on</strong>/off solenoid valves,<br />
Mechatr<strong>on</strong>ics,15, 683–702, 2005.<br />
[2] Akdağ, F.N., Kuzucu, A., Highly accurate pneumatic positi<strong>on</strong> c<strong>on</strong>trol, Istanbul Technical University<br />
Mechanical Engineering Department, http://digital.ni.com/<br />
[3] Barth, E.J., Zhang, J., Goldfarb, M., C<strong>on</strong>trol Design for Relative Stability in a PWM-C<strong>on</strong>trolled<br />
Pneumatic System, Journal of Dynamic Systems, Measurement, and C<strong>on</strong>trol, 125, 504-508, 2003.<br />
[4] Isermann, R., Mechatr<strong>on</strong>ic systems : Fundamentals, Springer, L<strong>on</strong>d<strong>on</strong>, 2005.<br />
[5] Messina, A., Giannoccaro, N.I., Gentile, A., Experimenting and modelling the dynamics of pneumatic<br />
actuators c<strong>on</strong>trolled by the pulse width modulati<strong>on</strong> (PWM) technique, Mechatr<strong>on</strong>ics, 15, 859–881,<br />
2005.<br />
150<br />
Copyright © <str<strong>on</strong>g>2011</str<strong>on</strong>g> by Laboratory Soete
Sustainable C<strong>on</strong>structi<strong>on</strong> and Design <str<strong>on</strong>g>2011</str<strong>on</strong>g><br />
[6] Nguyen, T., Leavitt, J., Jabbari, F., Bobrow, J.E., Accurate Sliding-Mode C<strong>on</strong>trol of Pneumatic Systems<br />
Using Low-Cost Solenoid Valves, IEEE/ASME Transacti<strong>on</strong>s <strong>on</strong> mechatr<strong>on</strong>ics, 12(2), 216-219, 2007.<br />
[7] Parnichkun, M., Ngaecharoenkul, C., Kinematics c<strong>on</strong>trol of a pneumatic system by hybrid fuzzy PID,<br />
Mechatr<strong>on</strong>ics, 11, 1001-1023, 2001.<br />
[8] Shih, M.-C., Ma, M.-A., Positi<strong>on</strong> c<strong>on</strong>trol of a pneumatic cylinder using fuzzy PWM c<strong>on</strong>trol method,<br />
Mechatr<strong>on</strong>ics, 8, 241-253, 1998.<br />
[9] Thomas, M.B., Maul, G.P., Jayawiyanto, E., A Novel, Low-Cost Pneumatic Positi<strong>on</strong>ing System, Journal<br />
of Manufacturing Systems, 24(4), 377-387, 2005.<br />
[10] van Varseveld, R.B., B<strong>on</strong>e, G.M., Accurate positi<strong>on</strong> c<strong>on</strong>trol of a pneumatic actuator using <strong>on</strong>/off<br />
solenoid valves, IEEE/ASME Transacti<strong>on</strong>s <strong>on</strong> Mechatr<strong>on</strong>ics, 2(3), 195-204, 1997.<br />
151<br />
Copyright © <str<strong>on</strong>g>2011</str<strong>on</strong>g> by Laboratory Soete
Sustainable C<strong>on</strong>structi<strong>on</strong> and Design <str<strong>on</strong>g>2011</str<strong>on</strong>g><br />
SYMMETRY AND SIMILARITY PROPERTIES OF<br />
2D FIGURES<br />
Z. Szakál 1 , I. Zsoldos 2<br />
1<br />
Institute for Mechanical Engineering Technology, Faculty of Mechanical Engineering,<br />
Szent István University, Gödöllő, Hungary<br />
2<br />
Szechenyi István University, Győr<br />
Abstract A new algorithm has been developed to sort two-dimensi<strong>on</strong>al figures by their shape. The<br />
algorithm can find the figures having equal or approximately equal shape independently from<br />
geometrical measures and the complexity of the shapes. It is based <strong>on</strong> the definiti<strong>on</strong> of the symmetrydiagram<br />
which was introduced for symmetry recogniti<strong>on</strong> originally. The new method can be used for<br />
sorting different parts at assembly lines and for reverse engineering, too.<br />
Keywords: Symmetry-diagram, symmetry detecti<strong>on</strong>, shape detecti<strong>on</strong><br />
1 INTRODUCTION<br />
The sorting algorithm takes advantage of the feature of the symmetry-diagram (in other name the shapediagram)<br />
that it shows a unique shape property of the two-dimensi<strong>on</strong>al (2D) figures independently from<br />
geometrical measures i.e. it is a shape factor.<br />
The symmetry-diagram was introduced for symmetry detecti<strong>on</strong> originally [1]. The problem of symmetry<br />
detecti<strong>on</strong> has been extensively studied in numerous fields including visual percepti<strong>on</strong>, computer visi<strong>on</strong>,<br />
robotics, computati<strong>on</strong>al geometry and reverse engineering. Early methods c<strong>on</strong>centrated <strong>on</strong> finding perfect<br />
symmetries in 2D or 3D point sets [2], [3]. Since the restricti<strong>on</strong> to exact symmetries limits the use of these<br />
methods for real-world objects, a method was introduced for computing approximate global symmetries in<br />
3D point sets [4], but the complexity of the algorithm makes it impractical for large data sets. The noti<strong>on</strong> of<br />
approximate symmetry was formalized by expressing symmetry as a c<strong>on</strong>tinuous feature [5]. The<br />
examinati<strong>on</strong> of the correlati<strong>on</strong> of the Gaussian image was proposed to recover global reflective and<br />
rotati<strong>on</strong>al symmetries [6]. A shape descriptor was introduced that c<strong>on</strong>cisely encodes global reflective and<br />
rotati<strong>on</strong>al symmetries [7], [8]. Different applicati<strong>on</strong>s based <strong>on</strong> generalized complex moments [9], grouping<br />
feature points [10], [11], [12], isometric transformati<strong>on</strong>s [13], planar reflective symmetry transform [14] and<br />
generalized symmetry transformati<strong>on</strong> [15], [16] are used in image processing and mesh processing for<br />
detecting exact local and global reflecti<strong>on</strong>-symmetry and rotati<strong>on</strong>- symmetry of 2D and 3D images.<br />
The symmetries are often not exactly present, but <strong>on</strong>ly approximately present, due to measurement errors<br />
in the scanning process, and approximati<strong>on</strong> and numerical errors in model rec<strong>on</strong>structi<strong>on</strong> during reverse<br />
engineering [17]. Beside this, different CAD systems often use different tolerances [18], and what is<br />
symmetric in <strong>on</strong>e CAD system may be <strong>on</strong>ly approximately symmetric in another. To solve these problems<br />
new algorithms based <strong>on</strong> the B-rep model were developed to find approximate rotati<strong>on</strong>al and translati<strong>on</strong>al<br />
symmetries of 3D forms built from simple geometric units [19] and complex 3D forms [20] in reverse<br />
engineering.<br />
However a number of outstanding methods for symmetry recogniti<strong>on</strong> can be found in the literature, most of<br />
them do not take advantage of the fact that every symmetry axis of a 2D figure has to cross the gravity<br />
centre [2-20].<br />
The symmetry-diagram is defined as the followings [1]:<br />
−<br />
−<br />
−<br />
The c<strong>on</strong>tour of the 2D figure is needed to be known for the definiti<strong>on</strong>.<br />
A number between 0 and 1 signed by ‘Z’ (0
Sustainable C<strong>on</strong>structi<strong>on</strong> and Design <str<strong>on</strong>g>2011</str<strong>on</strong>g><br />
Independently from the fact that a given 2D figure is symmetric or not the symmetry-diagram is a shape<br />
factor: The symmetry-diagrams are different for the figures having different shape. Beside this: the<br />
symmetry-diagrams of coincident figures are the same and the symmetry-diagrams of approximately<br />
coincident figures are approximately same. The symmetry-diagrams of geometrically similar figures are the<br />
same (independently from geometrical measures) and the symmetry-diagrams of approximately similar<br />
figures are approximately same. Because of this important property of the symmetry-diagram it can be<br />
applied for recogniti<strong>on</strong> of figures having the same or approximately same shape (independently from<br />
geometrical measures). There is <strong>on</strong>ly <strong>on</strong>e limit of the recogniti<strong>on</strong>: figures having more closed c<strong>on</strong>centric<br />
curves as boundary (e.g. two c<strong>on</strong>centric circles, the spacer) have the same symmetry-diagram.<br />
2 THE SORTING ALGORITHM<br />
Effective sorting and seeking (e. g. faulty seeking) algorithms are applied in the most different fields as for<br />
example in the data sorting [21], [22], in the sound technique [23] and in the image technique [24-33]. In the<br />
image technique <strong>on</strong>e of the most relevant problems is the shape detecti<strong>on</strong> c<strong>on</strong>sisting of two different partial<br />
problems: the shape detecti<strong>on</strong> as boundary detecti<strong>on</strong> of the image segmentati<strong>on</strong> and the shape detecti<strong>on</strong><br />
(shape recogniti<strong>on</strong>) as making differences between figures having different shape. In the case of the<br />
boundary detecti<strong>on</strong> a lot of effective algorithms are known [24-28]. In the field of the shape recogniti<strong>on</strong> the<br />
soluti<strong>on</strong>s of the most different special problems are worked out as for example a fruit sorting algorithm [29],<br />
a face detecti<strong>on</strong> algorithm [30], a traffic sign shape classificati<strong>on</strong> algorithm [31]. A so called distance<br />
measure [32] and the gradient-based shape descriptor [33] were developed to distinguish different classes<br />
of the 2D figures.<br />
The new sorting algorithm shown in this work is a general algorithm which can be used without limits in all<br />
2D applicati<strong>on</strong> fields of the shape recogniti<strong>on</strong>.<br />
Knowing the definiti<strong>on</strong> of the symmetry-diagram the sorting algorithm c<strong>on</strong>sists of several simple steps:<br />
−<br />
−<br />
−<br />
The input of the algorithm is the set of the boundaries of the 2D figures.<br />
The symmetry-diagram of every 2D figure is computed.<br />
The subsets of same or approximately same diagrams are divided.<br />
We show the process in a case-study from the mechanical engineering. In Figure 1 a photo of screws,<br />
screw-nuts and spacers having different measures can be seen. The photo shows the result of an image<br />
process, as well. The red curves are fitted to the boundaries of the elements and the set of these c<strong>on</strong>tours<br />
is the input of the sorting algorithm.<br />
11<br />
1<br />
2<br />
5<br />
6<br />
7<br />
3<br />
9<br />
8<br />
15<br />
12<br />
13<br />
4<br />
10<br />
17<br />
14<br />
18<br />
16<br />
Figure 1. The input of the sorting algorithm is the set of the c<strong>on</strong>tours of the elements signed by red curves.<br />
The numbers are the identificati<strong>on</strong>s of the elements.<br />
153<br />
Copyright © <str<strong>on</strong>g>2011</str<strong>on</strong>g> by Laboratory Soete
Sustainable C<strong>on</strong>structi<strong>on</strong> and Design <str<strong>on</strong>g>2011</str<strong>on</strong>g><br />
At using the sorting algorithm it has to be taken down the outer outline of c<strong>on</strong>figurati<strong>on</strong>s. Part aggregati<strong>on</strong><br />
can be seen in Figure 1. where the red colour marks the outlines of parts. Numbers mark certain parts in<br />
the sake for later identificati<strong>on</strong>. We handle separately with the algorithm the outline of certain parts. In case<br />
of each part We take down the picture points of outlines forming the parts in a co-ordinate system. The<br />
symmetry-diagram calculated to each part after the algorithm run can be seen in Figure 2. arranged. It can<br />
be seen well <strong>on</strong> the symmetry-diagrams the parts examined can be simply grouped. The sorting of parts<br />
can be carried out by taken to the Z-parameter to difference but characteristic ranges.<br />
Figure 2. The summed-up results<br />
Those parts are similar to circle which Z parameter is greater than 0,9 in all rotati<strong>on</strong> angle-positi<strong>on</strong>s of<br />
symmetry-diagrams. For each diagram to be seen in Figure 3. is true 0,9
Sustainable C<strong>on</strong>structi<strong>on</strong> and Design <str<strong>on</strong>g>2011</str<strong>on</strong>g><br />
Figure 4. A strict range of circular c<strong>on</strong>figurati<strong>on</strong><br />
Further grouping possibility presents <strong>on</strong>eself in Figure 4. The value of Z parameter can be found between<br />
0,974-0,98 in 0,006 z<strong>on</strong>e. Examining the shape of curves found in the very strict z<strong>on</strong>e it comes to light that<br />
the 11. and 18. c<strong>on</strong>figurati<strong>on</strong>s differ in some measures from the other similar circular c<strong>on</strong>figurati<strong>on</strong>s.<br />
Bey<strong>on</strong>d <strong>on</strong> that they resemble to the circle there is surely <strong>on</strong> then a preferred point (the shot of spring<br />
washer). The outstanding parameter values to be found <strong>on</strong> the various angular positi<strong>on</strong>s of the 11. and 18.<br />
c<strong>on</strong>figurati<strong>on</strong> curves derive from the different orientati<strong>on</strong>s of washers.<br />
The number 5. part of the Figure 22. is also a spring washer which can not be distinguished with the<br />
present single-camera examinati<strong>on</strong> from the other washers. In this case the examinati<strong>on</strong> from two separate<br />
camera line-ups gives sure soluti<strong>on</strong>.<br />
Figure 5. Rectangular like c<strong>on</strong>figurati<strong>on</strong>s with large side-edge ratio<br />
The characteristic of curves to be seen in Figure 5. is that it can be found parameter near to Z=1 in two<br />
angular positi<strong>on</strong>s. This type symmetry-diagram is characteristic to rectangulars with at least 1/6 side ratio.<br />
On the diagrams of number 1. and 4. pin like parts can be seen in present case. In case of both parts the<br />
0<br />
value of visible approximate symmetry in the 90 angular positi<strong>on</strong> of the curves is smaller than in<br />
0<br />
0 angular positi<strong>on</strong> of these. The n<strong>on</strong> full symmetry is due to smaller slots <strong>on</strong> c<strong>on</strong>figurati<strong>on</strong>s.<br />
155<br />
Copyright © <str<strong>on</strong>g>2011</str<strong>on</strong>g> by Laboratory Soete
Sustainable C<strong>on</strong>structi<strong>on</strong> and Design <str<strong>on</strong>g>2011</str<strong>on</strong>g><br />
Figure 6. Curves of bolt like c<strong>on</strong>figurati<strong>on</strong>s<br />
The curves of Figure 6 resemble to curves shown in Figure 5. here it is also true that they mark rectangular<br />
like c<strong>on</strong>figurati<strong>on</strong> with large side-edge ratio (in 2D rectangular, in 3D it can be just like cylindric). The cause<br />
0<br />
of local parameter reducti<strong>on</strong> of the symmetry-diagram in 90 angular positi<strong>on</strong> is the result of irreversible<br />
symmetry defect. The symmetry deformati<strong>on</strong> derives from the head formati<strong>on</strong> of bolts and rivets in present<br />
case. The aggregati<strong>on</strong> c<strong>on</strong>tains also bolts and rivets during examinati<strong>on</strong> to which We have carried out the<br />
run. The algorithm can not distinguish these parts in this resoluti<strong>on</strong>. If there are previous knowledge<br />
c<strong>on</strong>cering the c<strong>on</strong>figurati<strong>on</strong> examined then increasing the resoluti<strong>on</strong> of picture processing these parts<br />
already can be distinguished, too.<br />
Figure 7. Symmetry-diagram characterizing hexag<strong>on</strong> parts<br />
The curves having got 6 local maximums can be seen in Figure 7. this means that the c<strong>on</strong>figurati<strong>on</strong> 6. and<br />
16. are hexag<strong>on</strong> am<strong>on</strong>g the c<strong>on</strong>figurati<strong>on</strong>s examined. That comes also to light from the symmetry-diagram<br />
that damages, deformati<strong>on</strong>s can be found <strong>on</strong> the hexag<strong>on</strong> c<strong>on</strong>figurati<strong>on</strong>s examined. The curves should<br />
reach six times the Z=1 value in ideal case.<br />
It can be seen from the results got during the run that the software produced by us recognizes the similarity<br />
of opti<strong>on</strong>al planar c<strong>on</strong>figurati<strong>on</strong>s. The algorithm is not suitable determining symmetry characteristic in case<br />
of c<strong>on</strong>figurati<strong>on</strong>s with c<strong>on</strong>centric outline (for example: washer). This during sorting of parts it can not neither<br />
distinguish the washer from a disc.<br />
156<br />
Copyright © <str<strong>on</strong>g>2011</str<strong>on</strong>g> by Laboratory Soete
Sustainable C<strong>on</strong>structi<strong>on</strong> and Design <str<strong>on</strong>g>2011</str<strong>on</strong>g><br />
3 CONCLUSIONS<br />
The symmetry searching algorithm developed during our research work is suitable to sort for example bulk<br />
joint-elements. Presently the algorithm makes possible the classificati<strong>on</strong> according to shape. The presorting<br />
of bulk parts can be solved by this. It can not be used to sort according to dimensi<strong>on</strong>. However the<br />
algorithm determines the symmetry characteristics based <strong>on</strong> digital pictures by setting up proporti<strong>on</strong>s from<br />
geometric dimensi<strong>on</strong>s, because of from the pictures examined the geometric dimensi<strong>on</strong>s of c<strong>on</strong>figurati<strong>on</strong>s<br />
can be also decided during processing. By utilizing this the algorithm can be made suitable to classify<br />
according to dimensi<strong>on</strong>, too.<br />
It has been started the realizati<strong>on</strong> in technological circumstances the automatized pre-sorting of bulk jointelements.<br />
We have started with the engineers of the company renewing aeroplane power plants in<br />
Veresegyház the practical realizati<strong>on</strong> of the method worked out by me. The work is presently in the phase<br />
of planning and instrument obtaining.<br />
The cold forming standard (MSZ EN 10142:2000) c<strong>on</strong>taining low-carb<strong>on</strong> c<strong>on</strong>tent strip steel and plate hotdip<br />
galvanized qualifies the determinati<strong>on</strong> the so called zinc-flowers formed during the process by<br />
measuring number that can be determined with n<strong>on</strong> exact mode. The standard uses the following ideas for<br />
putting in row according to dimensi<strong>on</strong> of zink-flowers formed <strong>on</strong> the surface galvanized: small-, medium,<br />
large zinc-flowers. Putting in row the zinc-flowers according to the standard is important c<strong>on</strong>cerning use, as<br />
for example cold formability, colorability.<br />
I think so that with the symmetry searching method worked out by us, based <strong>on</strong> the symmetry<br />
characteristics it could be determined unambiguously the dimensi<strong>on</strong> steps of zinc-flowers according to<br />
various fields of use.<br />
There are in trade straw cutters developed for this aim with various c<strong>on</strong>structi<strong>on</strong>s for using as an energetics<br />
aim of agricultural crops. The most important viewpoint is the sturdy structure durability and the reliability at<br />
designing harvesting machines. The size and the shape of chaff are an important viewpoint during using for<br />
energetics aim. The dimensi<strong>on</strong>, shape and surface of the chippings have got an emphasized rule<br />
c<strong>on</strong>cerning the firing technique. The presently wide-spread stem chippings is suitable for firing, but for<br />
operating boilers with good efficiency is indispensable to produce homogeneous-and optimum size solid<br />
fuel for equipment given.<br />
By using the method drawn up to search the symmetry it can be worked out an appliance provided with an<br />
<strong>on</strong>line data collecting system which qualifies the chippings c<strong>on</strong>sidering morphology during cutting chaff.<br />
Based <strong>on</strong> the results by this way a c<strong>on</strong>trol can be developed for optimizing the technological parameters of<br />
straw cutters.<br />
4 ACKNOWLEDGEMENTS<br />
The authors would like to acknowledge the support of supported by OTKA grants K 73776 in Hungary.<br />
5 REFERENCES<br />
[1] Z. Szakal, I. Zsoldos: The Symmetry-Diagram as a Tool of the Pattern Recogniti<strong>on</strong>, <str<strong>on</strong>g>Internati<strong>on</strong>al</str<strong>on</strong>g><br />
Journal of Mathematical Models and Methods in Applied Sciences, <str<strong>on</strong>g>Issue</str<strong>on</strong>g> 4, <str<strong>on</strong>g>Volume</str<strong>on</strong>g> 2, 523-532, 2008,<br />
ISSN: 1998-0140<br />
[2] J. WOLTER, T. WOO, R. VOLZ, Optimal algorithms for symmetry detecti<strong>on</strong> in two and three<br />
dimensi<strong>on</strong>s. The Visual Computer, 1985.<br />
[3] M. ATALLAH, On symmetry detecti<strong>on</strong>. IEEE Trans. On Computers 34, 7, 2004, pp. 663–666.<br />
[4] H. ALT, K. MEHLHORN, H. WAGENER, E. WELZL, C<strong>on</strong>gruence, Similarity and symmetries of<br />
geometric objects. Discrete Comput. Geom. 3, 1988, pp. 237–256.<br />
[5] H. ZABRODSKY, S. PELEG, D. AVNIR, Symmetry as a c<strong>on</strong>tinuous feature. IEEE PAMI, 17, 1995.<br />
[6] C.Sun, J. Sherrah, 3D symmetry detecti<strong>on</strong> using the extended Gaussian image. IEEE Transacti<strong>on</strong>s <strong>on</strong><br />
Pattern Analysis and Machine Intelligence, 19, 2, 1997, pp. 164–8.<br />
[7] M.KAZHDAN, B. CHAZELLE, D.P. DOBKIN, A. FINKELSTEIN, T. FUNKHOUSER, A reflective<br />
symmetry descriptor. In Proceedings of ECCV, 2002, pp. 642–656.<br />
[8] M.KAZHDAN, T. FUNKHOUSER, S. RUSINKIEWICZ, Symmetry descriptors and 3d shape matching.<br />
In Symposium <strong>on</strong> Geometry Processing, 2004, pp. 116–125.<br />
157<br />
Copyright © <str<strong>on</strong>g>2011</str<strong>on</strong>g> by Laboratory Soete
Sustainable C<strong>on</strong>structi<strong>on</strong> and Design <str<strong>on</strong>g>2011</str<strong>on</strong>g><br />
[9] D. Shen, H. Ip, K. Cheung, E. Teoh, Symmetry detecti<strong>on</strong> by generalized complex (GC) moments: A<br />
close-form soluti<strong>on</strong>. IEEE Transacti<strong>on</strong>s <strong>on</strong> Pattern Analysis and Machine Intelligence, 21, 5, 1999, pp.<br />
466–76.<br />
[10] G. Loy, J. Eklundh, Detecting symmetry and symmetric c<strong>on</strong>stellati<strong>on</strong>s of features. In: ECCV 2006, Part<br />
II. LNCS, Vol. 3952. Springer-Verlag; 2006, pp. 508–21.<br />
[11] N. Mitra, L. Guibas, M. Pauly, Partial and approximate symmetry detecti<strong>on</strong> for 3D geometry. ACM<br />
Transacti<strong>on</strong>s <strong>on</strong> Graphics, 25, 3, 2006, pp. 560–8.<br />
[12] N. Mitra, L. Guibas L, M. Pauly, Symmetrizati<strong>on</strong>. ACM Transacti<strong>on</strong>s <strong>on</strong> Graphics, 26, 3, 2007, Art. No.<br />
63<br />
[13] A. Martinet, C. Soler, N. Holzschuch, FX. Silli<strong>on</strong>, Accurate detecti<strong>on</strong> of symmetries in 3D shapes. ACM<br />
Transacti<strong>on</strong>s <strong>on</strong> Graphics, 25, 2, 2006, pp. 439–64.<br />
[14] J. Podolak, P. Shilane, A. Golovinskiy, S. Rusinkiewicz, T. Funkhouser, A planar-reflective symmetry<br />
transform for 3D shapes. ACM Transacti<strong>on</strong>s <strong>on</strong> Graphics 25, 3, 2006, pp. 549–59.<br />
[15] D. Reisfeld, H. Wolfs<strong>on</strong>, Y. Yeshurun, C<strong>on</strong>text Free Attenti<strong>on</strong>al Operators: the Generalized Symmetry<br />
Transform, Int. J. Comput. Visi<strong>on</strong> 14, 2, 1995, pp. 119-130.<br />
[16] W.H. Li, A.M. Zhang, L. Kleeman, Global reflecti<strong>on</strong>al symmetry detecti<strong>on</strong> for robotic grasping and visual<br />
tracking, ACRA 05, Australasian <str<strong>on</strong>g>C<strong>on</strong>ference</str<strong>on</strong>g> <strong>on</strong> Robotics and Automati<strong>on</strong>, 2005.<br />
http://www.visi<strong>on</strong>bib.com/bibliography/journal/acr.html#ACRA05<br />
[17] T. Varady, R. Martin, J. Cox, Reverse engineering of geometric models - an introducti<strong>on</strong>, Computer-<br />
Aided Design 29, 4, 1997, pp. 255–68.<br />
[18] M. Pratt, B. Anders<strong>on</strong>, T. Ranger, Towards the standardized exchange of parameterized feature-based<br />
CAD models. Computer-Aided Design 37, 12, 2005, pp. 1251–65.<br />
[19] B. Mills, F. Langbein, A. Marshall, R. Martin, Approximate symmetry detecti<strong>on</strong> for reverse engineering.<br />
In: Proc. 6 th ACM symp. solid and physical modeling, 2001, pp. 241–8.<br />
[20] M. Li, F. Langbein, R. Martin, Detecting approximate symmetries of discrete point subsets, Computer-<br />
Aided Design 40, 1, 2008, pp. 76-93.<br />
[21] Chenn-Jung Huang, Chih-Tai Guan and Yi-Ta Chuang, A Key-Address Mapping Sort Algorithm,<br />
Proceedings of the <str<strong>on</strong>g>5th</str<strong>on</strong>g> WSEAS <str<strong>on</strong>g>Internati<strong>on</strong>al</str<strong>on</strong>g> <str<strong>on</strong>g>C<strong>on</strong>ference</str<strong>on</strong>g> <strong>on</strong> Applied Computer Science, Hangzhou,<br />
China, April 16-18, 2006 (pp352-357)<br />
[22] Changsoo Kim, Sungroh Yo<strong>on</strong>, D<strong>on</strong>gseung Kim, Parallel External Sort of Floating-Point Data by Integer<br />
C<strong>on</strong>versi<strong>on</strong>, APPLIED COMPUTING CONFERENCE (ACC '08), Istanbul, Turkey, May 27-30, 2008.<br />
[23] Ryuichi Ishino, Detecti<strong>on</strong> System of Faulty Ground Wires from Aerial Video of Transmissi<strong>on</strong> Lines with<br />
C<strong>on</strong>siderati<strong>on</strong> of Influence of Devices <strong>on</strong> Ground Wires, Proceedings of the 6th WSEAS/IASME Int.<br />
C<strong>on</strong>f. <strong>on</strong> Electric Power Systems, High Voltages, Electric Machines, Tenerife, Spain, December 16-18,<br />
2006<br />
[24] Francesco de Pasquale, Julian Stander, A multi-scale template method for shape detecti<strong>on</strong> with biomedical<br />
applicati<strong>on</strong>s, Pattern Anal. Applic, 2009, 12:179–192<br />
[25] JIAN'AN LUAN, JULIAN STANDER* and DAVID WRIGHT, On shape detecti<strong>on</strong> in noisy images with<br />
particular reference to ultras<strong>on</strong>ography, Statistics and Computing (1998) 8:377-389<br />
[26] Lena Gorelick, R<strong>on</strong>en Basri, Shape Based Detecti<strong>on</strong> and Top-Down Delineati<strong>on</strong> Using Image<br />
Segments, Int. J. Comput. Vis. 2009, 83: 211–232<br />
[27] N. Guil, J.M. G<strong>on</strong>zalez-Linares, E.L. Zapata, Bidimensi<strong>on</strong>al shape detecti<strong>on</strong> using an invariant<br />
approach, Pattern Recogniti<strong>on</strong> 1999, 32:1025–1038<br />
[28] ROSEMARY IRRGANG, An Intelligent Snake Growing Algorithm for Fuzzy Shape Detecti<strong>on</strong>, Expert<br />
Systems With Applicati<strong>on</strong>s. 1996 Vol. 11, No. 4, pp. 531-536<br />
[29] GUI Jiang-sheng, RAO Xiu-qin, YING Yi-bin, Fruit shape detecti<strong>on</strong> by level set, Gui et al. / J. Zhejiang<br />
Univ. Sci. A 2007, 8(8):1232-1236<br />
[30] Eli Saber, A. Murat Tekalp, Fr<strong>on</strong>tal-view face detecti<strong>on</strong> and facial feature extracti<strong>on</strong> using color, shape<br />
and symmetry based cost functi<strong>on</strong>s, Pattern Recogniti<strong>on</strong> Letters 1998, 19:669–680<br />
[31] Ryuichi Ishino, Detecti<strong>on</strong> System of Faulty Ground Wires from Aerial Video of Transmissi<strong>on</strong> Lines with<br />
C<strong>on</strong>siderati<strong>on</strong> of Influence of Devices <strong>on</strong> Ground Wires, Proceedings of the 6th WSEAS/IASME Int.<br />
158<br />
Copyright © <str<strong>on</strong>g>2011</str<strong>on</strong>g> by Laboratory Soete
Sustainable C<strong>on</strong>structi<strong>on</strong> and Design <str<strong>on</strong>g>2011</str<strong>on</strong>g><br />
C<strong>on</strong>f. <strong>on</strong> Electric Power Systems, High Voltages, Electric Machines, Tenerife, Spain, December 16-18,<br />
2006<br />
[32] Lena Gorelick · R<strong>on</strong>en Basri, Shape Based Detecti<strong>on</strong> and Top-Down Delineati<strong>on</strong> Using Image<br />
Segments, Int J Comput. Vis. 2009, 83: 211–232<br />
[33] Abdulkerim Çapar, Binnur Kurt, Muhittin Gökmen, Gradient-based shape descriptors, Machine Visi<strong>on</strong><br />
and Applicati<strong>on</strong>s 2009, 20:365–378<br />
159<br />
Copyright © <str<strong>on</strong>g>2011</str<strong>on</strong>g> by Laboratory Soete
ISSN : 2032-7471