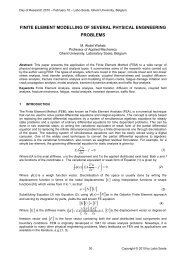
Volume 2, Issue 1, 2011, Full Text - 5th International Conference on ...
Volume 2, Issue 1, 2011, Full Text - 5th International Conference on ...
Volume 2, Issue 1, 2011, Full Text - 5th International Conference on ...

You also want an ePaper? Increase the reach of your titles
YUMPU automatically turns print PDFs into web optimized ePapers that Google loves.
Sustainable C<strong>on</strong>structi<strong>on</strong> and Design <str<strong>on</strong>g>2011</str<strong>on</strong>g><br />
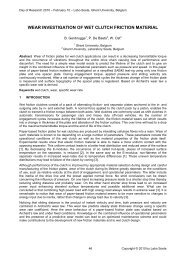
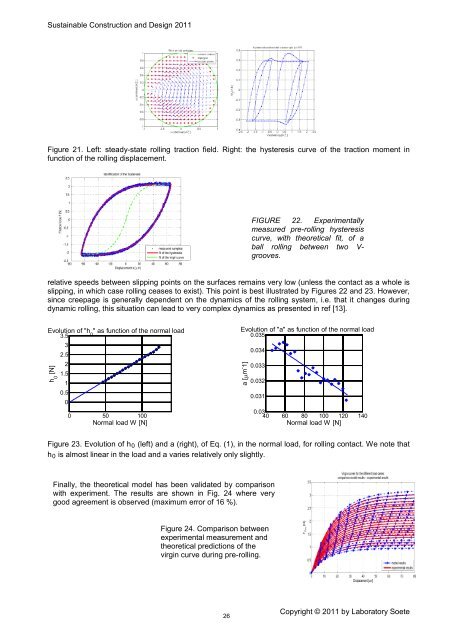
Figure 21. Left: steady-state rolling tracti<strong>on</strong> field. Right: the hysteresis curve of the tracti<strong>on</strong> moment in<br />
functi<strong>on</strong> of the rolling displacement.<br />
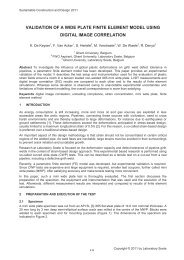
FIGURE 22. Experimentally<br />
measured pre-rolling hysteresis<br />
curve, with theoretical fit, of a<br />
ball rolling between two V-<br />
grooves.<br />
relative speeds between slipping points <strong>on</strong> the surfaces remains very low (unless the c<strong>on</strong>tact as a whole is<br />
slipping, in which case rolling ceases to exist). This point is best illustrated by Figures 22 and 23. However,<br />
since creepage is generally dependent <strong>on</strong> the dynamics of the rolling system, i.e. that it changes during<br />
dynamic rolling, this situati<strong>on</strong> can lead to very complex dynamics as presented in ref [13].<br />
Evoluti<strong>on</strong> of "h<br />
3.5 0<br />
" as functi<strong>on</strong> of the normal load<br />
3<br />
2.5<br />
2<br />
1.5<br />
1<br />
0.5<br />
0<br />
h 0<br />
[N]<br />
0 50 100<br />
Normal load W [N]<br />
Evoluti<strong>on</strong> of "a" as functi<strong>on</strong> of the normal load<br />
0.035<br />
a [µm - 1]<br />
0.034<br />
0.033<br />
0.032<br />
0.031<br />
0.03<br />
40 60 80 100 120 140<br />
Normal load W [N]<br />
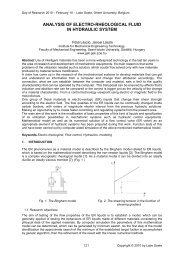
Figure 23. Evoluti<strong>on</strong> of h 0 (left) and a (right), of Eq. (1), in the normal load, for rolling c<strong>on</strong>tact. We note that<br />
h 0 is almost linear in the load and a varies relatively <strong>on</strong>ly slightly.<br />
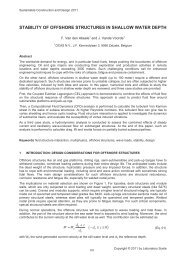
Finally, the theoretical model has been validated by comparis<strong>on</strong><br />
with experiment. The results are shown in Fig. 24 where very<br />
good agreement is observed (maximum error of 16 %).<br />
Figure 24. Comparis<strong>on</strong> between<br />
experimental measurement and<br />
theoretical predicti<strong>on</strong>s of the<br />
virgin curve during pre-rolling.<br />
26<br />
Copyright © <str<strong>on</strong>g>2011</str<strong>on</strong>g> by Laboratory Soete