Volume 2, Issue 1, 2011, Full Text - 5th International Conference on ...
Volume 2, Issue 1, 2011, Full Text - 5th International Conference on ...
Volume 2, Issue 1, 2011, Full Text - 5th International Conference on ...

Create successful ePaper yourself
Turn your PDF publications into a flip-book with our unique Google optimized e-Paper software.
Day of Research 2010 – February 10 – Labo Soete, Ghent University, Belgium<br />
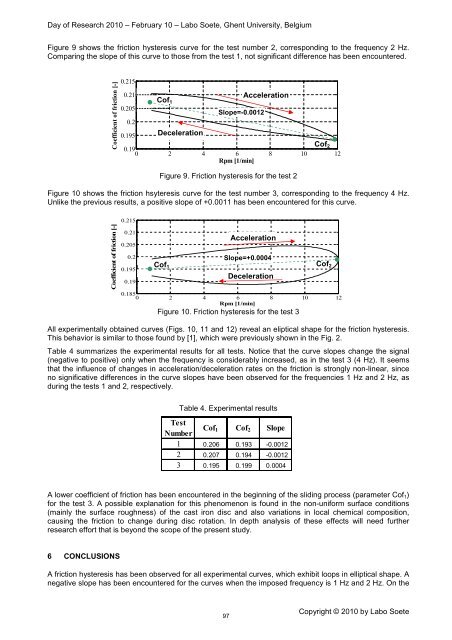
Figure 9 shows the fricti<strong>on</strong> hysteresis curve for the test number 2, corresp<strong>on</strong>ding to the frequency 2 Hz.<br />
Comparing the slope of this curve to those from the test 1, not significant difference has been encountered.<br />
Coefficient of fricti<strong>on</strong> [-]<br />
0.215<br />
0.21<br />
0.205<br />
0.2<br />
Cof 1<br />
Slope=-0.0012<br />
Accelerati<strong>on</strong><br />
0.195 Decelerati<strong>on</strong><br />
Cof 2<br />
0.19<br />
0 2 4 6 8 10 12<br />
Rpm [1/min]<br />
Figure 9. Fricti<strong>on</strong> hysteresis for the test 2<br />
Figure 10 shows the fricti<strong>on</strong> hsyteresis curve for the test number 3, corresp<strong>on</strong>ding to the frequency 4 Hz.<br />
Unlike the previous results, a positive slope of +0.0011 has been encountered for this curve.<br />
Coefficient of fricti<strong>on</strong> [-]<br />
0.215<br />
0.21<br />
0.205<br />
0.2<br />
0.195<br />
0.19<br />
Accelerati<strong>on</strong><br />
Slope=+0.0004<br />
Cof 1<br />
Cof 2<br />
Decelerati<strong>on</strong><br />
0.185<br />
0 2 4 6 8 10 12<br />
Rpm [1/min]<br />
Figure 10. Fricti<strong>on</strong> hysteresis for the test 3<br />
All experimentally obtained curves (Figs. 10, 11 and 12) reveal an eliptical shape for the fricti<strong>on</strong> hysteresis.<br />
This behavior is similar to those found by [1], which were previously shown in the Fig. 2.<br />
Table 4 summarizes the experimental results for all tests. Notice that the curve slopes change the signal<br />
(negative to positive) <strong>on</strong>ly when the frequency is c<strong>on</strong>siderably increased, as in the test 3 (4 Hz). It seems<br />
that the influence of changes in accelerati<strong>on</strong>/decelerati<strong>on</strong> rates <strong>on</strong> the fricti<strong>on</strong> is str<strong>on</strong>gly n<strong>on</strong>-linear, since<br />
no significative differences in the curve slopes have been observed for the frequencies 1 Hz and 2 Hz, as<br />
during the tests 1 and 2, respectively.<br />
Table 4. Experimental results<br />
Test<br />
Number<br />
Cof 1 Cof 2 Slope<br />
1 0.206 0.193 -0.0012<br />
2 0.207 0.194 -0.0012<br />
3 0.195 0.199 0.0004<br />
A lower coefficient of fricti<strong>on</strong> has been encountered in the beginning of the sliding process (parameter Cof 1 )<br />
for the test 3. A possible explanati<strong>on</strong> for this phenomen<strong>on</strong> is found in the n<strong>on</strong>-uniform surface c<strong>on</strong>diti<strong>on</strong>s<br />
(mainly the surface roughness) of the cast ir<strong>on</strong> disc and also variati<strong>on</strong>s in local chemical compositi<strong>on</strong>,<br />
causing the fricti<strong>on</strong> to change during disc rotati<strong>on</strong>. In depth analysis of these effects will need further<br />
research effort that is bey<strong>on</strong>d the scope of the present study.<br />
6 CONCLUSIONS<br />
A fricti<strong>on</strong> hysteresis has been observed for all experimental curves, which exhibit loops in elliptical shape. A<br />
negative slope has been encountered for the curves when the imposed frequency is 1 Hz and 2 Hz. On the<br />
97<br />
Copyright © 2010 by Labo Soete